. 2015 May 27;7(289):289ra86.
doi: 10.1126/scitranslmed.aaa8103.

SLC7A11 expression is associated with seizures and predicts poor survival in patients with malignant glioma

Affiliations

SLC7A11 expression is associated with seizures and predicts poor survival in patients with malignant glioma

Stephanie M Robert et al. Sci Transl Med. .

Abstract

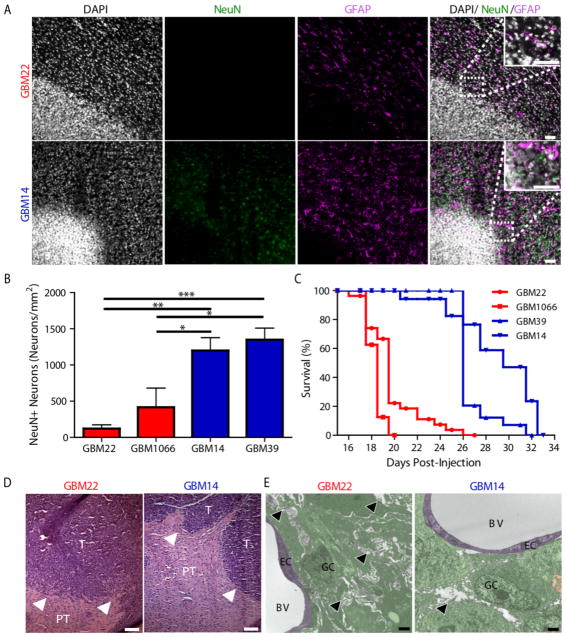
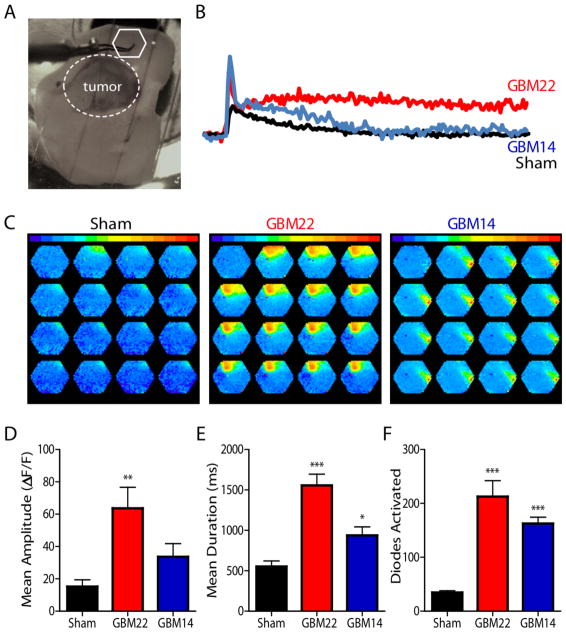
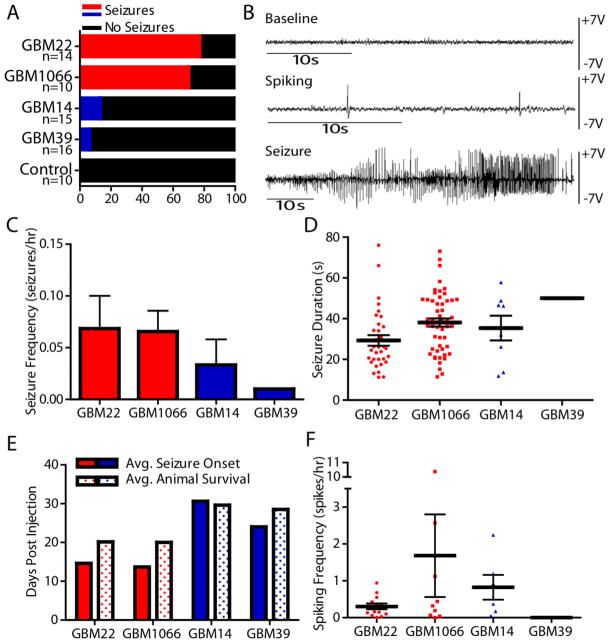
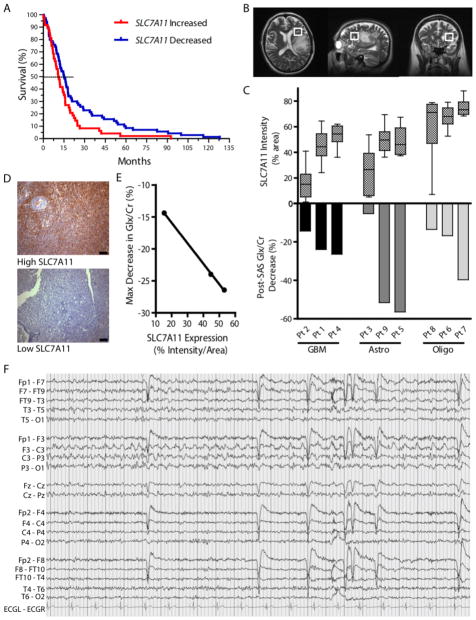
Glioma is the most common malignant primary brain tumor. Its rapid growth is aided by tumor-mediated glutamate release, creating peritumoral excitotoxic cell death and vacating space for tumor expansion. Glioma glutamate release may also be responsible for seizures, which complicate the clinical course for many patients and are often the presenting symptom. A hypothesized glutamate release pathway is the cystine/glutamate transporter System xc (-) (SXC), responsible for the cellular synthesis of glutathione (GSH). However, the relationship of SXC-mediated glutamate release, seizures, and tumor growth remains unclear. Probing expression of SLC7A11/xCT, the catalytic subunit of SXC, in patient and mouse-propagated tissues, we found that ~50% of patient tumors have elevated SLC7A11 expression. Compared with tumors lacking this transporter, in vivo propagated and intracranially implanted SLC7A11-expressing tumors grew faster, produced pronounced peritumoral glutamate excitotoxicity, induced seizures, and shortened overall survival. In agreement with animal data, increased SLC7A11 expression predicted shorter patient survival according to genomic data in the REMBRANDT (National Institutes of Health Repository for Molecular Brain Neoplasia Data) database. In a clinical pilot study, we used magnetic resonance spectroscopy to determine SXC-mediated glutamate release by measuring acute changes in glutamate after administration of the U.S. Food and Drug Administration-approved SXC inhibitor, sulfasalazine (SAS). In nine glioma patients with biopsy-confirmed SXC expression, we found that expression positively correlates with glutamate release, which is acutely inhibited with oral SAS. These data suggest that SXC is the major pathway for glutamate release from gliomas and that SLC7A11 expression predicts accelerated growth and tumor-associated seizures.


Conflict of interest statement

Competing interests: H. S. holds a patent on methods for treating glioma, US 8748445 B2. All other authors declare that they have no competing interests.

Figures

Fig. 1
Fig. 1
SXC is heterogeneously expressed in patient gliomas. (A) Representative examples of tissue microarrays (TMA) showing high (left) and low (right) SLC7A11 expression in tumor core (top) and edge (bottom) (n=41 patients). Center panels, higher magnification. Scale bars, 40 μm. (B) SLC7A11 immunoreactivity scores plotted as a function of frequency. Gaussian fits and testing for unimodality (Hartigans’ dip test; Peritumoral expression, P=0.4757; GBM core expression, *P=0.01626), identify a significant departure from a unimodal population in the GBM core, segregating into low (blue; n=22 patients) and high (red; n=19 patients) SLC7A11 expression, relative to the average peritumoral brain expression (black; n=36 patients). Means ± SEM; ANOVA, Tukey’s post-hoc test, ***P<0.0001, ns = not significant. (C) Western blot of SXC subunits (catalytic, SLC7A11; regulatory, CD98) in PDX-GBM samples (“GBM”), and a glioma cell line (U251); GAPDH, loading control, n=3 independent experiments. (D) Gliosphere medium glutamate concentrations, with or without (S)-4-CPG (n=3 independent experiments per condition). (E) SXC activity measured in reverse-transport mode, commonly used to measure transporter function(55, 56). Na+-free glutamate uptake with or without SXC inhibitors (S)-4-CPG and sulfasalazine (SAS); n=3 independent experiments per condition. (D, E) Means ± SEM; ANOVA, Tukey’s post-hoc test, *P<0.05, **P<0.01, ***P<0.0001, ns = not significant. (F) Fura-2 Ca2+-imaging of cortical neurons in bath-applied, gliosphere-conditioned medium. Application of GBM14-conditioned medium was followed by GBM22 medium, then 100 μM glutamate. In separate experiments, g liosphere-conditioned medium was applied with or without a glutamate receptor inhibitor (MK-801), or a SXC inhibitor ((S)-4-CPG; n=3 independent experiments per condition; 10–15 cells analyzed per experiment). (B–F) Red, higher SLC7A11 expression; blue, lower SLC7A11 expression.
Fig. 2
Fig. 2
SXC-expressing gliomas induce peritumoral neuronal cell loss, edema, and decreased survival. (A) Immunofluorescence of nuclei (Dapi, white), peritumoral neurons (NeuN, green), and astrocytes (GFAP, magenta) in cortices implanted with SXC-expressing (GBM22) and non-SXC-expressing (GBM14) gliomas. Inset, 2.5x magnification; scale bars, 50 μm. (B) Peritumoral NeuN+ neuron quantification in the SXC-expressing (red) and non-SXC-expressing (blue) gliomas (n=3 animals per condition). Means ± SEM; ANOVA, Tukey’s post-hoc test, *P<0.05, **P<0.01, ***P<0.0001. (C) Kaplan Meier plot of survival of tumor-bearing mice, days after injection for the SXC-expressing (GBM22, n=14 animals; GBM1066, n=10 animals) versus non-SXC-expressing (GBM14, n=15 animals; GBM39, n=16 animals) gliomas. (D) Representative H&E immunostaining of intracranially implanted SXC-expressing (GBM22; n=3 animals) and non-SXC-expressing (GBM14; n=3 animals) gliomas, highlighting less well defined borders of SXC-expressing gliomas, with finger-like projections invading into surrounding brain tissue (T = tumor, PT = peritumoral tissue; white arrowheads, tumor border). Scale bar, 100 μM. (E) Representative electron microscopy (EM) images showing cell morphology of SXC-expressing (GBM22, red; n=2 animals; 78 images analyzed) and non-SXC-expressing (GBM14, blue; n=2 animals; 46 images analyzed) intracranial gliomas. Tumoral and peritumoral edema (white areas, highlighted by black arrowheads) is apparent between the elaborately wound cellular processes of GBM22 cells. Less abundant, localized edema in GBM14 glioma-bearing cortex with more easily distinguished cell borders (right). GC = glioma cell(s)/processes (green), EC = endothelial cell (purple), BV = blood vessel, black arrowhead = edema. Scale bar, 2 μM.
Fig. 3
Fig. 3
Neurons peritumoral to SXC-expressing tumors are hyperexcitable. (A) Whole-cell patch-clamp recordings of layer II/III pyramidal neurons showing the mean resting membrane potential (RMP) of neurons in sham-injected control mice (Sham, black; n=18 neurons) versus peritumoral neurons in SXC-expressing (GBM22, red; n=23 neurons) and non-SXC-expressing (GBM14, blue; n=16 neurons) glioma-implanted cortex. (B) Representative recordings of whole-cell current-clamp recordings in response to −100 and +100 pA current injection (held at −70 mV), in neurons from sham-injected mice (Sham, black; n=19 neurons), and neurons peritumoral to SXC-expressing (GBM22, red; n=16 neurons) and non-SXC-expressing (GBM14, blue; n=16 neurons) glioma-implanted cortex. (C) Number of action potentials fired in response to depolarizing current steps applied from 0 – 100 pA in 20 pA increments (neurons held at −70 mV), in sham-injected controls (Sham, black; n=18 neurons), and peritumoral to SXC-expressing (GBM22, red; n=16 neurons) and non-SXC-expressing (GBM14, blue; n=16 neurons) glioma-implanted cortex. (A–C) Means ± SEM; ANOVA, Tukey’s post-hoc test compared to sham, *P<0.05. (D) Representative recordings of epileptiform activity induced by 10 μM bicuculline (Bic), in sham-injected controls (Sham, black; n=5 neurons), and neurons peritumoral to SXC-expressing (GBM22, red; n=4 neurons) and non-SXC-expressing (GBM14, blue; n=3 neurons) glioma-implanted cortex. *Individual epileptiform event on expanded time scale. (E) Sample recordings of epileptiform activity induced by magnesium-free ACSF in sham-injected controls (Sham, black; n=9 neurons), and neurons peritumoral to SXC-expressing (GBM22, red; n=7 neurons) and non-SXC-expressing (GBM14, blue; n=11 neurons) glioma-implanted cortex. *Indicates trace expanded in inset. (F) Latency to bicuculline-induced epileptiform activity in sham-injected controls (Sham, black; n=5 neurons), and neurons peritumoral to SXC-expressing (GBM22, red; n=4 neurons) and non-SXC-expressing (GBM14, blue; n=4 neurons) glioma-implanted cortex. (G) Latency to magnesium-free-induced epileptiform activity in sham-injected controls (Sham, black; n=9 neurons), and neurons peritumoral to SXC-expressing (GBM22, red; n=7 neurons) and non-SXC-expressing (GBM14, blue; n=11 neurons) glioma-implanted cortex. (F, G) Means ± SEM; ANOVA, Tukey’s post-hoc test compared to sham, *P<0.05, **P<0.01. (H) Percentage of neurons displaying epileptiform events at 30 min after magnesium-free ACSF was applied to sham-injected control slices (Sham, black; n=4/11 neurons) and neurons peritumoral to SXC-expressing (GBM22, red; n=9/11 neurons) and non-SXC-expressing (GBM14, blue; n=10/20 neurons) glioma-implanted cortex.
Fig. 4
Fig. 4
SXC-expressing gliomas create a hyperexcitable peritumoral network. Network excitability of glioma-bearing acute brain slices was detected by the voltage-sensitive fluorescent indicator RH-141. (A) Image illustrates placement of peritumoral recording electrode (white hexagon; white dotted circle defines tumor border). (B) Examples of individual diode responses and (C) spread of stimulus-induced activity in SXC-expressing (GBM22, red; n=3 animals) and non-SXC-expressing (GBM14, blue; n=3 animals) intracranially-implanted acute slices. Amplitude (D), duration (E), and number of diodes activated (F) during the response to threshold stimulation detected in GBM22 and GBM14 glioma-bearing acute slices, compared to sham-injected control animals (sham). (E–F) Means ± SEM; ANOVA, Tukey’s post-hoc test, *P<0.05, **P<0.01, ***P<0.0001. 5 ms intervals.
Fig. 5
Fig. 5
SXC-expressing gliomas cause seizures in vivo. (A) Percent of mice displaying EEG seizure activity (animals with ≥1 seizure(s) included in analysis; seizures confirmed by video monitoring) after intracranial implantation of SXC-expressing (Red; GBM22, n=14 animals; GBM1066, n=10 animals) versus non-SXC-expressing (Blue; GBM14, n=15 animals; GBM39, n=16 animals) gliomas. (B) Examples of in vivo EEG recordings of baseline (Baseline), interictal spike-wave epileptic discharges (Spiking), and seizure activity (Seizure) corresponding to tonic-clonic seizure activity. Seizure frequency (C) and duration (D) were calculated on the basis of recorded hours after the onset of the first seizure ((40 – 150 hours, depending on time of first seizure and recorded until animal death). Seizure duration includes all seizure activity recorded for each animal (2 status epilepticus events in GBM22-implanted animals were not included because the duration could not be accurately determined). (E) Comparison of the average day of initial seizure activity (Avg. Seizure Onset) versus average animal survival (Avg. Animal Survival) after intracranial injection (days post-injection). (F) Interictal spike-wave activity (Spiking) frequency calculated based on the number of recorded hours after the onset of initial interictal spike-wave activity. (C–F) Only animals with EEG/video-confirmed seizures were included in the analysis: GBM22, 13/14 animals; GBM1066, 7/10 animals; GBM14, 2/15 animals; GBM39, 1/16 animals). Meaningful statistics could not be performed because only a small number of non-SXC-expressing glioma-implanted animals had seizures or interictal spike-wave activity (GBM14, n=2 animals, 8 seizure events, 6 interictal spike-wave activity; GBM39, n=1 animals, 1 seizure event, 0 interictal spike-way activity) compared to SXC-expressing tumor-implanted animals.
Fig. 6
Fig. 6
Glioma SXC expression predicts patient survival and peritumoral glutamate response. (A) Kaplan Meier survival plot of patients in the Repository for Molecular Brain Neoplasia Data (REMBRANDT) database comparing gliomas with high SLC7A11 (≥150%) versus low expression (≤ 66%) of the SXC gene SLC7A11, compared to non-neoplastic brain (n=120 glioma (all grades) patients; Kaplan Meier analyzed using the log-rank test, P=0.0238). (B–E) Detection of peritumoral glutamate (Glx) measured by Magnetic Resonance Spectroscopy (MRS) in glioma patients before and after an acute sulfasalazine (SAS) dose (1 g). (B) Representative images showing voxel placement. (C) Peritumoral glutamate, detected as a peak composed of glutamate + glutamine (Glx), which is predominately glutamate(27), and quantified with respect to creatine (Cr). Intracranial Glx/Cr changes after SAS administration (Post-SAS) are graphed (bottom) and compared to SLC7A11 expression in patient glioma tissue (top) quantified by staining intensity (n=3 tissue samples per patient, total n=27; glioma types include glioblastoma (GBM), Astrocytoma (Astro), and Oligodendroglioma/Oligoastrocytoma (Oligo); Means ± SEM; ANOVA, P<0.0001). (D) Examples of high and low SLC7A11 staining of patient glioma tissue. Scale bars, 100 μM. (E) Linear correlation between maximum Glx/Cr decrease and GBM tissue SLC7A11 expression (Linear regression; *P=0.0134; R2=0.9996). (F) Tracing of ictal discharge from Pt. 8, showing left centroparietal focal seizure best appreciated in leads F3/C3 and C3/P3. High-frequency filter (HFF) = 30 Hz; timebase = 15 mm/sec.

Comment in

References

    1. Marcus HJ, Carpenter KL, Price SJ, Hutchinson PJ. In vivo assessment of high-grade glioma biochemistry using microdialysis: a study of energy-related molecules, growth factors and cytokines. J Neurooncol. 2010;97:11–23. - PubMed
    1. Ishiuchi S, et al. Blockage of Ca(2+)-permeable AMPA receptors suppresses migration and induces apoptosis in human glioblastoma cells. Nat Med. 2002;8:971–978. - PubMed
    1. Lai TW, Zhang S, Wang YT. Excitotoxicity and stroke: identifying novel targets for neuroprotection. Progress in neurobiology. 2014;115:157–188. - PubMed
    1. Bonova P, Burda J, Danielisova V, Nemethova M, Gottlieb M. Delayed postconditioning reduces post-ischemic glutamate level and improves protein synthesis in brain. Neurochemistry international. 2013;62:854–860. - PubMed
    1. Buckingham SC, et al. Glutamate release by primary brain tumors induces epileptic activity. Nat Med. 2011;17:1269–1274. - PMC - PubMed

Publication types