Using an optimality model to understand medium and long-term responses of vegetation water use to elevated atmospheric CO2 concentrations
- PMID: 26019228
- PMCID: PMC4497478
- DOI: 10.1093/aobpla/plv060
Using an optimality model to understand medium and long-term responses of vegetation water use to elevated atmospheric CO2 concentrations
Abstract
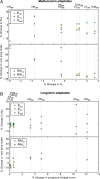
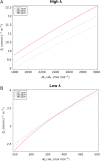
Vegetation has different adjustable properties for adaptation to its environment. Examples include stomatal conductance at short time scale (minutes), leaf area index and fine root distributions at longer time scales (days-months) and species composition and dominant growth forms at very long time scales (years-decades-centuries). As a result, the overall response of evapotranspiration to changes in environmental forcing may also change at different time scales. The vegetation optimality model simulates optimal adaptation to environmental conditions, based on the assumption that different vegetation properties are optimized to maximize the long-term net carbon profit, allowing for separation of different scales of adaptation, without the need for parametrization with observed responses. This paper discusses model simulations of vegetation responses to today's elevated atmospheric CO2 concentrations (eCO2) at different temporal scales and puts them in context with experimental evidence from free-air CO2 enrichment (FACE) experiments. Without any model tuning or calibration, the model reproduced general trends deduced from FACE experiments, but, contrary to the widespread expectation that eCO2 would generally decrease water use due to its leaf-scale effect on stomatal conductance, our results suggest that eCO2 may lead to unchanged or even increased vegetation water use in water-limited climates, accompanied by an increase in perennial vegetation cover.
Keywords: Adaptation; ecohydrology; evapotranspiration; global change; optimality; vegetation.
Published by Oxford University Press on behalf of the Annals of Botany Company.
Figures


References
-
- Ainsworth EA, Long SP. 2005. What have we learned from 15 years of free-air CO2 enrichment (FACE)? A meta-analytic review of the responses of photosynthesis, canopy properties and plant production to rising CO2. New Phytologist 165:351–371. - PubMed
-
- Barton CVM, Duursma RA, Medlyn BE, Ellsworth DS, Eamus D, Tissue DT, Adams MA, Conroy J, Crous KY, Liberloo M, Löw M, Linder S, McMurtrie RE. 2012. Effects of elevated atmospheric [CO2] on instantaneous transpiration efficiency at leaf and canopy scales in Eucalyptus saligna. Global Change Biology 18:585–595. 10.1111/j.1365-2486.2011.02526.x - DOI
-
- Battipaglia G, Saurer M, Cherubini P, Calfapietra C, McCarthy HR, Norby RJ, Francesca Cotrufo M. 2013. Elevated CO2 increases tree-level intrinsic water use efficiency: insights from carbon and oxygen isotope analyses in tree rings across three forest FACE sites. New Phytologist 197:544–554. 10.1111/nph.12044 - DOI - PubMed
-
- Berry SL, Roderick ML. 2002. CO2 and land-use effects on Australian vegetation over the last two centuries. Australian Journal of Botany 50:511–531. 10.1071/BT01019 - DOI
LinkOut - more resources
Full Text Sources
Other Literature Sources
Research Materials

