Randomized Controlled Trial
. 2015 May 27;35(21):8145-57.
doi: 10.1523/JNEUROSCI.2978-14.2015.

Reinforcement learning in multidimensional environments relies on attention mechanisms

Affiliations
Randomized Controlled Trial

Reinforcement learning in multidimensional environments relies on attention mechanisms

Yael Niv et al. J Neurosci. .

Abstract

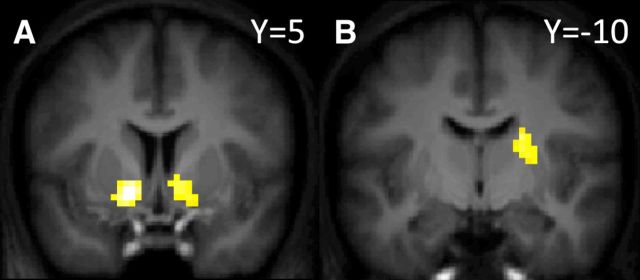
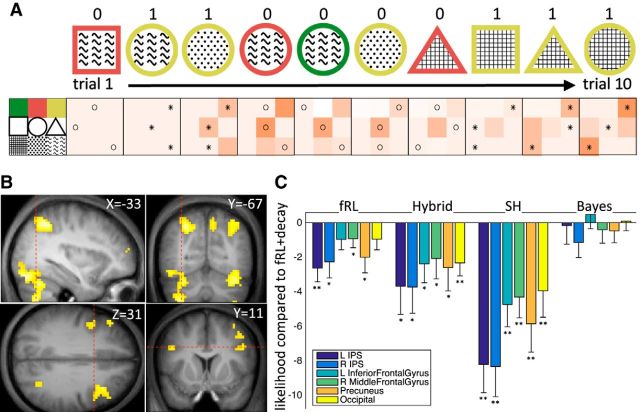
In recent years, ideas from the computational field of reinforcement learning have revolutionized the study of learning in the brain, famously providing new, precise theories of how dopamine affects learning in the basal ganglia. However, reinforcement learning algorithms are notorious for not scaling well to multidimensional environments, as is required for real-world learning. We hypothesized that the brain naturally reduces the dimensionality of real-world problems to only those dimensions that are relevant to predicting reward, and conducted an experiment to assess by what algorithms and with what neural mechanisms this "representation learning" process is realized in humans. Our results suggest that a bilateral attentional control network comprising the intraparietal sulcus, precuneus, and dorsolateral prefrontal cortex is involved in selecting what dimensions are relevant to the task at hand, effectively updating the task representation through trial and error. In this way, cortical attention mechanisms interact with learning in the basal ganglia to solve the "curse of dimensionality" in reinforcement learning.

Keywords: attention; fMRI; frontoparietal network; model comparison; reinforcement learning; representation learning.


Figures

Figure 1.
Figure 1.
Task and behavioral results. A, Schematic of the dimensions task. Participants were presented with three different stimuli, each having a different feature along each one of the three dimensions (shape, color, and texture). Participants then selected one of the stimuli and received binary reward feedback, winning 1 (depicted) or 0 points. After a short delay, a new trial began with three new stimuli. B, Illustration of one game for one participant. Only the chosen stimulus is depicted for each of 10 consecutive trials, along with the outcome of each choice. C, Learning across games and participants, for games in the first 500 trials. Plotted is the percentage of choices of the stimulus that contained the target feature, throughout the games. Dashed line, chance performance; shaded area, SEM across participants. Learning in the 300 trials during functional imaging was similar, but the learning curve is less interpretable as games were truncated when a performance criterion was reached (see Materials and Methods). Other measures of learning, such as the number of trials to criterion (mean = 17.00 for the 500 fast-paced trials; mean = 16.40 for the slower-paced 300 trials; p = 0.09, paired t test), also suggest that performance in the two phases of the task was comparable. D, Percentage of games in which the stimulus containing the target feature was chosen on 0–6 of the last 6 trials of each game, across participants and games in the first 500 fast-paced trials (black) and in the last 300 slower-paced trials (white). In ∼40% of the games, participants consistently chose the stimulus that contained the correct feature (6 of 6 trials correct), evidencing that they had learned the identity of the target feature. In the rest of the games, their performance correct was at chance (on average, only two trials containing the target stimulus, consistent with the participant “playing” on an incorrect dimension and only selecting the stimulus containing the target feature by chance, that is, one-third of the time).
Figure 2.
Figure 2.
Model fits. A, Average likelihood per trial (when predicting the participant's choice on trial t given the choices and outcomes from the beginning of the game and up to trial t − 1) for each of the six models. The model that explained the data best was the fRL+decay model. Error bars indicate the SEM. Dashed line, chance performance. B, Predictive accuracy (average likelihood per trial across games and participants) as a function of trial number within a game, for each of the models (colors are as in A; the hybrid model curve is almost completely obscured by that of the fRL model). By definition, all models start at chance. The fRL+decay model predicted participants' performance significantly better (p < 0.05) than each of the other models from the second trial of the game and onward (excluding the 24th trial when comparing with fRL and SH, and the last two trials when comparing with hybrid), predicting participants' choices with >80% accuracy by trial 25. C, These results hold even when considering only unlearned games, that is, games in which the participant chose the stimulus containing the target feature on fewer than 4 of the last 6 trials. Again, the predictions of the fRL+decay model were significantly better than those of the competing models from the second trial and onward (excluding the 24th trial when comparing with fRL and hybrid, and the 19th, 21st, and last two trials when comparing with hybrid). Moreover, the model predicted participants' behavior with >70% accuracy by trial 25, despite the fact that participants' performance was not different from chance with respect to choosing the stimulus containing the target feature (p > 0.05 for all but two trials throughout the game). The predictions of the Bayesian model, in contrast, were not statistically different from chance from trial 19 and onward, suggesting that this model did well in explaining participants' behavior largely due to the fact that both the model and participants learned the task. All data depicted are from the first 500 trials. Similar results were obtained when comparing models based on the 300 trials during the functional scan; however, the performance criterion applied in those games obscures the differences between learned and unlearned games, as seen in B and C, and thus those data are not depicted.
Figure 3.
Figure 3.
Neural correlates of prediction errors from the fRL+decay model. Activations were thresholded at a whole-brain FWE threshold of p < 0.05 (which corresponded to t > 6.4 and p < 1.5 × 10⁻⁶ at the single-voxel level) and a minimum cluster size of 10 voxels. A, Activations in bilateral ventral striatum (left: peak MNI coordinates, [−15, 5, −11]; peak intensity, t = 10.01; cluster size, 57 voxels; right: peak MNI coordinates [12, 8, −8]; peak intensity, t = 8.37; cluster size, 47 voxels). B, Activation in dorsal putamen (peak MNI coordinates, [21, −7, 10]; peak intensity, t = 8.55; cluster size, 45 voxels). No other areas survived this threshold. Overlay: average structural scan of the 22 participants.
Figure 4.
Figure 4.
Neural substrates of representation learning. A, Sequence of choices and associated feature weights from the fRL+decay model. Weights for each of the nine task features (left) are depicted in the matrix under the chosen stimulus, with darker orange corresponding to a larger weight. Dots (filled for rewarded choices, empty for choices that led to 0 points) denote the three features chosen on the current trial; weights reflect estimates based on previous trials, before learning from the current trial, that is, the weights are the basis for the current choice, as per the model. B, Brain areas inversely correlated with the standard deviation of the weights of the chosen stimulus, at the time of stimulus onset. These areas are more active when weights are more uniform, as in trials 1, 2, and 8 above. Positive activations, thresholded at a p < 0.0001 (t > 4.49) voxelwise threshold and then subjected to a whole-brain FWE cluster-level threshold of p < 0.05, were significant in nine areas (Table 2). Shown here are bilateral IPS and precuneus (top), bilateral dlPFC (bottom), and bilateral occipital/cerebellar activations. Overlay: average structural scan of the 22 participants. Red dashed line, Slice coordinates. C, Neural model comparison. BOLD activity in six ROIs (identified using a model-agnostic GLM) supported the fRL+decay model when compared with the fRL, hybrid, and SH models, and was agnostic regarding the comparison between the fRL+decay model and the Bayesian model (the naïve RL model was not tested as it did not predict attentional control). Bars denote the log likelihood of each model minus that of the fRL+decay model, averaged across participants. Negative values represent higher log likelihood for the fRL+decay model. Error bars denote SEM. **p < 0.01, *p < 0.05, one-tailed paired Student's t test.

Comment in

References

    1. Akaishi R, Umeda K, Nagase A, Sakai K. Autonomous mechanism of internal choice estimate underlies decision inertia. Neuron. 2014;81:195–206. doi: 10.1016/j.neuron.2013.10.018. - DOI - PubMed
    1. Ashby FG, Maddox WT. Human category learning. Annu Rev Psychol. 2005;56:149–178. doi: 10.1146/annurev.psych.56.091103.070217. - DOI - PubMed
    1. Baldauf D, Desimone R. Neural mechanisms of object-based attention. Science. 2014;344:424–427. doi: 10.1126/science.1247003. - DOI - PubMed
    1. Bar-Gad I, Havazelet-Heimer G, Goldberg JA, Ruppin E, Bergman H. Reinforcement-driven dimensionality reduction-a model for information processing in the basal ganglia. J Basic Clin Physiol Pharmacol. 2000;11:305–320. - PubMed
    1. Barto AG. Adaptive critic and the basal ganglia. In: Houk JC, Davis JL, Beiser DG, editors. Models of information processing in the basal ganglia. Cambridge, MA: MIT; 1995. pp. 215–232.

Publication types

LinkOut - more resources