Randomized Controlled Trial
. 2015 May 27;35(21):8201-13.
doi: 10.1523/JNEUROSCI.3075-14.2015.

Abnormal contrast responses in the extrastriate cortex of blindsight patients

Affiliations
Randomized Controlled Trial

Abnormal contrast responses in the extrastriate cortex of blindsight patients

Sara Ajina et al. J Neurosci. .

Abstract

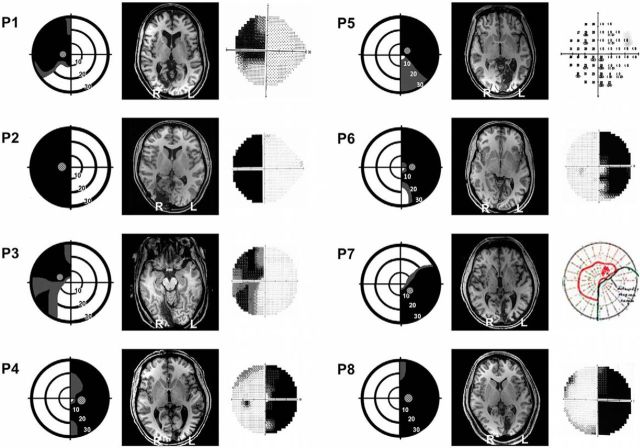
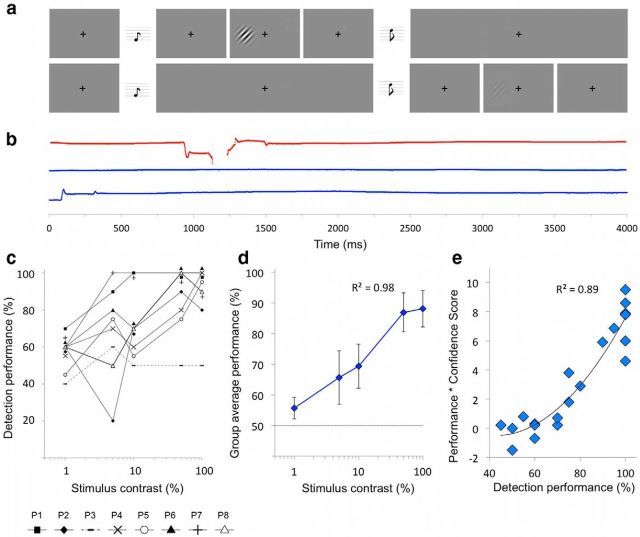
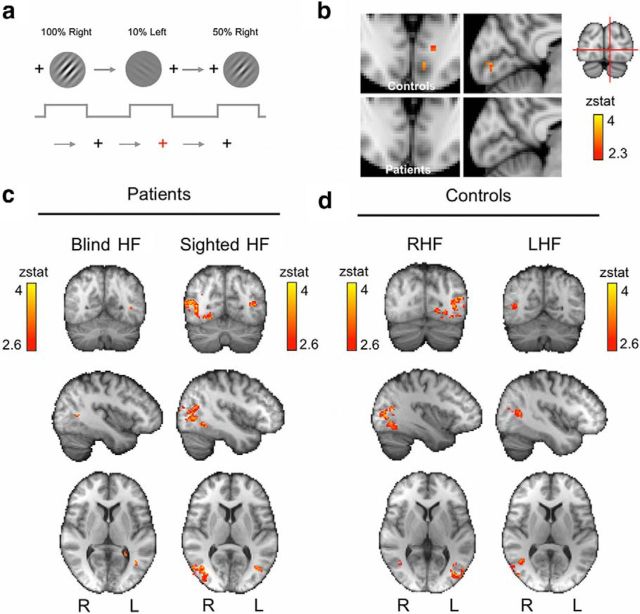
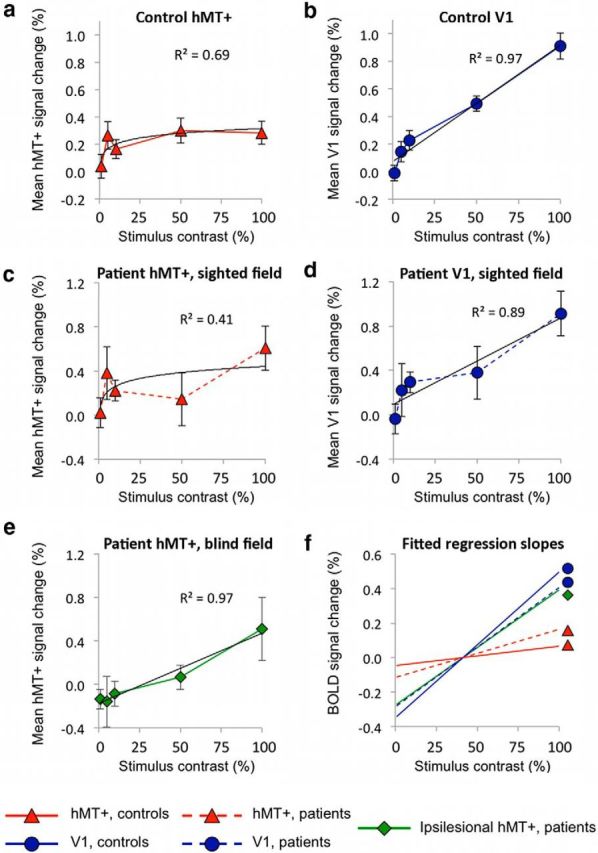
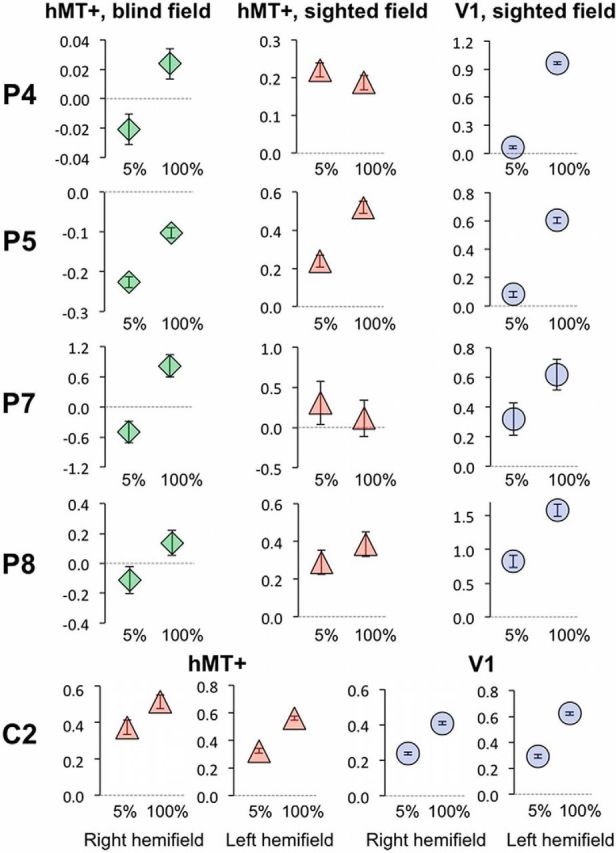
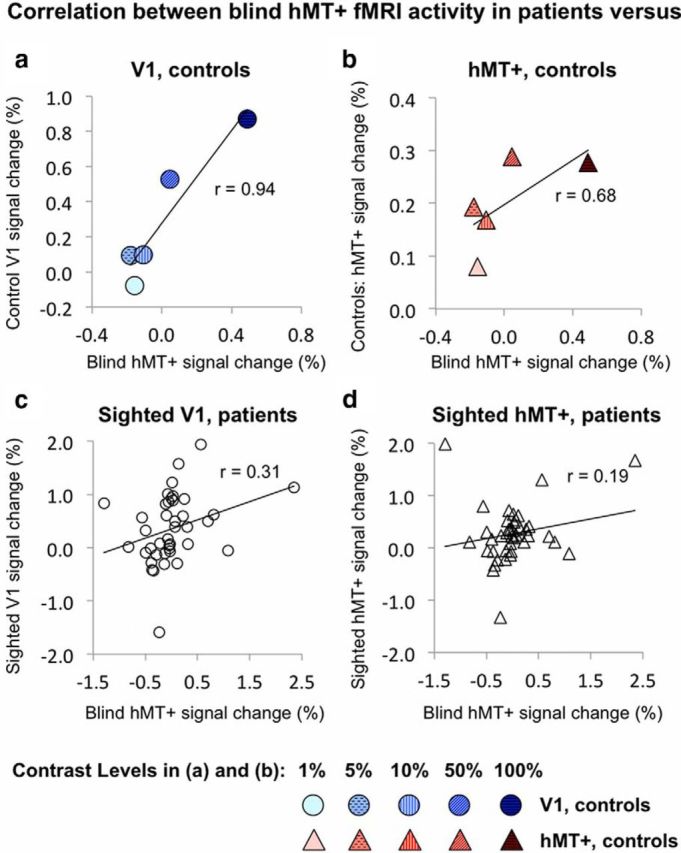
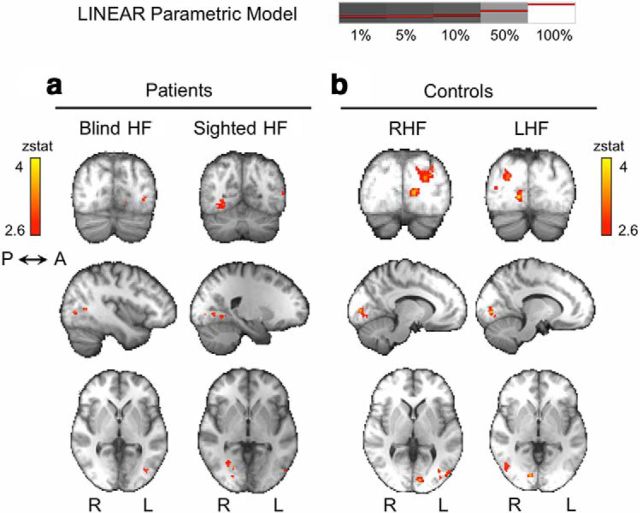
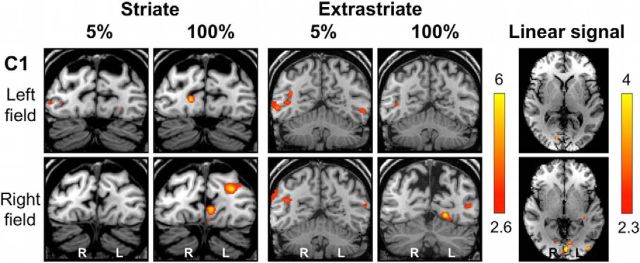
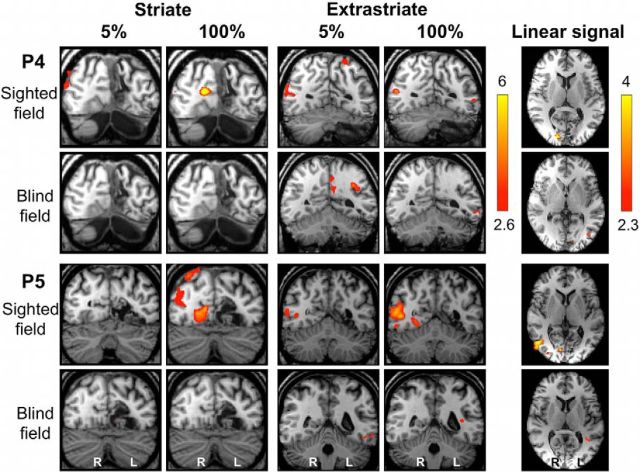
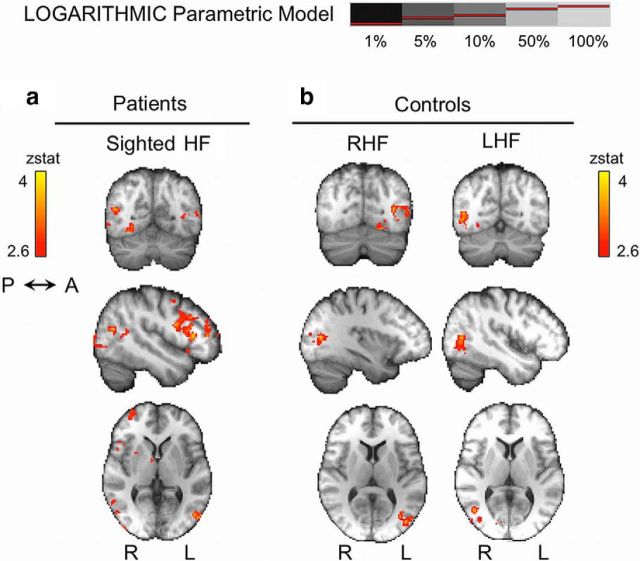
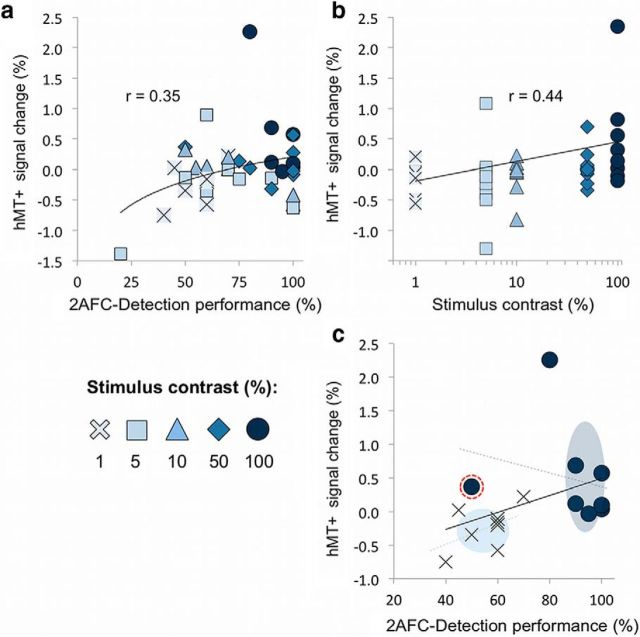
When the human primary visual cortex (V1) is damaged, the dominant geniculo-striate pathway can no longer convey visual information to the occipital cortex. However, many patients with such damage retain some residual visual function that must rely on an alternative pathway directly to extrastriate occipital regions. This residual vision is most robust for moving stimuli, suggesting a role for motion area hMT+. However, residual vision also requires high-contrast stimuli, which is inconsistent with hMT+ sensitivity to contrast in which even low-contrast levels elicit near-maximal neural activation. We sought to investigate this discrepancy by measuring behavioral and neural responses to increasing contrast in patients with V1 damage. Eight patients underwent behavioral testing and functional magnetic resonance imaging to record contrast sensitivity in hMT+ of their damaged hemisphere, using Gabor stimuli with a spatial frequency of 1 cycle/°. The responses from hMT+ of the blind hemisphere were compared with hMT+ and V1 responses in the sighted hemisphere of patients and a group of age-matched controls. Unlike hMT+, neural responses in V1 tend to increase linearly with increasing contrast, likely reflecting a dominant parvocellular channel input. Across all patients, the responses in hMT+ of the blind hemisphere no longer showed early saturation but increased linearly with contrast. Given the spatiotemporal parameters used in this study and the known direct subcortical projections from the koniocellular layers of the lateral geniculate nucleus to hMT+, we propose that this altered contrast sensitivity in hMT+ could be consistent with input from the koniocellular pathway.

Keywords: V1; blindsight; contrast; fMRI; hMT+; hemianopia.


Figures

Figure 1.
Figure 1.
Visual field deficits and structural MRI scans for all patients. Perimetry reports are depicted schematically for each patient, with the location of the target Gabor stimulus superimposed. Dense visual field loss is shown in black (<0.5%) and partial loss in gray (<2%). Stimuli were always restricted to a region of dense visual field loss, a minimum of 3° from fixation. Concentric rings represent increments in retinal position of 10°, spanning the central 30°. Representative MPRAGE T1 structural axial slices demonstrating lesion location are also provided, with radiological convention. Humphrey perimetry maps (Goldmann for P7) are included on the right side. Note that, on the Goldmann map, the red line represents the area in which the patient could detect stimulus of parameters “i2e,” i.e., size i (0.1°), intensity 2e. For P5, this is a screenshot of the raw Humphrey thresholds at each retinal location.
Figure 2.
Figure 2.
Behavioral protocol and results for all patients. a, Schematic of the 2AFC detection procedure. Participants fixate on a central cross, with the onset of each 1500 ms interval alerted by a low (interval 1) or high (interval 2) pitch tone. The stimulus can appear in either interval, for a period of 500 ms. At the end of the trial, participants are instructed to decide which interval the stimulus appeared, with a subset of patients also asked to rate the confidence of this response. b, Throughout the experiment, fixation was recorded with eye tracking. Example data over three trials are displayed here, with the y-axis representing horizontal gaze position on the screen (amplitude bar for scale). Any trials containing eye movements >1° toward the stimulus were excluded from analysis (red top plot); blue plots (bottom) represent adequate fixation. c, Individual 2AFC detection performance for all individuals. The individual at chance (P3, dotted line) is clearly distinct from other patients. When patients demonstrate identical scores for the same contrast levels, overlapping data points are plotted immediately above and/or below for visualization purposes. d, Average group performance; error bars represent SEM. Detection exhibits a logarithmic relationship with contrast (R2 = 0.98). e, Individual confidence ratings were collected in four patients, plotted here against detection performance. The relationship is described by a nonlinear curve, with confidence increasing the most for higher performance scores (R2 = 0.89; MSE, 1.3).
Figure 3.
Figure 3.
fMRI procedure and activation results for high-contrast motion. a, Simple block design consists of a drifting Gabor presented to the “blind” portion of visual field or its equivalent location in the sighted hemifield during 20 s blocks. Stimulus contrast is altered at random for each block across five contrast levels, representing 10 conditions. A concurrent fixation task requires participants to press a button every time the fixation cross changes color to red. All participants scored >90%. b, V1 activation during 100% contrast motion in the right hemifield of controls and the blind right hemifield of patients. No V1 activity is seen in the patient group, whereas controls show a small cluster of activity corresponding to the stimulus. The small volume reflects the small stimulus size and variation in location between participants, which had been matched to patients (Fig. 1). c, Thresholded activation maps for 100% contrast stimulation comparing the blind (left column) and sighted (right column) hemifields of patients show significant hMT+ activity. d, Equivalent results in control participants. Mixed-effects analysis, p < 0.001 uncorrected for a priori ROIs; elsewhere, cluster corrected, p < 0.05; results are displayed in MNI space. RHF, Right hemifield; LHF, left hemifield.
Figure 4.
Figure 4.
Group plots of signal change versus stimulus contrast within V1 or hMT+ ROIs. a, Control group hMT+ shows an early saturation at low levels of contrast, described by a logarithmic response. b, Control V1 shows a much stronger linear component, with signal change continuing to increase with each rise in stimulus contrast. c, Sighted hMT+ response in patients shows high signal change at 5 and 100% contrast. d, Sighted V1 in the undamaged hemisphere of patients, similar to controls, shows a predominantly linear relationship with increasing contrast. e, Ipsilesional hMT+ in patients is best described by a linear relationship with contrast (MSE, 0.002). f, Normalized linear regression lines between 5 and 100% contrast capture the early plateau of activity in normal hMT+ responses. hMT+ in controls (red triangle) and the sighted hemifield of patients (dotted red, triangle) both show shallow increases in signal change representative of this early saturation in activity. Conversely, V1 of controls (blue circle) and the intact hemisphere of patients (dotted blue, circle) show a comparable, steeper gradient that is notably similar to the regression line for hMT+ during blind field stimulation in patients (green diamond).
Figure 5.
Figure 5.
Individual hMT+ and V1 signal change at 5 and 100% contrast. Representative data are shown here for four patients (P4, P5, P7, and P8) and one control (C2). Mean signal change is shown for hMT+ during blind hemifield (left column, green diamonds) or sighted hemifield (middle column, red triangles) stimulation. The right column (blue circles) depicts signal change in V1 of the intact hemisphere during sighted field stimulation. Error bars represent the voxelwise variance estimate across the ROI. Signal change axes are matched for peak and minimum values and always go through zero (dotted gray line).
Figure 6.
Figure 6.
Correlations between hMT+ activity in patients during blind field stimulation versus sighted responses in V1 and hMT+ of patients and controls. Average hMT+ signal change during blind hemifield stimulation in patients correlates well with contrast-related activity in V1 of control participants (a) but not with control hMT+ responses (b). Individual data points represent single contrast levels, depicted using a shaded gradient from 1% (pale) to 100% (dark). c, Blind hMT+ activity also correlates with V1 responses to the sighted hemifield in patients' intact hemisphere. This remains significant when the three most distant outliers are excluded from analysis (r = 0.35, p = 0.03). d, There is no significant correlation with contrast-related hMT+ responses to patients' sighted hemifield, which remains unchanged when the three most prominent outliers are excluded (r = 0.19, p = 0.26).
Figure 7.
Figure 7.
Cortical regions demonstrating a significant linear relationship with stimulus contrast. a, In patients, only contralateral hMT+ shows significant activity according to this model during blind hemifield stimulation. For the sighted hemifield (right column) and control participants (b), there is a significant linear relationship with contrast in contralateral V1, V4, and, to a lesser extent, hMT+. Mixed-effects analysis, p < 0.001 uncorrected for a priori ROIs; elsewhere, cluster corrected, p < 0.05. Results displayed on average high-resolution structural scans in MNI space. RHF, Right hemifield; LHF, left hemifield.
Figure 8.
Figure 8.
Individual fMRI responses during 5 and 100% contrast in a control participant (C1). Representative coronal slices demonstrating the striate (left column) and extrastriate (middle column) cortices during stimulation of the left (top row) or right (bottom row) hemifield. The far right column depicts activity corresponding significantly to a linear relationship with increasing contrast. Activation is superimposed on representative axial slices, centered on the peak voxel. Mixed-effects analyses, p < 0.001 uncorrected for a priori ROIs; elsewhere, cluster corrected, p < 0.05. Results displayed on T1-weighted structural images.
Figure 9.
Figure 9.
Individual fMRI responses during 5 and 100% contrast in patients P4 and P5. Representative coronal slices demonstrating the striate (left column) and extrastriate cortex (middle column) in two patients (P4 and P5). Both patients have sustained V1 damage to the left hemisphere. The top row in each case demonstrates stimulation of the sighted field, and blind field responses are shown below. The far right column depicts activity corresponding significantly to a linear relationship with increasing contrast. Activation is superimposed on representative axial slices, centered on the peak voxel. Mixed-effects analyses, p < 0.001 uncorrected for a priori ROIs; elsewhere, cluster corrected, p < 0.05. Results displayed on T1-weighted structural images.
Figure 10.
Figure 10.
Cortical regions demonstrating a significant logarithmic relationship with stimulus contrast. a, In patients, no regions respond logarithmically to contrast in the blind hemifield. In the sighted hemifield and in controls (b), there is a significant logarithmic relationship with contrast in hMT+ and V4 (for details, see Table 2). Mixed-effects analysis, p < 0.001 uncorrected for a priori ROIs; elsewhere, cluster corrected, p < 0.05. Results displayed on average high-resolution structural scans in MNI space. RHF, Right hemifield; LHF, left hemifield.
Figure 11.
Figure 11.
The relative influence of contrast and detection performance on hMT+ activity in patients. a, hMT+ shows a significant logarithmic relationship with blindsight performance across all patients, with the contribution of stimulus contrast appreciated using a color scale and distinct symbols. b, As shown previously, hMT+ shows a linear relationship with stimulus contrast. c, Results for only 1 and 100% contrast from a are replotted here. The overall trend line is shown (black line, r = 0.4), as well as individual trend lines for both contrast levels (dotted colored lines). Similar analyses were also performed for 5, 10, and 50% contrast (data not shown). There is clear clustering according to contrast in both the x (performance) and y (signal change) planes, illustrated by colored ellipses representing the mean and SD at each contrast level. The data point highlighted inside the dotted red circle indicates a different contrast–fMRI–performance relationship, which corresponds to results for the blindsight-negative patient (P3).

References

    1. Albrecht DG, Hamilton DB. Striate cortex of monkey and cat: contrast response function. J Neurophysiol. 1982;48:217–237. - PubMed
    1. Amunts K, Malikovic A, Mohlberg H, Schormann T, Zilles K. Brodmann's areas 17 and 18 brought into stereotaxic space-where and how variable? Neuroimage. 2000;11:66–84. doi: 10.1006/nimg.1999.0516. - DOI - PubMed
    1. Andersson JLR, Jenkinson M, Smith SM. Functional MRI of the Brain technical report. Oxford, UK: TR07JA1; 2007. Non-linear optimisation.
    1. Barbur JL, Ruddock KH, Waterfield VA. Human visual responses in the absence of the geniculo-calcarine projection. Brain. 1980;103:905–928. doi: 10.1093/brain/103.4.905. - DOI - PubMed
    1. Bola M, Gall C, Sabel BA. The second face of blindness: processing speed deficits in the intact visual field after pre- and post-chiasmatic lesions. PLoS One. 2013;8:e63700. doi: 10.1371/journal.pone.0063700. - DOI - PMC - PubMed

Publication types

LinkOut - more resources