

Denosumab improves bone mineral density and microarchitecture and reduces bone pain in women with osteoporosis with and without glucocorticoid treatment
- PMID: 26019600
- PMCID: PMC4434053
- DOI: 10.1080/13102818.2014.967827
Denosumab improves bone mineral density and microarchitecture and reduces bone pain in women with osteoporosis with and without glucocorticoid treatment
Abstract
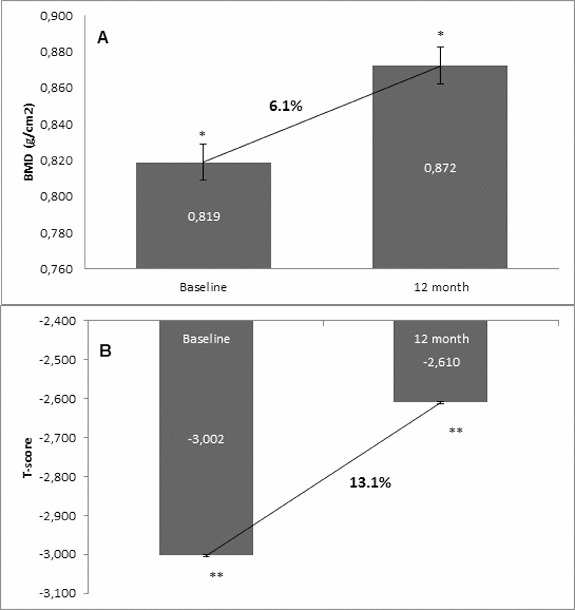
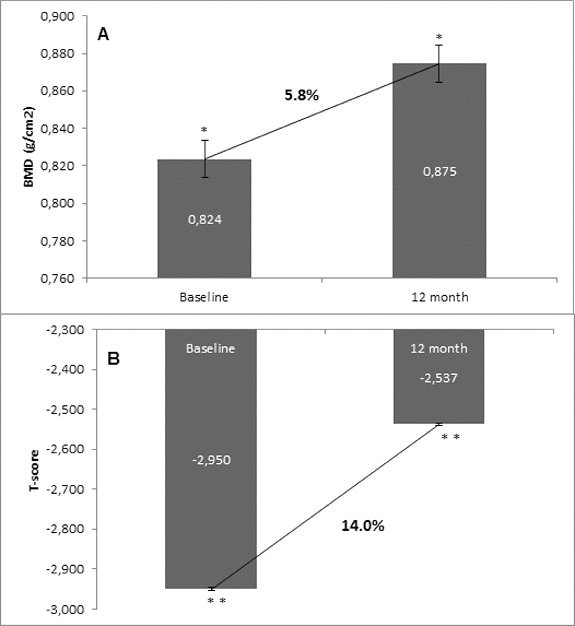
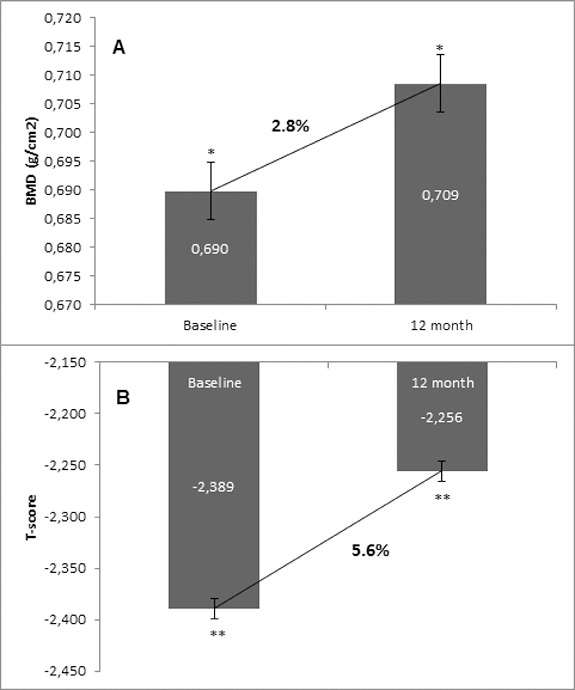
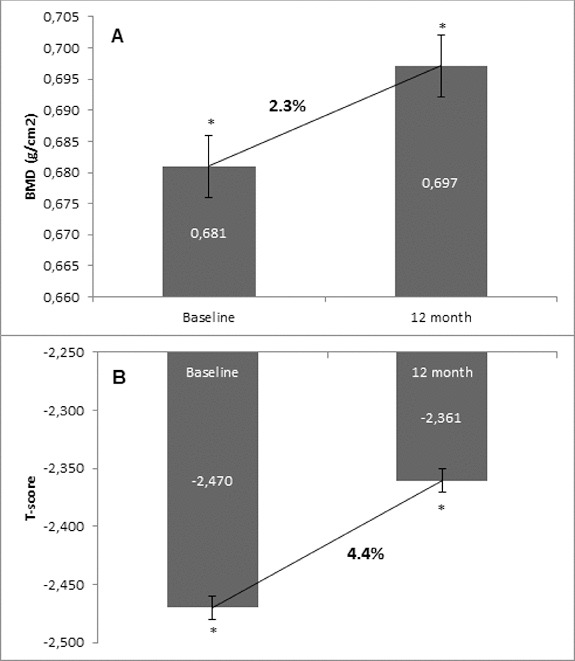
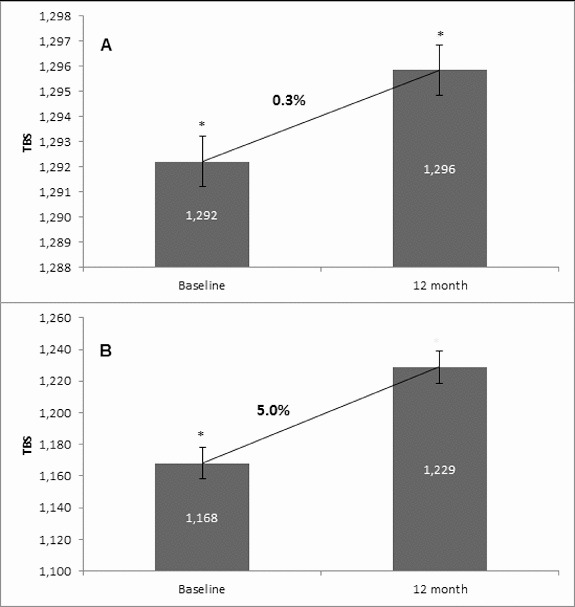
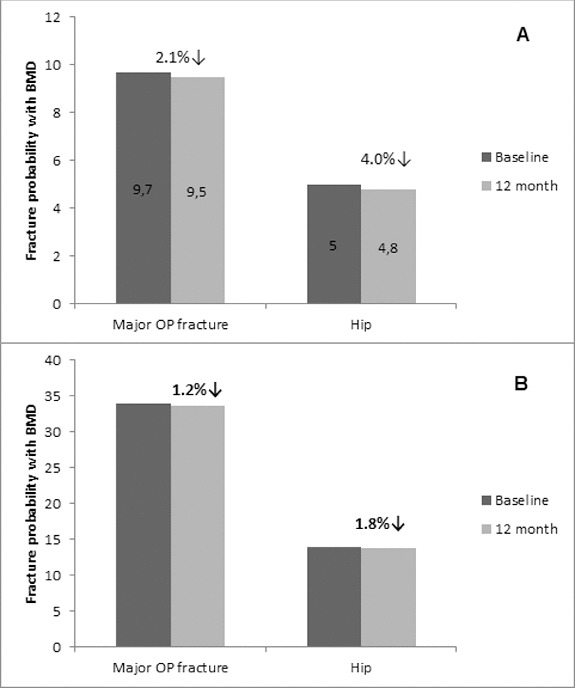
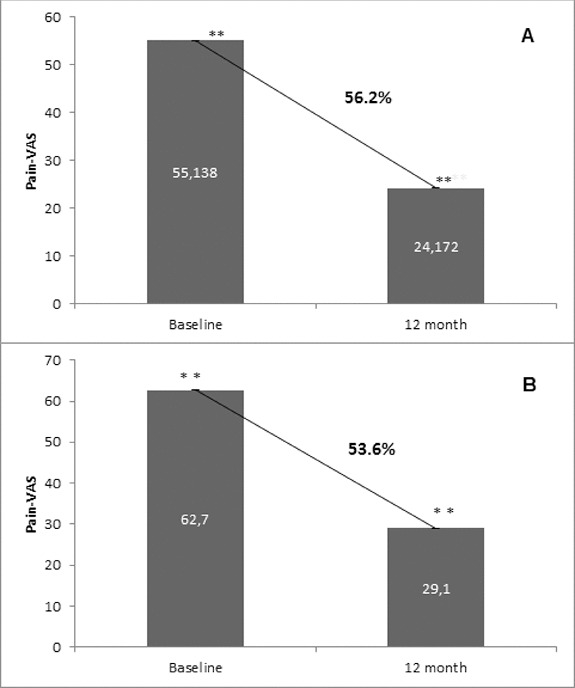
Osteoporosis is a key health problem in postmenopausal women with high social and economic impact. Decreased bone mineral density (BMD) and deterioration of bone microarchitecture may occur also as a result of long-term glucocorticoid treatment (GCT) of autoimmune or inflammatory conditions. Denosumab specifically inhibits the binding of the receptor activator of nuclear factor-κB to its ligand, thus preventing osteoclast activation and bone resorption. The efficacy and safety of denosumab, administered subcutaneously as 60 mg, once every six months for 12 months, were evaluated in 60 patients with postmenopausal osteoporosis (PMO) divided into two groups. The GCT group included 30 patients receiving concomitant glucocorticoid therapy and the non-GCT group included 30 patients that did not receive GCT. In the non-GCT group, the 12-month treatment with denosumab resulted in BMD increase of 6.1% and 2.8% in lumbar spine and hip, respectively. T-score increased by 13.1% and 5.6% in both, the lumbar spine and hip. A slight rise in the Trabecular Bone Score (TBS) of 0.3% was observed. Bone pain was markedly reduced by 56.2%. In the GCT group, denosumab therapy increased BMD with 5.8% and 2.3% in lumbar spine and hip, respectively. T-score of lumbar spine and hip significantly increased by 14.0% and 4.4%, and the TBS rose by 5%. Bone pain was reduced by 53.6%. These data confirm the available knowledge on denosumab efficacy and safety in women with PMO and also provide new insights into its therapeutic potential in patients with osteoporosis related to a long-term corticosteroid treatment.
Keywords: BMD; TBS; bone pain; denosumab; glucocorticoid treatment; postmenopausal osteoporosis.
Figures
Similar articles
-
Effect of denosumab on trabecular bone score in postmenopausal women with osteoporosis.Osteoporos Int. 2017 Oct;28(10):2967-2973. doi: 10.1007/s00198-017-4140-y. Epub 2017 Jul 26. Osteoporos Int. 2017. PMID: 28748386 Clinical Trial.
-
Denosumab Versus Risedronate in Glucocorticoid-Induced Osteoporosis: Final Results of a Twenty-Four-Month Randomized, Double-Blind, Double-Dummy Trial.Arthritis Rheumatol. 2019 Jul;71(7):1174-1184. doi: 10.1002/art.40874. Epub 2019 May 25. Arthritis Rheumatol. 2019. PMID: 30816640 Free PMC article. Clinical Trial.
-
Denosumab in postmenopausal women with low bone mineral density.N Engl J Med. 2006 Feb 23;354(8):821-31. doi: 10.1056/NEJMoa044459. N Engl J Med. 2006. PMID: 16495394 Clinical Trial.
-
Update on denosumab treatment in postmenopausal women with osteoporosis.Endocrinol Metab (Seoul). 2015 Mar 27;30(1):19-26. doi: 10.3803/EnM.2015.30.1.19. Endocrinol Metab (Seoul). 2015. PMID: 25827453 Free PMC article. Review.
-
Denosumab for treatment of postmenopausal osteoporosis.Am J Health Syst Pharm. 2011 Aug 1;68(15):1409-18. doi: 10.2146/ajhp100493. Am J Health Syst Pharm. 2011. PMID: 21785030 Review.
Cited by
-
Medication-taking behaviour in Bulgarian women with postmenopausal osteoporosis treated with denosumab or monthly oral bisphosphonates.Arch Osteoporos. 2017 Dec 21;13(1):1. doi: 10.1007/s11657-017-0413-5. Arch Osteoporos. 2017. PMID: 29264666 Free PMC article.
-
Trabecular Bone Score Reflects Trabecular Microarchitecture Deterioration and Fragility Fracture in Female Adult Patients Receiving Glucocorticoid Therapy: A Pre-Post Controlled Study.Biomed Res Int. 2017;2017:4210217. doi: 10.1155/2017/4210217. Epub 2017 Jan 3. Biomed Res Int. 2017. PMID: 28127556 Free PMC article.
-
Glucocorticoid-induced osteoporosis: pathophysiological role of GH/IGF-I and PTH/VITAMIN D axes, treatment options and guidelines.Endocrine. 2016 Dec;54(3):603-611. doi: 10.1007/s12020-016-1146-8. Epub 2016 Oct 20. Endocrine. 2016. PMID: 27766553
-
Effects of Denosumab on Bone Metabolic Markers and Bone Mineral Density in Patients Treated with Glucocorticoids.Intern Med. 2017;56(6):631-636. doi: 10.2169/internalmedicine.56.7797. Epub 2017 Mar 17. Intern Med. 2017. PMID: 28321061 Free PMC article.
-
Denosumab in the treatment of glucocorticoid-induced osteoporosis.Rheumatol Int. 2018 Nov;38(11):1975-1984. doi: 10.1007/s00296-018-4106-1. Epub 2018 Jul 17. Rheumatol Int. 2018. PMID: 30019224 Review.
References
-
- Dempster DW. Osteoporosis and the burden of osteoporosis-related fractures. Am J Manag Care. 2011;17:S164–S169. - PubMed
-
- Lacey DL. Timms E. Tan HL. Kelley MJ. Dunstan CR. Burgess T. Elliott R. Colombero A. Elliott G. Scully S. Hsu H. Sullivan J. Hawkins N. Davy E. Capparelli C. Eli A. Qian YX. Kaufman S. Sarosi I. Shalhoub V. Senaldi G. Guo J. Delaney J. Boyle WJ. Osteoprotegerin ligand is a cytokine that regulates osteoclast differentiation and activation. Cell. 1998;93:165–176. - PubMed
-
- Delmas PD. Clinical potential of RANKL inhibition for the management of postmenopausal osteoporosis and other metabolic bone diseases. J Clin Densitom. 2008;11:325–338. - PubMed
-
- Simonet WS. Lacey DL. Dunstan CR. Kelley M. Chang MS. Luthy R. Nguyen HQ. Wooden S. Bennett L. Boone T. Shimamoto G. DeRose M. Elliott R. Colombero A. Tan HL. Trail G. Sullivan J. Davy E. Bucay N. Renshaw-Gegg L. Hughes TM. Hill D. Pattison W. Campbell P. Sander S. Van G. Tarpley J. Derby P. Lee R. Boyle WJ. Osteoprotegerin: a novel secreted protein involved in the regulation of bone density. Cell. 1997;89:309–319. - PubMed
LinkOut - more resources
Full Text Sources
Other Literature Sources