Windscapes shape seabird instantaneous energy costs but adult behavior buffers impact on offspring
- PMID: 26019870
- PMCID: PMC4445632
- DOI: 10.1186/s40462-014-0017-2
Windscapes shape seabird instantaneous energy costs but adult behavior buffers impact on offspring
Abstract
Background: Windscapes affect energy costs for flying animals, but animals can adjust their behavior to accommodate wind-induced energy costs. Theory predicts that flying animals should decrease air speed to compensate for increased tailwind speed and increase air speed to compensate for increased crosswind speed. In addition, animals are expected to vary their foraging effort in time and space to maximize energy efficiency across variable windscapes.
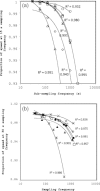
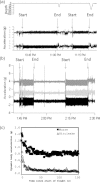
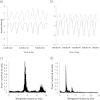
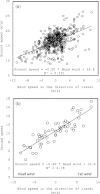
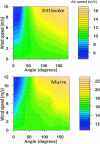
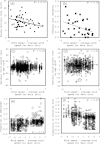
Results: We examined the influence of wind on seabird (thick-billed murre Uria lomvia and black-legged kittiwake Rissa tridactyla) foraging behavior. Airspeed and mechanical flight costs (dynamic body acceleration and wing beat frequency) increased with headwind speed during commuting flights. As predicted, birds adjusted their airspeed to compensate for crosswinds and to reduce the effect of a headwind, but they could not completely compensate for the latter. As we were able to account for the effect of sampling frequency and wind speed, we accurately estimated commuting flight speed with no wind as 16.6 ms(?1) (murres) and 10.6 ms(?1) (kittiwakes). High winds decreased delivery rates of schooling fish (murres), energy (murres) and food (kittiwakes) but did not impact daily energy expenditure or chick growth rates. During high winds, murres switched from feeding their offspring with schooling fish, which required substantial above-water searching, to amphipods, which required less above-water searching.
Conclusions: Adults buffered the adverse effect of high winds on chick growth rates by switching to other food sources during windy days or increasing food delivery rates when weather improved.
Figures

Similar articles
-
A comparison of techniques for classifying behavior from accelerometers for two species of seabird.Ecol Evol. 2019 Feb 21;9(6):3030-3045. doi: 10.1002/ece3.4740. eCollection 2019 Mar. Ecol Evol. 2019. PMID: 30962879 Free PMC article.
-
Wandering albatrosses exert high take-off effort only when both wind and waves are gentle.Elife. 2023 Oct 10;12:RP87016. doi: 10.7554/eLife.87016. Elife. 2023. PMID: 37814539 Free PMC article.
-
Flight speed and performance of the wandering albatross with respect to wind.Mov Ecol. 2018 Mar 7;6:3. doi: 10.1186/s40462-018-0121-9. eCollection 2018. Mov Ecol. 2018. PMID: 29556395 Free PMC article.
-
Windscape and tortuosity shape the flight costs of northern gannets.J Exp Biol. 2014 Mar 15;217(Pt 6):876-85. doi: 10.1242/jeb.097915. J Exp Biol. 2014. PMID: 24622894
-
The energy economy of the arctic-breeding Kittiwake (Rissa tridactyla): a review.Comp Biochem Physiol A Mol Integr Physiol. 2002 Nov;133(3):765-70. doi: 10.1016/s1095-6433(02)00153-8. Comp Biochem Physiol A Mol Integr Physiol. 2002. PMID: 12443932 Review.
Cited by
-
Flap or soar? How a flight generalist responds to its aerial environment.Philos Trans R Soc Lond B Biol Sci. 2016 Sep 26;371(1704):20150395. doi: 10.1098/rstb.2015.0395. Philos Trans R Soc Lond B Biol Sci. 2016. PMID: 27528785 Free PMC article.
-
The role of wingbeat frequency and amplitude in flight power.J R Soc Interface. 2022 Aug;19(193):20220168. doi: 10.1098/rsif.2022.0168. Epub 2022 Aug 24. J R Soc Interface. 2022. PMID: 36000229 Free PMC article. Review.
-
A comparison of techniques for classifying behavior from accelerometers for two species of seabird.Ecol Evol. 2019 Feb 21;9(6):3030-3045. doi: 10.1002/ece3.4740. eCollection 2019 Mar. Ecol Evol. 2019. PMID: 30962879 Free PMC article.
-
Behavioural flexibility in an Arctic seabird using two distinct marine habitats to survive the energetic constraints of winter.Mov Ecol. 2022 Nov 3;10(1):45. doi: 10.1186/s40462-022-00344-3. Mov Ecol. 2022. PMID: 36329536 Free PMC article.
-
Movement, resting, and attack behaviors of wild pumas are revealed by tri-axial accelerometer measurements.Mov Ecol. 2015 Jan 22;3(1):2. doi: 10.1186/s40462-015-0030-0. eCollection 2015. Mov Ecol. 2015. PMID: 25709837 Free PMC article.
References
-
- Fancy SG, White RG. Energy expenditures for locomotion by barren-ground caribou. Can J Zool. 1987;65:122–128. doi: 10.1139/z87-018. - DOI
-
- Lejeune TM, Willems PA, Heglund NC. Mechanics and energetics of human locomotion on sand. J Exp Biol. 1998;201:2071–2080. - PubMed
-
- Vasquez RA, Ebensperger LA, Bozinovic F. The influence of habitat on travel speed, intermittent locomotion, and vigilance in a diurnal rodent. Behav Ecol. 2002;13:182–187. doi: 10.1093/beheco/13.2.182. - DOI
LinkOut - more resources
Full Text Sources
Other Literature Sources
Research Materials

