

Three-dimensional Dynamic Contrast-enhanced US Imaging for Early Antiangiogenic Treatment Assessment in a Mouse Colon Cancer Model
- PMID: 26020439
- PMCID: PMC4627439
- DOI: 10.1148/radiol.2015142824
Three-dimensional Dynamic Contrast-enhanced US Imaging for Early Antiangiogenic Treatment Assessment in a Mouse Colon Cancer Model
Abstract
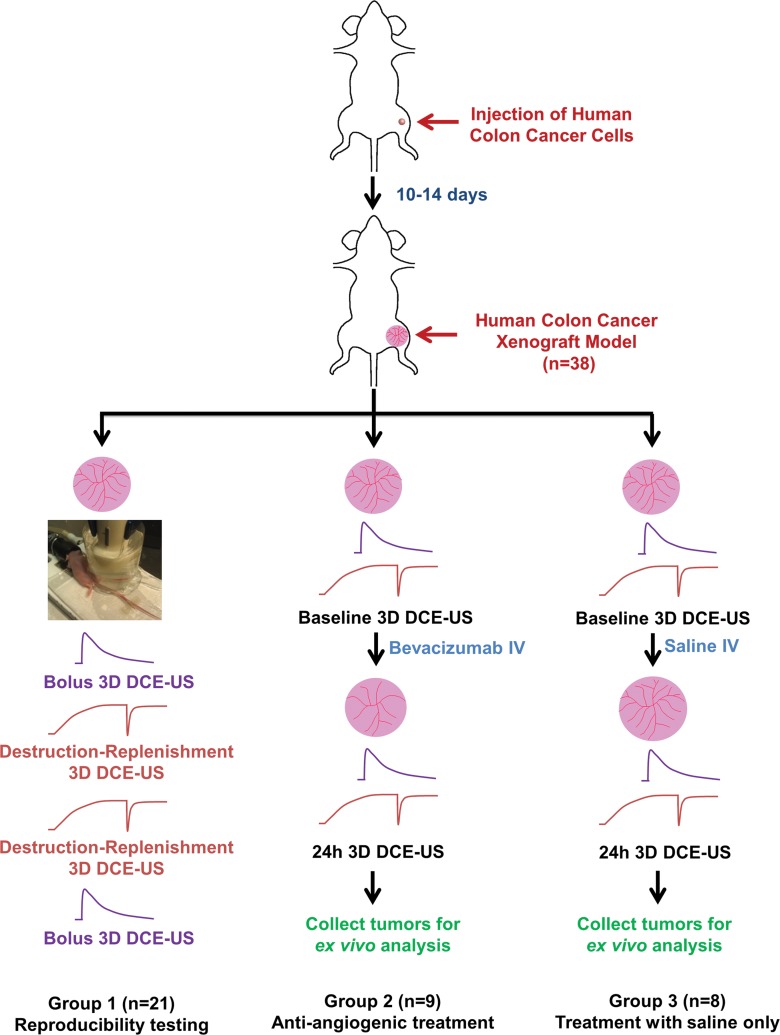
Purpose: To evaluate feasibility and reproducibility of three-dimensional (3D) dynamic contrast material-enhanced (DCE) ultrasonographic (US) imaging by using a clinical matrix array transducer to assess early antiangiogenic treatment effects in human colon cancer xenografts in mice.
Materials and methods: Animal studies were approved by the Institutional Administrative Panel on Laboratory Animal Care at Stanford University. Three-dimensional DCE US imaging with two techniques (bolus and destruction-replenishment) was performed in human colon cancer xenografts (n = 38) by using a clinical US system and transducer. Twenty-one mice were imaged twice to assess reproducibility. Seventeen mice were scanned before and 24 hours after either antiangiogenic (n = 9) or saline-only (n = 8) treatment. Data sets of 3D DCE US examinations were retrospectively segmented into consecutive 1-mm imaging planes to simulate two-dimensional (2D) DCE US imaging. Six perfusion parameters (peak enhancement [PE], area under the time-intensity curve [AUC], time to peak [TTP], relative blood volume [rBV], relative blood flow [rBF], and blood flow velocity) were measured on both 3D and 2D data sets. Percent area of blood vessels was quantified ex vivo with immunofluorescence. Statistical analyses were performed with the Wilcoxon rank test by calculating intraclass correlation coefficients and by using Pearson correlation analysis.
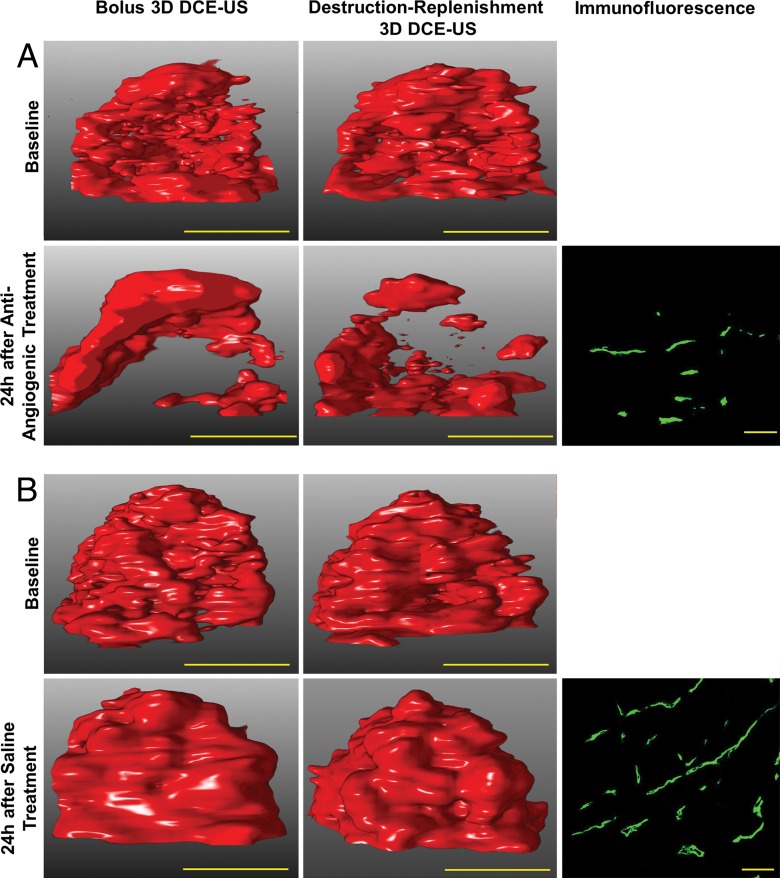
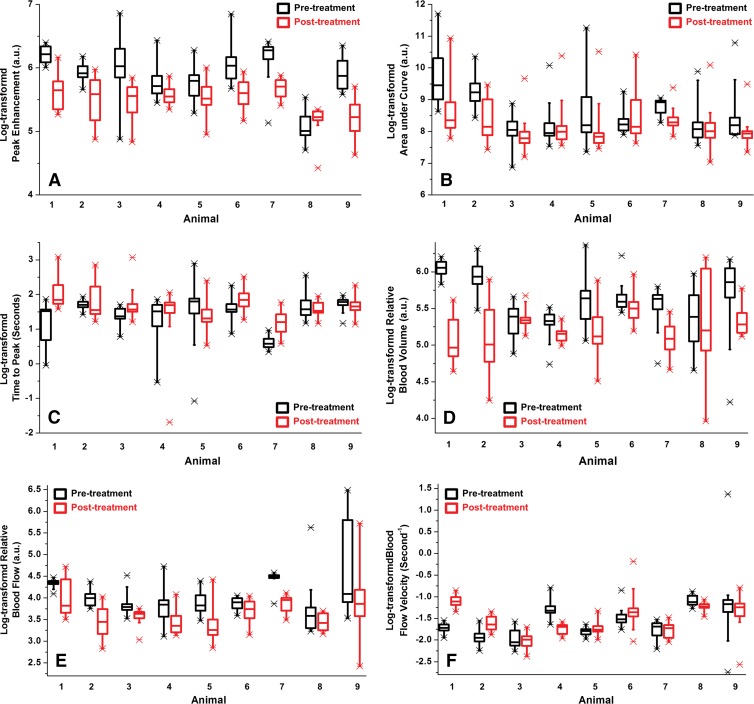
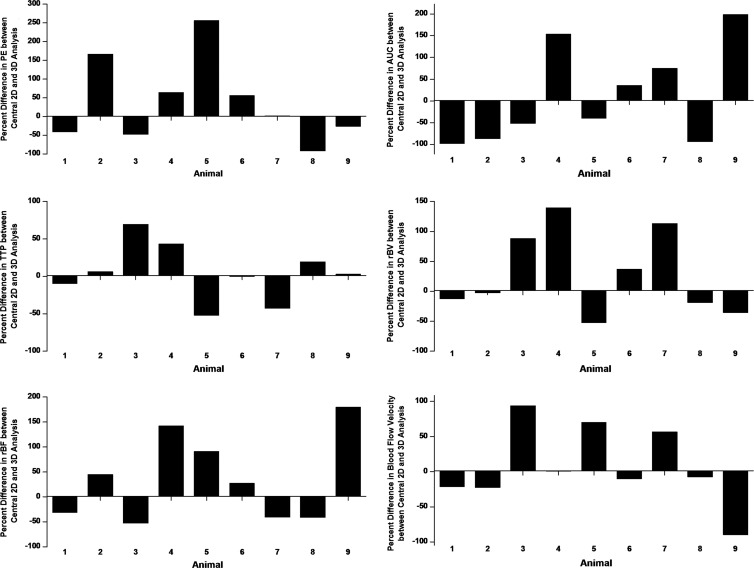
Results: Reproducibility of both 3D DCE US imaging techniques was good to excellent (intraclass correlation coefficient, 0.73-0.86). PE, AUC, rBV, and rBF significantly decreased (P ≤ .04) in antiangiogenic versus saline-treated tumors. rBV (r = 0.74; P = .06) and rBF (r = 0.85; P = .02) correlated with ex vivo percent area of blood vessels, although the statistical significance of rBV was not reached, likely because of small sample size. Overall, 2D DCE-US overestimated and underestimated treatment effects from up to 125-fold to170-fold compared with 3D DCE US imaging. If the central tumor plane was assessed, treatment response was underestimated up to threefold or overestimated up to 57-fold on 2D versus 3D DCE US images.
Conclusion: Three-dimensional DCE US imaging with a clinical matrix array transducer is feasible and reproducible to assess tumor perfusion in human colon cancer xenografts in mice and allows for assessment of early treatment response after antiangiogenic therapy.
© RSNA, 2015
Figures
Similar articles
-
Intra-Animal Comparison between Three-dimensional Molecularly Targeted US and Three-dimensional Dynamic Contrast-enhanced US for Early Antiangiogenic Treatment Assessment in Colon Cancer.Radiology. 2017 Feb;282(2):443-452. doi: 10.1148/radiol.2016160032. Epub 2016 Aug 4. Radiology. 2017. PMID: 27490690 Free PMC article.
-
Dynamic contrast-enhanced micro-computed tomography correlates with 3-dimensional fluorescence ultramicroscopy in antiangiogenic therapy of breast cancer xenografts.Invest Radiol. 2014 Jul;49(7):445-56. doi: 10.1097/RLI.0000000000000038. Invest Radiol. 2014. PMID: 24598441
-
Three-dimensional ultrasound molecular imaging of angiogenesis in colon cancer using a clinical matrix array ultrasound transducer.Invest Radiol. 2015 May;50(5):322-9. doi: 10.1097/RLI.0000000000000128. Invest Radiol. 2015. PMID: 25575176 Free PMC article.
-
Dynamic contrast-enhanced ultrasonography (DCE-US) with quantification of tumor perfusion: a new diagnostic tool to evaluate the early effects of antiangiogenic treatment.Eur Radiol. 2007 Dec;17 Suppl 6:F89-98. doi: 10.1007/s10406-007-0233-6. Eur Radiol. 2007. PMID: 18376462 Review.
-
Science to Practice: Multiparametric Molecular and Functional US Imaging Goes Three-dimensional.Radiology. 2017 Feb;282(2):307-309. doi: 10.1148/radiol.2016161455. Radiology. 2017. PMID: 28099112 Review.
Cited by
-
Quantitative Three-Dimensional Dynamic Contrast-Enhanced Ultrasound Imaging: First-In-Human Pilot Study in Patients with Liver Metastases.Theranostics. 2017 Aug 23;7(15):3745-3758. doi: 10.7150/thno.20329. eCollection 2017. Theranostics. 2017. PMID: 29109773 Free PMC article.
-
Therapeutic response monitoring after targeted therapy in an orthotopic rat model of hepatocellular carcinoma using contrast-enhanced ultrasound: Focusing on inter-scanner, and inter-operator reproducibility.PLoS One. 2020 Dec 23;15(12):e0244304. doi: 10.1371/journal.pone.0244304. eCollection 2020. PLoS One. 2020. PMID: 33362203 Free PMC article.
-
Motion correction of 3D dynamic contrast-enhanced ultrasound imaging without anatomical B-Mode images: Pilot evaluation in eight patients.Med Phys. 2024 Jul;51(7):4827-4837. doi: 10.1002/mp.16995. Epub 2024 Feb 20. Med Phys. 2024. PMID: 38377383 Free PMC article.
-
Assessment of angiogenesis in rabbit orthotropic liver tumors using three-dimensional dynamic contrast-enhanced ultrasound compared with two-dimensional DCE-US.Jpn J Radiol. 2019 Oct;37(10):701-709. doi: 10.1007/s11604-019-00861-z. Epub 2019 Aug 10. Jpn J Radiol. 2019. PMID: 31401722
-
In vitro characterization and in vivo ultrasound molecular imaging of nucleolin-targeted microbubbles.Biomaterials. 2017 Feb;118:63-73. doi: 10.1016/j.biomaterials.2016.11.026. Epub 2016 Nov 21. Biomaterials. 2017. PMID: 27940383 Free PMC article.
References
-
- Siegel R, Ma J, Zou Z, Jemal A. Cancer statistics, 2014. CA Cancer J Clin 2014;64(1):9–29. - PubMed
-
- American Cancer Society . Cancer Facts & Figures 2014. Atlanta, Ga: American Cancer Society, 2014.
-
- Lee JJ, Chu E. Sequencing of antiangiogenic agents in the treatment of metastatic colorectal cancer. Clin Colorectal Cancer 2014;13(3):135–144. - PubMed
-
- Alberts SR, Horvath WL, Sternfeld WC, et al. . Oxaliplatin, fluorouracil, and leucovorin for patients with unresectable liver-only metastases from colorectal cancer: a North Central Cancer Treatment Group phase II study. J Clin Oncol 2005;23(36):9243–9249. - PubMed
-
- Van Cutsem E, Köhne CH, Hitre E, et al. . Cetuximab and chemotherapy as initial treatment for metastatic colorectal cancer. N Engl J Med 2009;360(14):1408–1417. - PubMed
Publication types
MeSH terms
Substances
Grants and funding
LinkOut - more resources
Full Text Sources
Other Literature Sources
