. 2015 May 28:5:10469.
doi: 10.1038/srep10469.

Characterization of the Escherichia coli σ(S) core regulon by Chromatin Immunoprecipitation-sequencing (ChIP-seq) analysis

Affiliations

Characterization of the Escherichia coli σ(S) core regulon by Chromatin Immunoprecipitation-sequencing (ChIP-seq) analysis

Clelia Peano et al. Sci Rep. .

Abstract

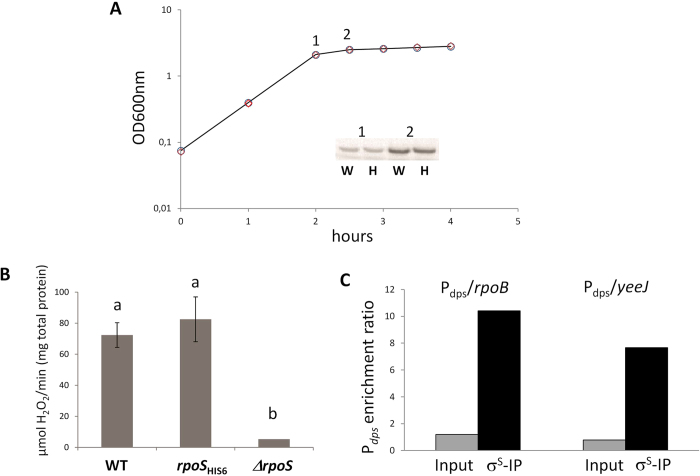
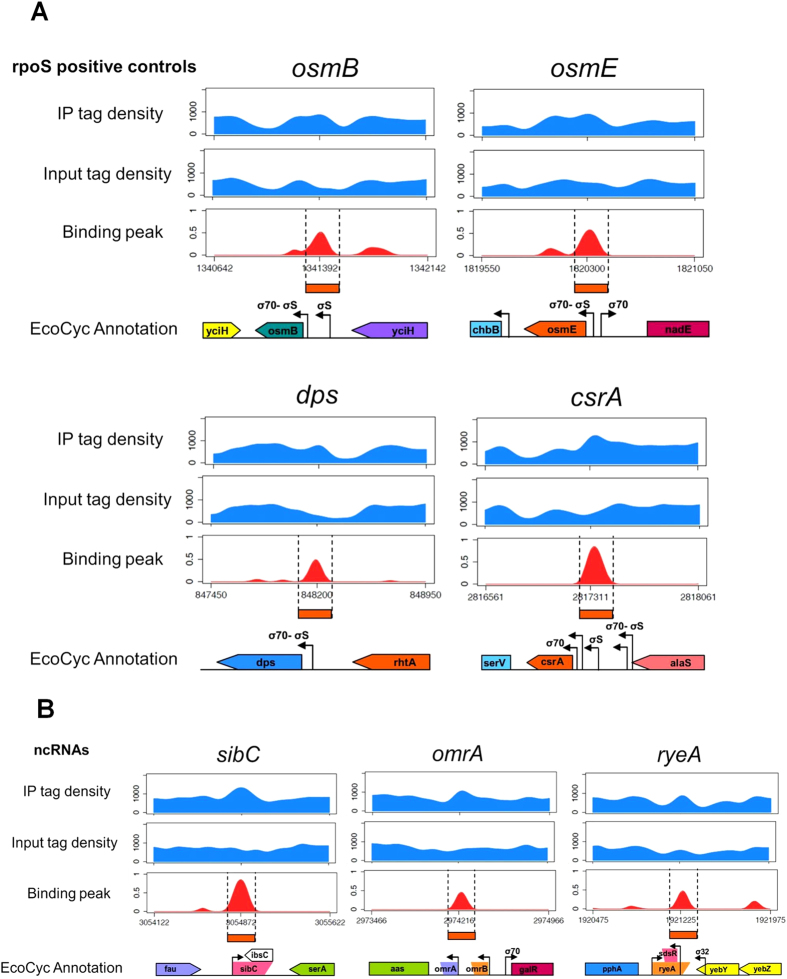
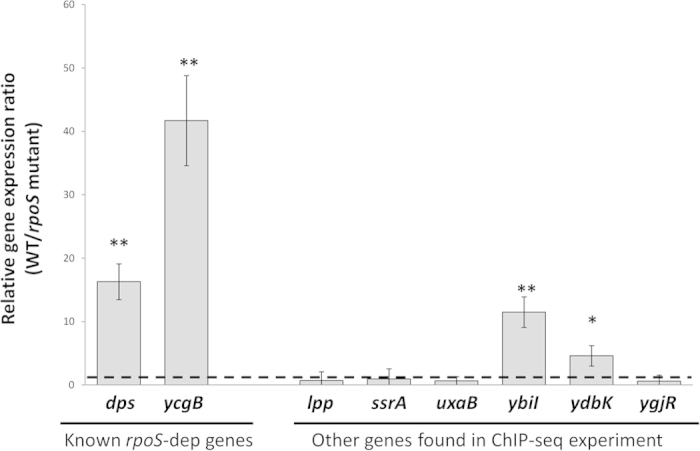
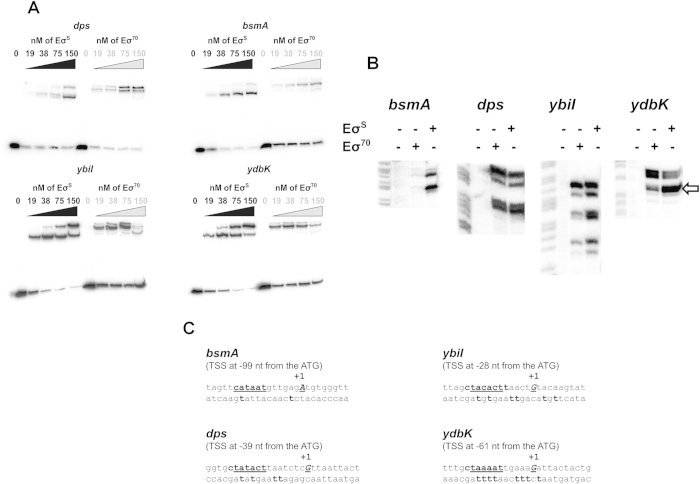
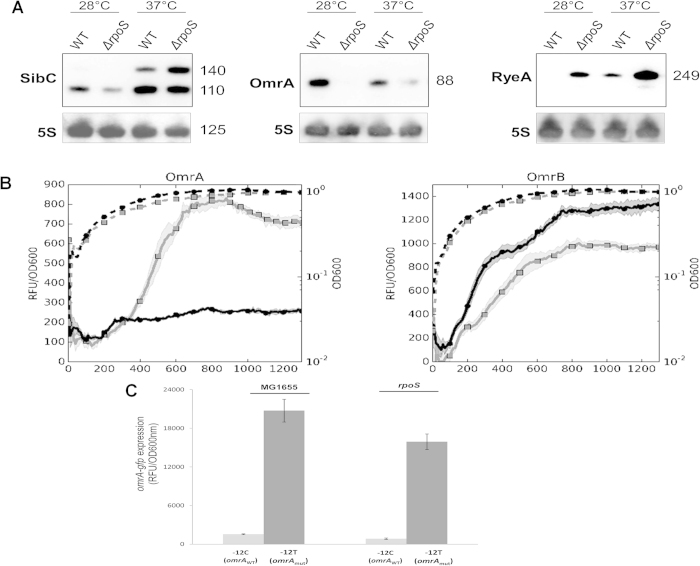
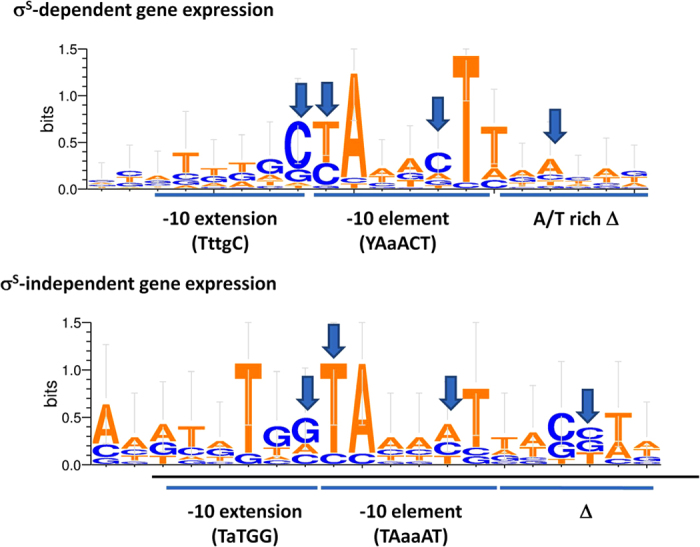
In bacteria, selective promoter recognition by RNA polymerase is achieved by its association with σ factors, accessory subunits able to direct RNA polymerase "core enzyme" (E) to different promoter sequences. Using Chromatin Immunoprecipitation-sequencing (ChIP-seq), we searched for promoters bound by the σ(S)-associated RNA polymerase form (Eσ(S)) during transition from exponential to stationary phase. We identified 63 binding sites for Eσ(S) overlapping known or putative promoters, often located upstream of genes (encoding either ORFs or non-coding RNAs) showing at least some degree of dependence on the σ(S)-encoding rpoS gene. Eσ(S) binding did not always correlate with an increase in transcription level, suggesting that, at some σ(S)-dependent promoters, Eσ(S) might remain poised in a pre-initiation state upon binding. A large fraction of Eσ(S)-binding sites corresponded to promoters recognized by RNA polymerase associated with σ(70) or other σ factors, suggesting a considerable overlap in promoter recognition between different forms of RNA polymerase. In particular, Eσ(S) appears to contribute significantly to transcription of genes encoding proteins involved in LPS biosynthesis and in cell surface composition. Finally, our results highlight a direct role of Eσ(S) in the regulation of non coding RNAs, such as OmrA/B, RyeA/B and SibC.


Conflict of interest statement

The authors declare no competing financial interests.

Figures

Figure 1
Figure 1. Characterization of the MG1655-rpoSHis6 mutant.
A. Growth curves in LB medium of MG1655 (circles) and MG1655-rpoSHis6 (diamonds) strains. Intracellular amount of σS (for MG1655) and σS-His6 (for MG1655-rpoSHis6) as determined by western blot at the onset of stationary phase (points 1 and 2 in the graph) are shown in the inset. B. HPII catalase specific activity in MG1655, MG1655-rpoSHis6 and in the MG1655ΔrpoS strains. Values from three independent experiments were analyzed by ANOVA; the letters indicate samples showing statistically significant differences. C. Determination of relative abundance of the dps promoter region in the Immunoprecipitated (IP) versus the Input sample by RT-PCR. Data are the average of two repeats with identical results.
Figure 2
Figure 2. Visualization through IGV of the binding peaks obtained from CisGenome analysis.
The blue profiles show the IP and Input tag density profiles for the known rpoS-dependent genes osmB, dps, osmE and csrA (A) and for the loci associated to the non-coding RNAs sibC/ibsC, ryeA/ryeB, and omrA/omrB (B). The red profiles show the log2 signal to control enrichment estimates values obtained using spp (peaks) for the same genes and non-coding RNAs. Values on X axis are the genomic coordinates of the peaks; a representation of the corresponding gene/intergenic regions taken from Ecocyc (ecocyc.org) is shown.
Figure 3
Figure 3. RT-PCR analysis.
The Relative expression ratio between WT and rpoS mutant indicated in the graph are the average of at least four experiments (two repeats, each performed on duplicate samples, from two independent RNA extractions), and standard deviations are shown. The asterisks denote significant differences (*=p < 0.05; **= p < 0.01 Tukey multigroup analysis). The dashed line indicates a WT/rpoS mutant expression ratio=1.
Figure 4
Figure 4. EσS-promoter interactions in vitro.
A. Gel retardation assays performed in K-glutamate buffer with heparin challenge. B. KMnO4 reactivity assays: both EσS and Eσ70 forms of RNA polymerase were tested at 50 nM. For each panel, the first lane is a molecular weight marker obtained as a G+A sequencing reaction of the DNA fragment. C. Sequence of the newly identified bsmA, ybiI and ydbK promoters. Sequences are given from position −17 to +10 according to the transcription start site (TSS) labelled “+1” and indicated in bold. The −10 promoter element is underlined. KMnO4-reactive thymidine residues in the template strand (labelled with 32P) reactive in the KMnO4 assays are indicated in bold.
Figure 5
Figure 5. Regulation of small non-coding RNAs by σS.
A. Northern blot hybridization. RNA were extracted at the onset of stationary phase (OD600nm of 3) from bacteria grown in LB at either 28 °C or 37 °C and probed for SibC, OmrA, and RyeA transcript levels (left to right). Numbers on the right side of each panel indicate the size of the respective ncRNA. The gels were probed for the genes of interest, then the probe was removed by washing and the gels were re-probed for 5S RNA, which was used as internal control. B. Relative fluorescence of transcriptional fusions of the omrA and omrB promoters to the GFP reporter gene. The promoter activity (solid line) is expressed as ratio between the fluorescence and the absorbance of the culture (dashed line) after background correction (RFU/OD600 nm). C. Effects of the substitution of the −12C to a T nucleotide in the omrA promoter region. Data were taken from overnight cultures and are the average of four independent experiments.
Figure 6
Figure 6. Promoter sequence alignment.
Weblogo 3 (http://weblogo.threeplusone.com/) representation of the sequence alignments for experimentally identified promoters located within EσS binding sites. −10 regions of either σS-dependent (top panel) or σS-independent genes (bottom panel) were aligned setting the first nucleotide of the −10 hexamer as −12 position. Promoter sequences are reported in Table S3.

References

    1. Lloyd G., Landini P. & Busby S. Activation and repression of transcription initiation in bacteria. Essays Biochem 37, 17–31 (2001). - PubMed
    1. Gourse R. L., Ross W. & Rutherford S. T. General pathway for turning on promoters transcribed by RNA polymerases containing alternative sigma factors. J Bacteriol 188, 4589–4591 (2006). - PMC - PubMed
    1. Battesti A., Majdalani N. & Gottesman S. The RpoS-mediated general stress response in Escherichia coli. Annu Rev Microbiol 65, 189–213. - PMC - PubMed
    1. Hengge-Aronis R. in Bacterial Stress Responses 161–178 (ASM Press, Washington, DC; 2000).
    1. Landini P., Egli T., Wolf J. & Lacour S. sigmaS, a major player in the response to environmental stresses in Escherichia coli: role, regulation and mechanisms of promoter recognition. Environ Microbiol Rep 6, 1–13 (2014). - PubMed

Publication types

MeSH terms