. 2015 May 29:6:7211.
doi: 10.1038/ncomms8211.

Characterization of functional methylomes by next-generation capture sequencing identifies novel disease-associated variants

Collaborators, Affiliations

Characterization of functional methylomes by next-generation capture sequencing identifies novel disease-associated variants

Fiona Allum et al. Nat Commun. .

Erratum in

Abstract

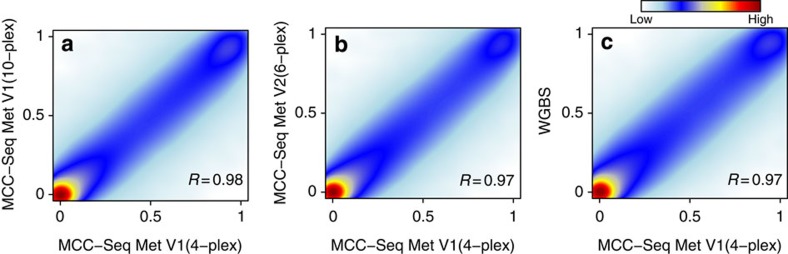
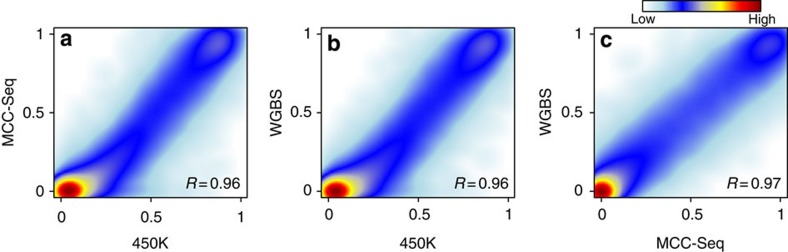
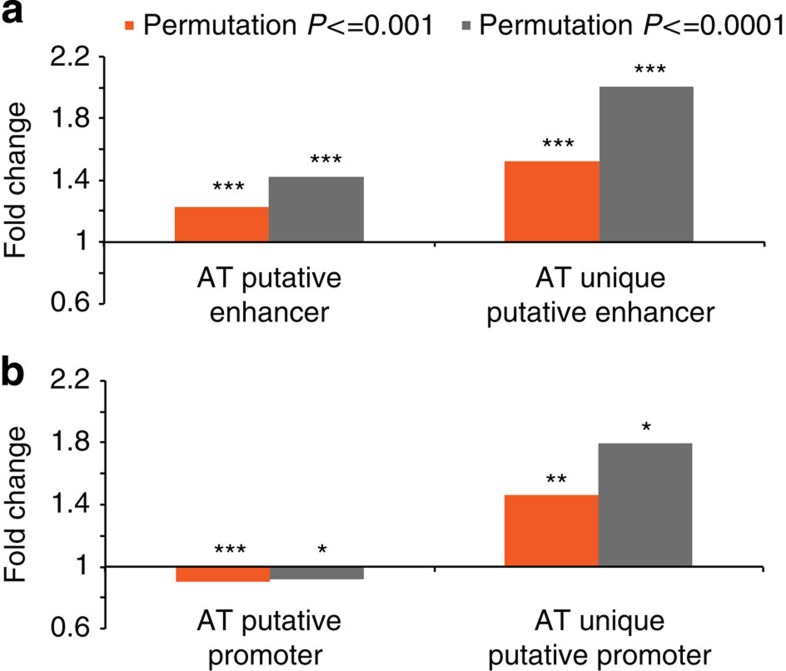
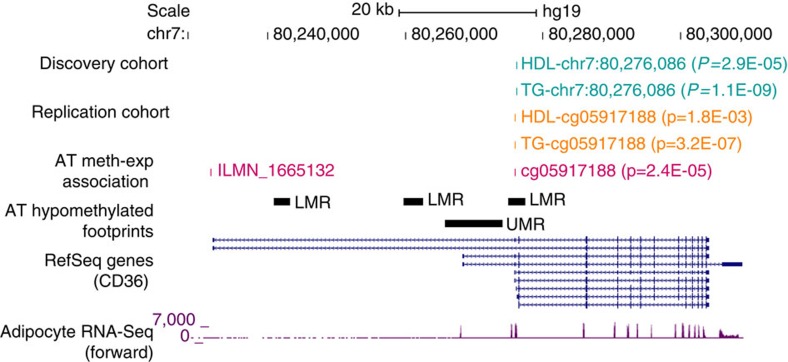
Most genome-wide methylation studies (EWAS) of multifactorial disease traits use targeted arrays or enrichment methodologies preferentially covering CpG-dense regions, to characterize sufficiently large samples. To overcome this limitation, we present here a new customizable, cost-effective approach, methylC-capture sequencing (MCC-Seq), for sequencing functional methylomes, while simultaneously providing genetic variation information. To illustrate MCC-Seq, we use whole-genome bisulfite sequencing on adipose tissue (AT) samples and public databases to design AT-specific panels. We establish its efficiency for high-density interrogation of methylome variability by systematic comparisons with other approaches and demonstrate its applicability by identifying novel methylation variation within enhancers strongly correlated to plasma triglyceride and HDL-cholesterol, including at CD36. Our more comprehensive AT panel assesses tissue methylation and genotypes in parallel at ∼4 and ∼3 M sites, respectively. Our study demonstrates that MCC-Seq provides comparable accuracy to alternative approaches but enables more efficient cataloguing of functional and disease-relevant epigenetic and genetic variants for large-scale EWAS.


Conflict of interest statement

The authors declare no competing financial interests.

Figures

Figure 1
Figure 1. Technical replication of MCC-Seq methylation calls and comparison with WGBS.
Correlation between technical replicates from a DNA sample derived from VAT sequenced from independent captures (a) of the same MCC-Seq sequence panel (Met V1) (4-plex and 10-plex; N=1,587,026 CpGs; R=0.98) and (b) of two different MCC-Seq sequence panels (Met V14-plex and Met V26-plex; N=1,569,170 CpGs; R=0.97). (c) Comparison between MCC-Seq4-plex and WGBS (N=1,620,874 CpGs; R=0.97) methylation calls for the same VAT DNA sample. Only CpGs with sequence coverage ≥5X in MCC-Seq and WGBS experiments were included in the analysis; R is the Pearson's correlation coefficient.
Figure 2
Figure 2. Comparison of methylation calls obtained with different methods.
(a) Correlation between MCC-Seq4-plex and Illumina 450K array methylation calls for the same VAT DNA sample (R=0.96), (b) comparison between WGBS and Illumina 450K array results (R=0.96) and (c) comparison between WGBS and MCC-Seq4-plex results (R=0.97). Only CpGs with data available from all three techniques were included (N=150,898 CpGs); we required sequence coverage ≥5X for MCC-Seq and WGBS; R is the Pearson's correlation coefficient.
Figure 3
Figure 3. Annotation of TG-associated CpGs in putative regulatory regions.
CpGs with average reads coverage above the 20th percentile that showed evidence of association with TG (P≤0.001 or P≤0.0001) were annotated with additional data. (a) This panel shows significant enrichment (y axis, fold-change) of TG-associated CpGs for P≤0.001 (orange bars) and P≤0.0001 (grey bars) within putative enhancer regions as defined by H3K4me1 marks and/or LMRs (***P=5.3 × 10⁻⁷ for P≤0.001 and P=4.9 × 10⁻⁵ for P≤0.0001 CpGs, respectively), and for H3K4me1 marks and/or LMRs unique to AT (***P=6.0 × 10⁻¹⁰ for P≤0.001 and P=4.1 × 10⁻⁷ for P≤0.0001 CpGs, respectively). (b) This panel shows significant depletion (y axis, fold-change) of the same TG-associated CpGs significance (P≤0.001 shown as orange bars and P≤0.0001 shown as grey) within putative promoter regions as demarcated by H3K4me3 marks and/or UMRs (***P=7.1 × 10⁻¹⁰ for CpGs with P≤0.001 and *P=0.023 for CpGs with P≤0.0001), but enrichment when restricting to H3K4me3 marks and/or UMRs unique to AT (**P=2.4 × 10⁻³ for CpGs with P≤0.001 and *P=0.020 for CpGs with P≤0.0001). Enrichment was established using Fisher's exact test.
Figure 4
Figure 4. Top TG-associated CpG mapping to an AT-specific regulatory region—CD36.
The top TG-associated CpG (chr7:80,276,086-80,276,087; P=1.1 × 10⁻⁹; GLM assuming a binomial distribution; turquoise track) identified in the discovery cohort maps within an intragenic region of CD36, which overlaps an AT-unique LMR (black track). Investigation within a population-based cohort (N∼650) replicated the epigenetic effect in a nearby 450K array probes (orange track); mapping to the same regulatory region (cg05917188; P=3.2 × 10⁻⁷; linear mixed model). The methylation status of the latter probe was also found to be negatively associated to CD36 expression in AT (ILMN_1665132; P=6.7 × 10⁻⁵; linear mixed model, pink track). AT-specific expression of the gene was also noted through AT RNA-Seq data (purple track).

References

    1. Jones P. A. Functions of DNA methylation: islands, start sites, gene bodies and beyond. Nat. Rev. Genet. 13, 484–492 (2012). - PubMed
    1. Consortium, E. P.. et al.. An integrated encyclopedia of DNA elements in the human genome. Nature 489, 57–74 (2012). - PMC - PubMed
    1. Grundberg E. et al.. Global analysis of DNA methylation variation in adipose tissue from twins reveals links to disease-associated variants in distal regulatory elements. Am. J. Hum. Genet. 93, 876–890 (2013). - PMC - PubMed
    1. Breitling L. P., Yang R., Korn B., Burwinkel B. & Brenner H. Tobacco-smoking-related differential DNA methylation: 27K discovery and replication. Am. J. Hum. Genet. 88, 450–457 (2011). - PMC - PubMed
    1. Wagner J. R. et al.. The relationship between DNA methylation, genetic and expression inter-individual variation in untransformed human fibroblasts. Genome Biol. 15, R37 (2014). - PMC - PubMed

Publication types

Associated data