. 2015 May 29:5:10667.
doi: 10.1038/srep10667.

The Cullin 4A/B-DDB1-Cereblon E3 Ubiquitin Ligase Complex Mediates the Degradation of CLC-1 Chloride Channels

Affiliations

The Cullin 4A/B-DDB1-Cereblon E3 Ubiquitin Ligase Complex Mediates the Degradation of CLC-1 Chloride Channels

Yi-An Chen et al. Sci Rep. .

Abstract

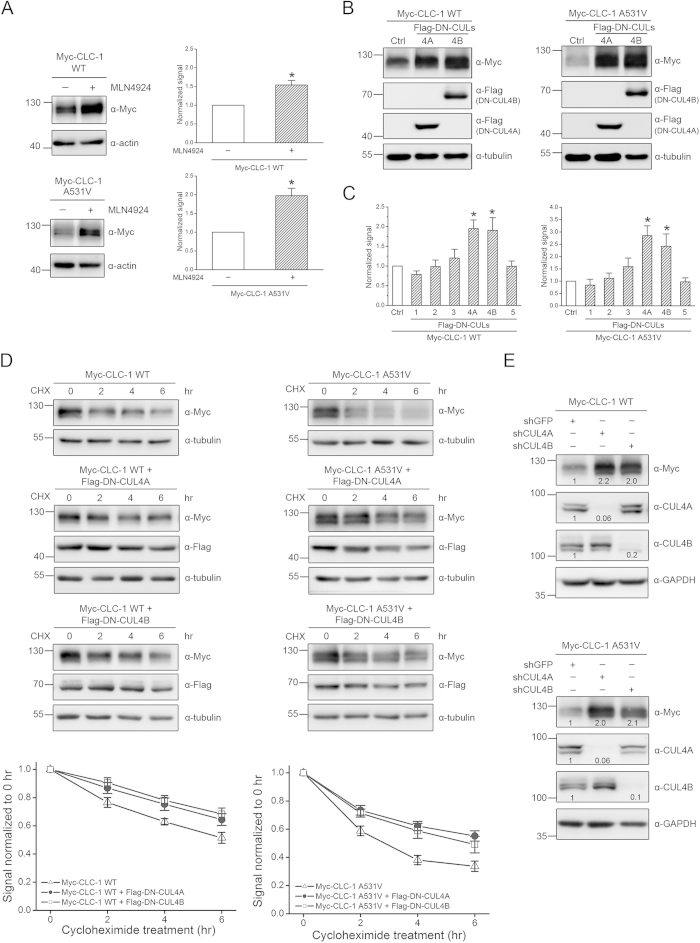
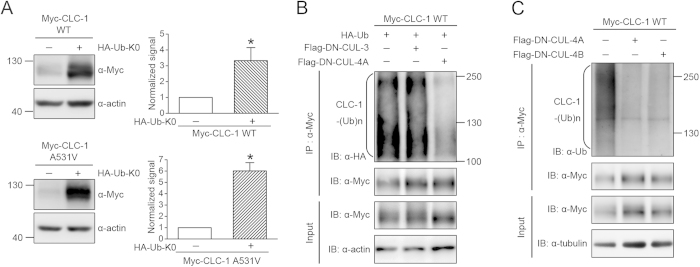
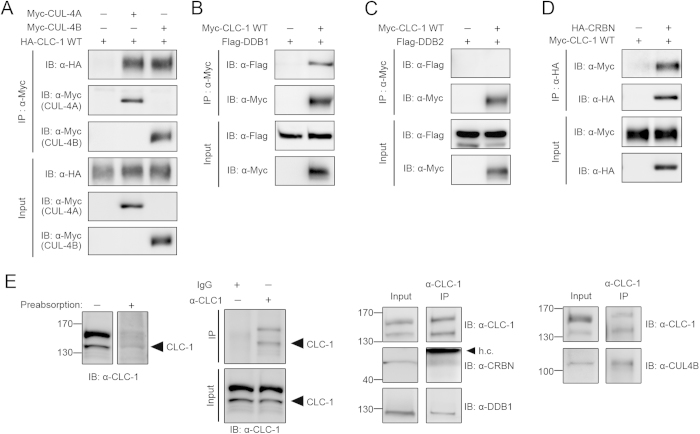
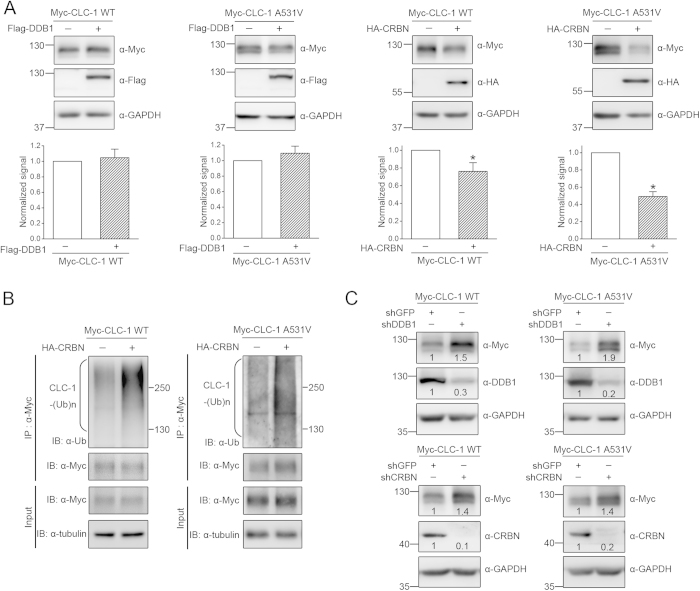
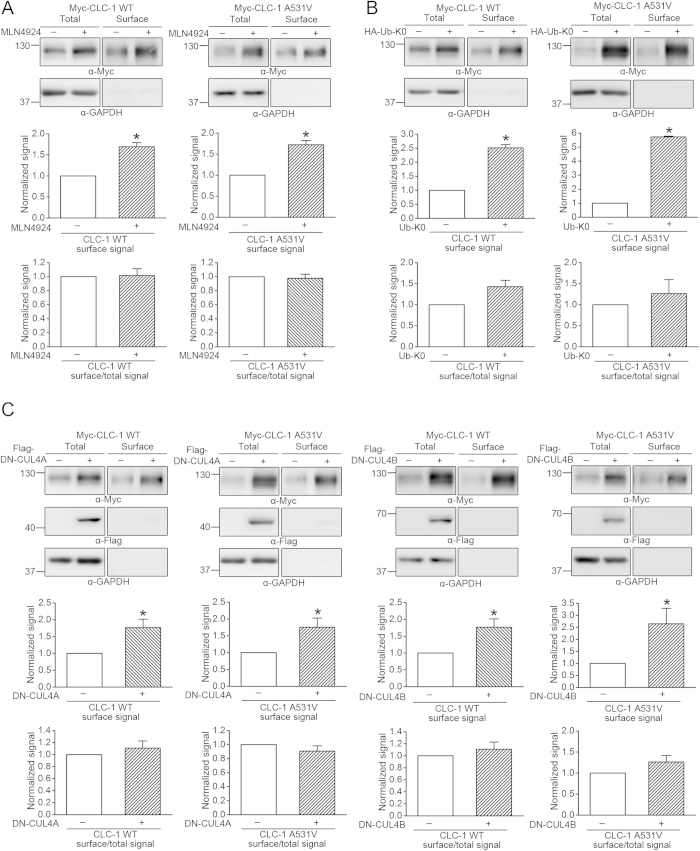
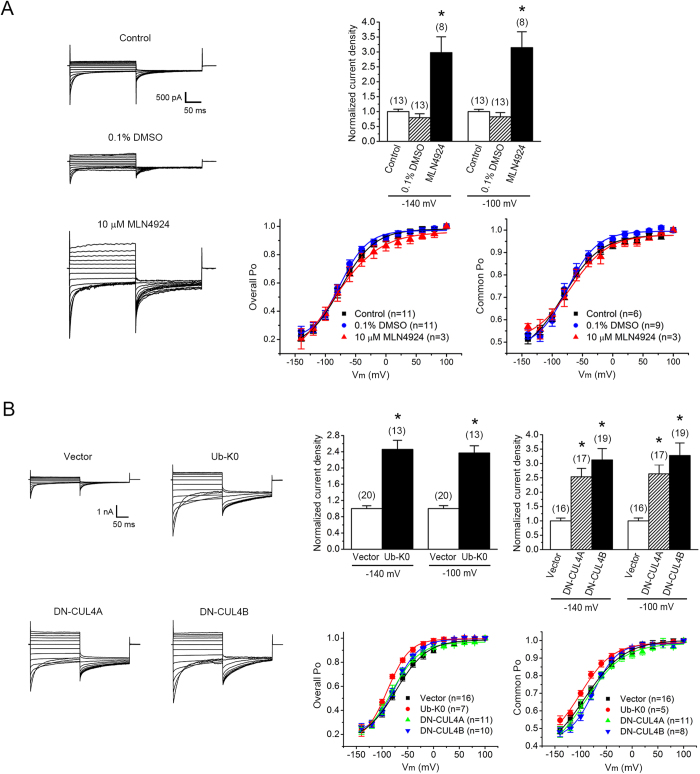
Voltage-gated CLC-1 chloride channels play a critical role in controlling the membrane excitability of skeletal muscles. Mutations in human CLC-1 channels have been linked to the hereditary muscle disorder myotonia congenita. We have previously demonstrated that disease-associated CLC-1 A531V mutant protein may fail to pass the endoplasmic reticulum quality control system and display enhanced protein degradation as well as defective membrane trafficking. Currently the molecular basis of protein degradation for CLC-1 channels is virtually unknown. Here we aim to identify the E3 ubiquitin ligase of CLC-1 channels. The protein abundance of CLC-1 was notably enhanced in the presence of MLN4924, a specific inhibitor of cullin-RING E3 ligases. Subsequent investigation with dominant-negative constructs against specific subtypes of cullin-RING E3 ligases suggested that CLC-1 seemed to serve as the substrate for cullin 4A (CUL4A) and 4B (CUL4B). Biochemical examinations further indicated that CUL4A/B, damage-specific DNA binding protein 1 (DDB1), and cereblon (CRBN) appeared to co-exist in the same protein complex with CLC-1. Moreover, suppression of CUL4A/B E3 ligase activity significantly enhanced the functional expression of the A531V mutant. Our data are consistent with the idea that the CUL4A/B-DDB1-CRBN complex catalyses the polyubiquitination and thus controls the degradation of CLC-1 channels.


Figures

Figure 1
Figure 1. CUL4A and 4B control the protein level of CLC-1.
Biochemical demonstration of the regulation of CLC-1 by cullin in HEK293T cells.(A)(Left) Representative immunoblots showing the effect of 24-hr treatment of 10 μM MLN4924 (in 0.1% DMSO) on protein expression of Myc-CLC-1. The molecular weight markers (in kilodaltons) and immunoblotting antibodies (α-Myc and α-actin) are labeled to the left and right, respectively. Expressions of actin are displayed as the loading control. (Right) Quantification of relative CLC-1 protein expression level. Protein density was standardized as the ratio of the CLC-1 signal to the cognate actin signal. Values from the MLN4924-treated group (hatched bars) were then normalized to those for the corresponding control (clear bars). Asterisks denote significant difference from the control (*, t-test: p < 0.05; n = 5-6).(B) The effect of Flag-DN-CUL4A/B co-expression on CLC-1. Co-expression with the Flag vector was used as the control experiment (Ctrl). Tubulin was used as the loading control. (C) Quantification of relative CLC-1 protein level in the presence of various DN-CUL constructs. See Supplementary Figure S1 for more immunoblots. Asterisks denote significant difference from the Flag vector control (Ctrl) (*, t-test: p < 0.05; n =4-16). (D)(Top) The kinetics of CLC-1 protein turn-over in the presence of different treatment durations of 100 μg/ml cycloheximide (CHX). Co-expression with the pcDNA3 vector was used as the control experiment. (Bottom) Protein densities were standardized as the ratio of CLC-1 signals to the cognate actin signals, followed by normalization to those of the vector control at 0 hr. Based on linear-regression analyses of the semi-logarithmic plot of the protein degradation time course, the protein half-life values for CLC-1 WT (n = 7-20) are about 6.1 (Control), 9.5 (DN-CUL4A) and 10.8 (DN-CUL4B) hrs; those for the A531V mutant (n = 8-15) are about 3.3 (Control), 5.6 (DN-CUL4A) and 6.5 (DN-CUL4B) hrs.(E) The effect of shRNA knock-down of endogenous CUL4A/B. The numbers denote the relative CLC-1/CUL4A/CUL4B expression level with respect to the control shRNA. The gels were run under the same experimental conditions. Uncropped images of immunoblots are shown in Supplementary Figure S2.
Figure 2
Figure 2. CUL4A and 4B regulate CLC-1 protein polyubiquitination.
(A) Biochemical demonstration of CLC-1 polyubiquitination in HEK293T cells. (Left) Representative immunoblots showing the effect of HA-tagged lysine-less ubiquitin (HA-Ub-K0) co-expression on Myc-CLC-1. (Right) Quantification of relative CLC-1 protein expression level. Standardized protein densities of the Ub-K0 co-expression group (hatched bars) were normalized to those for the corresponding HA-vector control (clear bars). Asterisks denote significant difference from the control (*, t-test: p < 0.05; n = 5-6).(B) CLC-1 polyubiquitination [CLC-1-(Ub)n] by HA-Ub was reduced by DN-CUL4A, but not DN-CUL3. Co-expression with the Flag vector was used as the control experiment. Cell lysates were immunoprecipitated (IP) with the anti-Myc antibody, and protein ubiquitination was recognized by immunoblotting (IB) the immunoprecipitates with the anti-HA antibody. Corresponding expression levels of CLC-1 and actin in the lysates are shown in the Input lane. In all cases hereafter, input represents about 10% of the total protein used for immunoprecipitation. (C) CLC-1 polyubiquitination by endogenous ubiquitin was disrupted in the presence of DN-CUL4A/B. Co-expression with the Flag vector was used as the control experiment. Protein ubiquitination was identified by immunoblotting the immunoprecipitates with the anti-ubiquitin (Ub) antibody. The gels were run under the same experimental conditions. Uncropped images of immunoblots are shown in Supplementary Figure S2.
Figure 3
Figure 3. CUL4A/B, DDB1 and CRBN co-exist in the same protein complex with CLC-1.
Biochemical inspection of CLC-1 protein interactions. (A) Co-immunoprecipitation of HA-CLC-1 and Myc-CUL4A/B in HEK293T cells. Co-expression of HA-CLC-1 and the Myc vector was used as the control experiment. (B) Co-immunoprecipitation of Myc-CLC-1 and Flag-DDB1 in HEK293T cells. Co-expression of Flag-DDB1 and the Myc vector was used as the control experiment. (C) Lack of co-immunoprecipitation of Myc-CLC-1 and Flag-DDB2 in HEK293T cells. Co-expression of Flag-DDB2 and the Myc vector was used as the control experiment. (D) Co-immunoprecipitation of Myc-CLC-1 and HA-CRBN in HEK293T cells. Co-expression of Myc-CLC-1 and the HA vector was used as the control experiment. Cell lysates were immunoprecipitated with the anti-Myc (A,B,C) or anti-HA (D) antibody. (E) Protein interactions of endogenous CLC-1 channels in rat skeletal muscle. Verification of the specificity of the anti-CLC-1 antibody: (Far left) CLC-1 immunoreactivity was notably reduced in the presence of an excess of a control antigen peptide; (Center left) immunoprecipitation was achieved by using the anti-CLC-1 antibody, but not rabbit IgG. (Center right, Far right) Co-immunoprecipitation of CLC-1, CRBN, DDB1, and CUL4B. Muscle lysates were immunoprecipitated with the anti-CLC-1 antibody. h.c.: IgG heavy chain. The gels were run under the same experimental conditions. Uncropped images of immunoblots are shown in Supplementary Figure S2.
Figure 4
Figure 4. CRBN modulates CLC-1 protein level.
Biochemical demonstration of the regulation of CLC-1 by CRBN in HEK293T cells. (A)(Top) Representative immunoblots showing the effect of Flag-DDB1 or HA-CRBN over-expression on Myc-CLC-1 protein. Co-expression with the Flag/HA vector was used as the control experiment. (Bottom) Quantification of relative CLC-1 protein expression level. Values from the DDB1/CRBN co-expression group (hatched bars) were normalized to those for the corresponding vector control (clear bars). Asterisks denote significant difference from the control (*, t-test: p < 0.05; n =6-12).(B) CLC-1 polyubiquitination [CLC-1-(Ub)n] by endogenous ubiquitin was enhanced by CRBN over-expression. Cell lysates were immunoprecipitated (IP) with the anti-Myc antibody. Protein ubiquitination was identified by immunoblotting the immunoprecipitates with the anti-ubiquitin (Ub) antibody. (C) Representative immunoblots showing the effect of shRNA knock-down of endogenous DDB1 or CRBN. The numbers denote the relative CLC-1/DDB1/CRBN expression level with respect to the control shRNA for GFP. The gels were run under the same experimental conditions. Uncropped images of immunoblots are shown in Supplementary Figure S2.
Figure 5
Figure 5. Suppression of CUL4A/B E3 ligase activity increases CLC-1 surface expression.
Surface biotinylation experiments on HEK293T cells expressing Myc-CLC-1 channels in the presence of (A) 10 μM MLN4924, (B) HA-Ub-K0, or (C) Flag-DN-CUL4A/B. Drug-free incubation or co-expression with the HA/Flag vector was used as the control experiment. (Top) Representative immunoblots. Cell lysates from biotinylated intact cells were either directly employed for immunoblotting analyses (total) or subject to streptavidin pull-down before being used for immunoblotting analyses (surface). (Middle) Quantification of surface protein level. The surface protein density was standardized as the ratio of surface signal to cognate total actin signal, followed by normalization to that of the corresponding control. Asterisks denote significant difference from the control (*, t-test: p < 0.05; n = 3-9). (Bottom) Quantification of surface expression efficiency. The total protein density was standardized as the ratio of input signal to actin signal. The efficiency of surface presentation was expressed as surface protein density divided by the corresponding standardized total protein density. The mean surface expression ratio was normalized to that of the corresponding control. The gels were run under the same experimental conditions. Uncropped images of immunoblots are shown in Supplementary Figure S2.
Figure 6
Figure 6. Suppression of CUL4A/B E3 ligase activity enhances the functional expression of the A531V mutant.
Electrophysiological analyses of Flag-CLC-1 A531V channels in HEK293T cells.(A) Treatment with 10 μM MLN4924 (in 0.1% DMSO) increased the current amplitude of the A531V mutant. (Left) Representative whole-cell patch clamp recordings. Two types of drug-free incubation (control and 0.1% DMSO) were used to evaluate the effect of MLN4924. The holding potential was 0 mV. The voltage protocol comprised a 200-ms test pulse (Vm) ranging from +100 mV to -140 mV in -20 mV steps, followed by a second step (tail potential) to -100 mV for 200 ms. (Upper right) Instantaneous current amplitudes at the test pulse potential of -140 or -100 mV were used for the calculation of whole-cell current density, followed by normalization with respect to the corresponding control condition. Despite the presence of some peak current amplitudes over 10 nA, voltage clamping or filtering errors did not appear to notably affect the validity of our analyses (see Supplementary Figure S5). (Lower right) Steady-state voltage-dependence properties (Po–V curves) of the A531V mutant. Both the Po of fast and common gates (Overall Po) and the Po of common gates (Common Po) were analyzed. See Supplementary Table S1 for more details on Po–V parameters.(B) Co-expression with Ub-K0 or DN-CUL4A/B increased the current amplitude of the A531V mutant. Co-expression with the HA/Flag vector was used as the control experiment. (Left) Representative whole-cell patch clamp recordings. (Upper right) Normalized instantaneous current densities. (Lower right) Steady-state voltage-dependence properties. Asterisks denote a significant difference from the control condition (*, t-test: p < 0.05).

References

    1. Bretag A. H. Muscle chloride channels. Physiol Rev 67, 618–724 (1987). - PubMed
    1. Bryant S. H. & Morales-Aguilera A. Chloride conductance in normal and myotonic muscle fibres and the action of monocarboxylic aromatic acids. J Physiol 219, 367–383 (1971). - PMC - PubMed
    1. Dulhunty A. F. Distribution of potassium and chloride permeability over the surface and T-tubule membranes of mammalian skeletal muscle. J Membr Biol 45, 293–310 (1979). - PubMed
    1. Jurkat-Rott K., Lerche H. & Lehmann-Horn F. Skeletal muscle channelopathies. J Neurol 249, 1493–1502 (2002). - PubMed
    1. Lossin C. & George A. L. Jr. Myotonia congenita. Adv Genet 63, 25–55 (2008). - PubMed

Publication types

MeSH terms