. 2015 Jul 10;290(28):17495-504.
doi: 10.1074/jbc.M115.660498. Epub 2015 May 28.

Signaling through the Phosphatidylinositol 3-Kinase (PI3K)/Mammalian Target of Rapamycin (mTOR) Axis Is Responsible for Aerobic Glycolysis mediated by Glucose Transporter in Epidermal Growth Factor Receptor (EGFR)-mutated Lung Adenocarcinoma

Affiliations

Signaling through the Phosphatidylinositol 3-Kinase (PI3K)/Mammalian Target of Rapamycin (mTOR) Axis Is Responsible for Aerobic Glycolysis mediated by Glucose Transporter in Epidermal Growth Factor Receptor (EGFR)-mutated Lung Adenocarcinoma

Hideki Makinoshima et al. J Biol Chem. .

Abstract

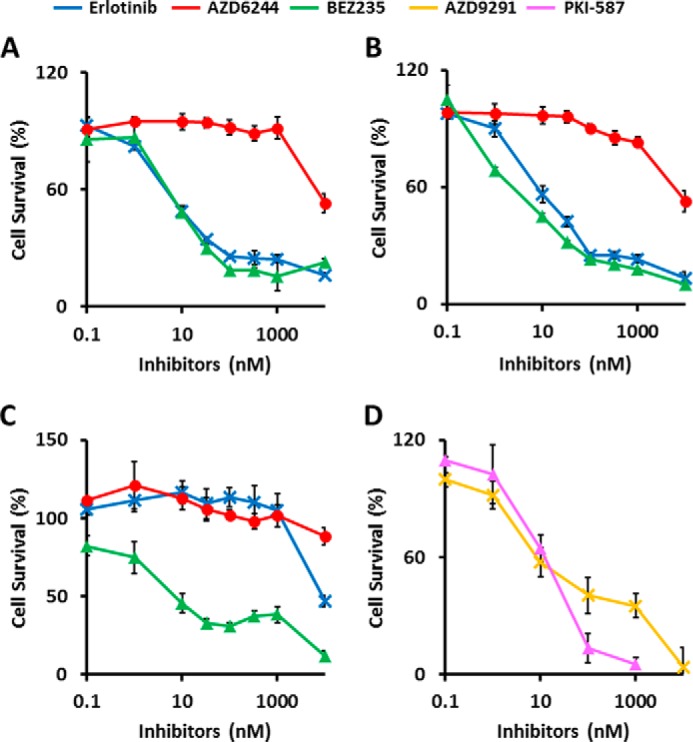
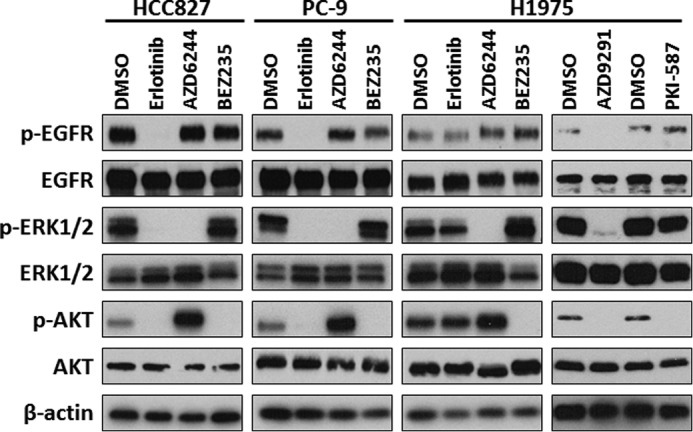
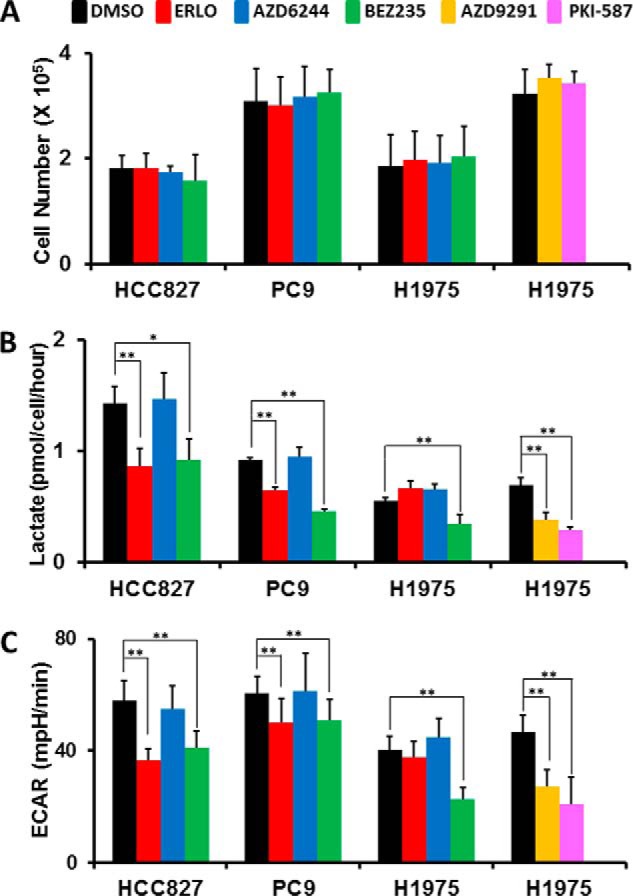
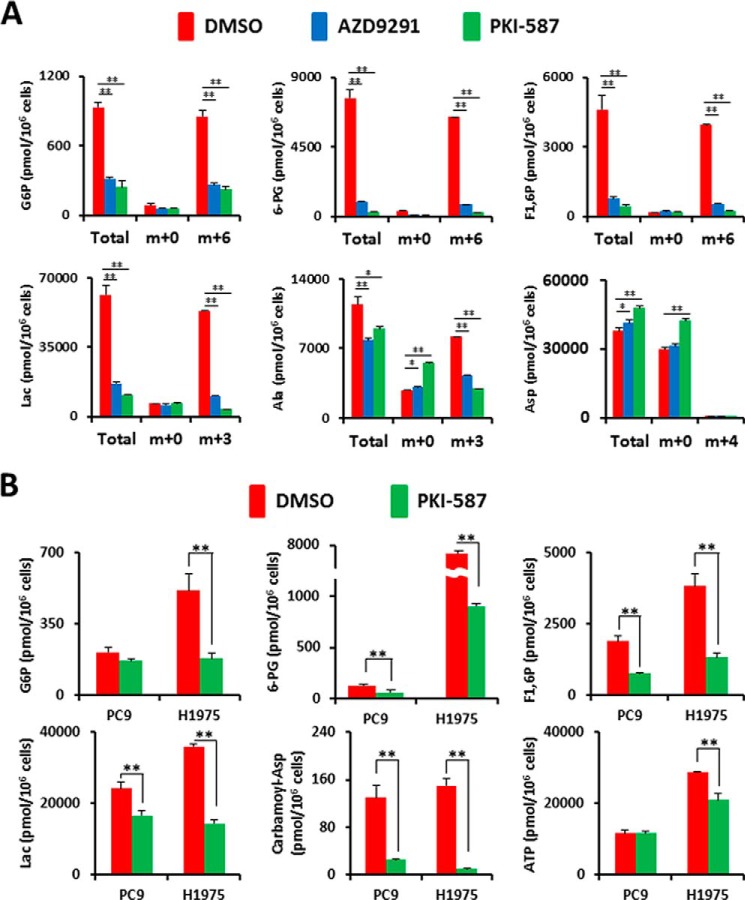
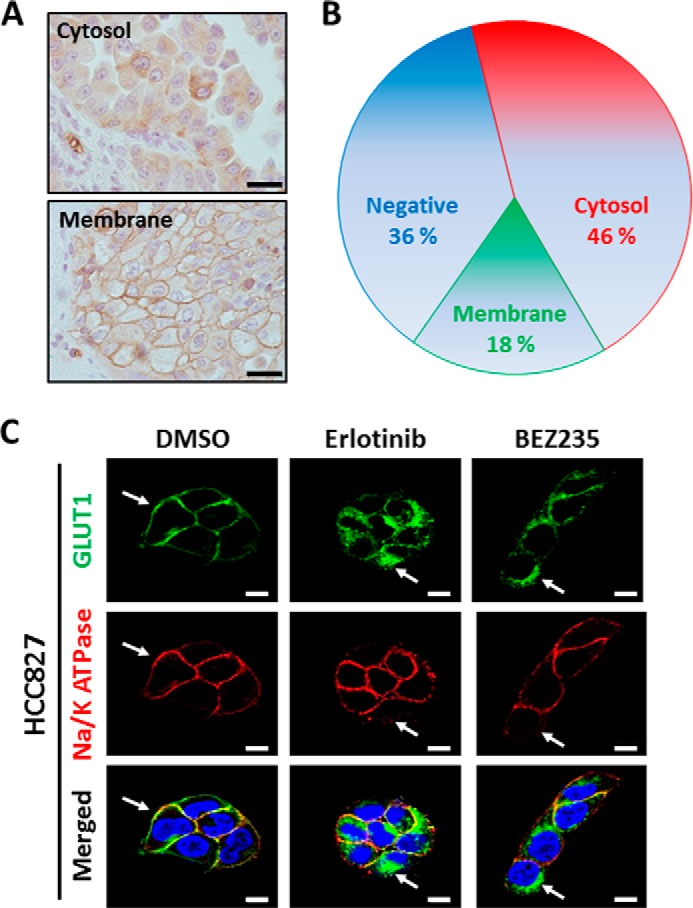
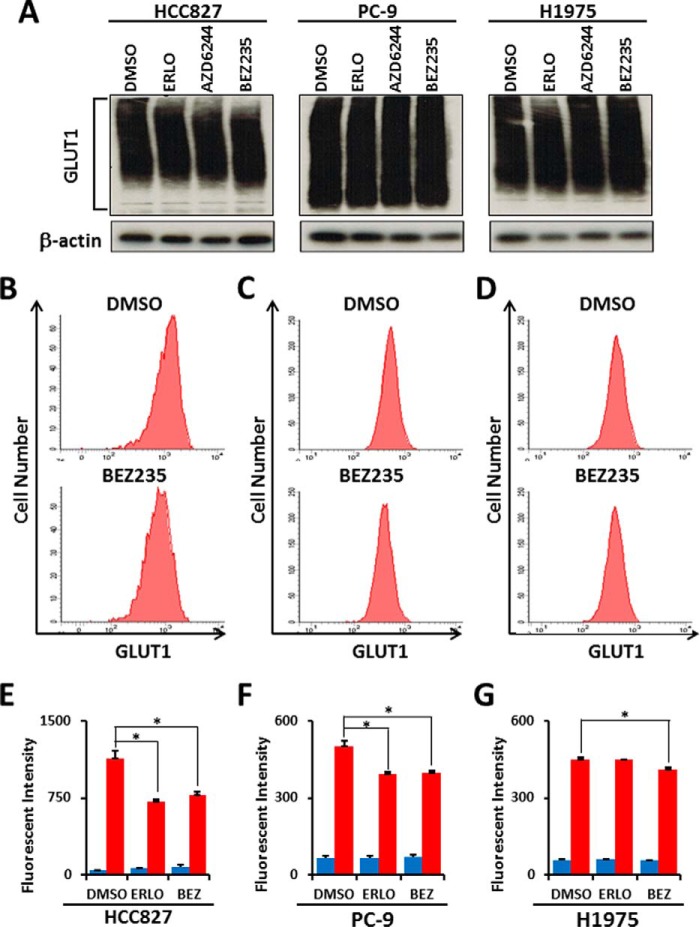
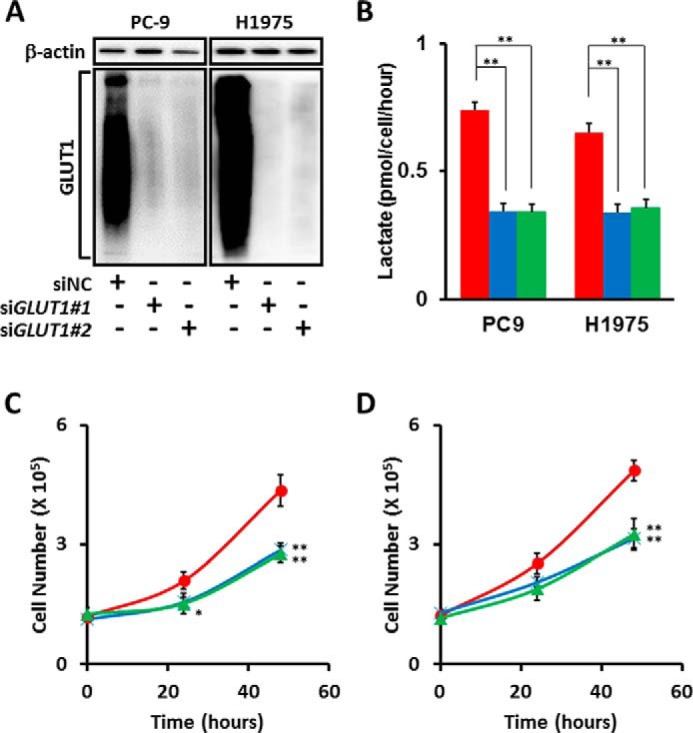
Oncogenic epidermal growth factor receptor (EGFR) signaling plays an important role in regulating global metabolic pathways, including aerobic glycolysis, the pentose phosphate pathway (PPP), and pyrimidine biosynthesis. However, the molecular mechanism by which EGFR signaling regulates cancer cell metabolism is still unclear. To elucidate how EGFR signaling is linked to metabolic activity, we investigated the involvement of the RAS/MEK/ERK and PI3K/AKT/mammalian target of rapamycin (mTOR) pathways on metabolic alteration in lung adenocarcinoma (LAD) cell lines with activating EGFR mutations. Although MEK inhibition did not alter lactate production and the extracellular acidification rate, PI3K/mTOR inhibitors significantly suppressed glycolysis in EGFR-mutant LAD cells. Moreover, a comprehensive metabolomics analysis revealed that the levels of glucose 6-phosphate and 6-phosphogluconate as early metabolites in glycolysis and PPP were decreased after inhibition of the PI3K/AKT/mTOR pathway, suggesting a link between PI3K signaling and the proper function of glucose transporters or hexokinases in glycolysis. Indeed, PI3K/mTOR inhibition effectively suppressed membrane localization of facilitative glucose transporter 1 (GLUT1), which, instead, accumulated in the cytoplasm. Finally, aerobic glycolysis and cell proliferation were down-regulated when GLUT1 gene expression was suppressed by RNAi. Taken together, these results suggest that PI3K/AKT/mTOR signaling is indispensable for the regulation of aerobic glycolysis in EGFR-mutated LAD cells.

Keywords: epidermal growth factor receptor (EGFR); glucose transport; glycolysis; lung cancer; mammalian target of rapamycin (mTOR); metabolomics; phosphatidylinositol 3-kinase (PI3K).


Figures

FIGURE 1.
FIGURE 1.
EGFR-mutant LAD cells are more sensitive to dual PI3K/mTOR inhibitors than MEK inhibitor. Cells were treated with inhibitors at the indicated concentrations for 72 h, and viability was assessed using the WST-8 assay. A–D, HCC827 (A), PC-9 (B) and H1975 cells (C and D). The data are shown as the mean ± S.D. (n = 6). A—C, blue line, erlotinib; red line, AZD6244; green line, BEZ235. D, magenta line, PKI-587; yellow line, AZD9291. The in vitro IC50 for the growth of HCC827 was determined to be 0.010 μm for erlotinib, >10 μm for AZD6244, and 0.011 μm for BEZ235. PC-9 had an IC50 of 0.019 μm for erlotinib, >10 μm for AZD6244, and 0.005 μm for BEZ235. H1975 had an IC50 of >10 μm for erlotinib, >10 μm for AZD6244, 0.042 μm for BEZ235, 0.050 μm for AZD9291, and 0.042 μm for PKI-587.
FIGURE 2.
FIGURE 2.
Altered phosphorylation of EGFR signaling proteins in EGFR-mutant LAD cells after treatment with inhibitors. Western blot analysis showing pEGFR, total EGFR, pERK, total ERK, pAKT), total AKT, and β-actin as a loading control in HCC827, PC-9, and H1975 cells treated with the indicated inhibitors. Equivalent amounts of proteins from whole cell lysates were subjected to WB analysis to detect the indicated proteins.
FIGURE 3.
FIGURE 3.
Glycolytic activities decreased after inhibition of the PI3K/AKT/mTOR but not the RAS/MEK/MAPK pathway in EGFR-mutant LAD cells. A, cell growth responses at 6 h to 1 μm of indicated inhibitors were measured by trypan blue staining. The cell numbers for HCC827, PC-9, and H1975 cells treated with of DMSO (black), ERLO (red), AZD6244 (blue), BEZ235 (green), AZD9291 (yellow), and PKI-587 (magenta) are shown. The data are shown as the mean ± S.D. (n = 4). B, extracellular lactate production in HCC827, PC-9, and H1975 cell lines treated with DMSO (black), ERLO (red), AZD6244 (blue), BEZ235 (green), AZD9291 (yellow), and PKI-587 (magenta) 6 h after inhibitor treatment. Error bars indicate mean ± S.D. (n = 4–12). *, p < 0.05; **, p < 0.01 versus control by two-tailed Student's t test. C, ECAR values of the HCC827, PC-9, and H1975 cell lines treated with DMSO (black), ERLO (red), AZD6244 (blue), BEZ235 (green), AZD9291 (yellow), and PKI-587 (magenta) after 36 min of flux assay. All cells were treated with the indicated inhibitors (1 μm) for 6 h before each assay. Results are reported as the mean ± S.D. (n = 7–12). **, p < 0.01 versus control by two-tailed Student's t test.
FIGURE 4.
FIGURE 4.
Metabolomic profiling after inhibition of the PI3K/AKT/mTOR pathway. Intracellular concentration (picomoles per million cells) of key metabolites involved in glycolysis and the PPP after the inhibition of EGFR signaling is shown. Error bars indicate mean ± S.D. (n = 3). Total metabolites were extracted with methanol from HCC827, PC9, or H1975 cells treated with DMSO (red) or inhibitors (blue or green) for 6 h. Representative metabolites such as Glc-6-P, 6-phosphogluconate (6-PG), fructose 1,6-bisphosphate (F1,6P), Lac, carbamoyl aspartic acid (carbamoyl-Asp), several amino acids, and ATP are shown. Others are listed in supplemental Table 1. A, flux profiling of 13C-labeled glycolytic and PPP metabolites. H1975 cells were grown in RPMI 1640 medium containing 11.1 mm [U-13C]glucose ([13C]Glc6) for 6 h in the presence of DMSO (red bar) or inhibitors (blue or green bars). Total Glc-6-P, [13C0]Glc-6-P (m+0), [13C6]Glc-6-P (m+6), total 6-PG, [13C0]6-PG (m+0) [13C6]6-PG (m+6), total F1,6P, [13C0]F1,6P (m+0), [13C6]F1,6P (m+6), total Lac, [13C0]Lac (m+0), [13C3]Lac (m+3), total Ala, [13C0]Ala (m+0), [13C3]Ala (m+3), total Asp, [13C0]Asp (m+0), and [13C4]Asp (m+4) are shown. (B) Static intracellular metabolites were quantitatively analyzed in PC-9 and H1975 cells treated with PI3K/mTOR inhibitor using capillary electrophoresis time-of-flight mass spectrometry (CE-TOFMS).
FIGURE 5.
FIGURE 5.
PI3K/AKT/mTOR signaling maintains the membrane localization of GLUT1. A, representative images from immunohistochemistry using GLUT1 antibody to identify cytosolic and membrane staining. Scale bars = 20 μm. B, pie chart summarizes the percentages of EGFR-mutant LAD tissue sections that are negative for GLUT1 protein (blue) or expressing GLUT1 predominantly in the cytoplasm (red) or plasma membrane (green). C, HCC827 cells stained with Alexa Fluor 488 (green, GLUT1), Alexa Fluor 594 (red, Na/K ATPase), and DAPI (blue, nuclei). Na/K ATPase was a positive control as a plasma membrane protein marker. Scale bars = 10 μm.
FIGURE 6.
FIGURE 6.
Inhibition of the PI3K/AKT/mTOR pathway does not affect total GLUT1 protein expression but alters membrane-bound GLUT1 levels in EGFR-mutant LAD cells. A, Western blot analysis showing GLUT1 and β-actin as a loading control in HCC827, PC-9, and H1975 cells treated with the indicated inhibitors. Equivalent amounts of proteins from whole cell lysates were subjected to WB analysis to detect total GLUT1 proteins. For flow cytometric analysis, LAD cells were treated with ERLO (1 μm), BEZ235 (1 μm) or DMSO as a control for 6 h. After fixation, cells were stained with a rabbit anti-GLUT1 antibody and FITC-conjugated anti-rabbit secondary antibody. B—D, representative flow cytometry plots of GLUT1 expression in HCC827 (B), PC-9 (C), and H1975 (D) cells treated with DMSO or BEZ235. E—G, mean fluorescence intensity for GLUT1 for HCC827 (E), PC-9 (F), and H1975 (G) cells. BEZ, BEZ235. Blue bars show background fluorescence with the IgG isotype control, whereas red bars indicate fluorescence staining results with anti-GLUT1 antibody. Error bars indicate mean ± S.D. (n = 3). *, p < 0.05 versus control by two-tailed Student's t test.
FIGURE 7.
FIGURE 7.
Loss of GLUT1 in EGFR-mutant LAD cells decreases cellular proliferation and lactate production. A, Western blot analysis of siGLUT1-treated LAD cells. siRNA targeting GLUT1 (SLC2A1) successfully knocked down GLUT1 protein in PC-9 and H1975 cells, as confirmed by WB. The size signal for GLUT1 was widely distributed from 37–150 kDa. β-actin was used as a loading control for protein level. B, extracellular lactate production in PC-9 and H1975 cell lines transfected with siNC (red), siGLUT1#1 (blue), and siGLUT1#2 (green). C and D, involvement of GLUT1 in cell growth. PC-9 (C) and H1975 (D) cells transfected with GLUT1 siRNAs were incubated for the indicated times. The data are shown as mean ± S.D. (n = 3). *, p < 0.05; **, p < 0.01 (Student's t test).

References

    1. Tsuchihara K. (2013) RET-targeting molecular stratified non-small-cell lung cancers. Transl. Lung Cancer Res. 2, 463–465 - PMC - PubMed
    1. Umemura S., Tsuchihara K., Goto K. (2015) Genomic profiling of small-cell lung cancer: the era of targeted therapies. Jpn. J. Clin. Oncol. 45, 513–519 - PubMed
    1. Gainor J. F., Shaw A. T. (2013) Novel targets in non-small cell lung cancer: ROS1 and RET fusions. Oncologist 18, 865–875 - PMC - PubMed
    1. Hallberg B., Palmer R. H. (2013) Mechanistic insight into ALK receptor tyrosine kinase in human cancer biology. Nat. Rev. Cancer 13, 685–700 - PubMed
    1. Filipits M. (2014) New developments in the treatment of squamous cell lung cancer. Curr. Opin. Oncol. 26, 152–158 - PubMed

Publication types

MeSH terms