

The PFA-AMeX method achieves a good balance between the morphology of tissues and the quality of RNA content in DNA microarray analysis with laser-capture microdissection samples
- PMID: 26023261
- PMCID: PMC4337499
- DOI: 10.1293/tox.2014-0045
The PFA-AMeX method achieves a good balance between the morphology of tissues and the quality of RNA content in DNA microarray analysis with laser-capture microdissection samples
Erratum in
-
Errata (Printer's correction).J Toxicol Pathol. 2016 Jan;29(1):74. Epub 2016 Feb 17. J Toxicol Pathol. 2016. PMID: 26989306 Free PMC article.
Abstract
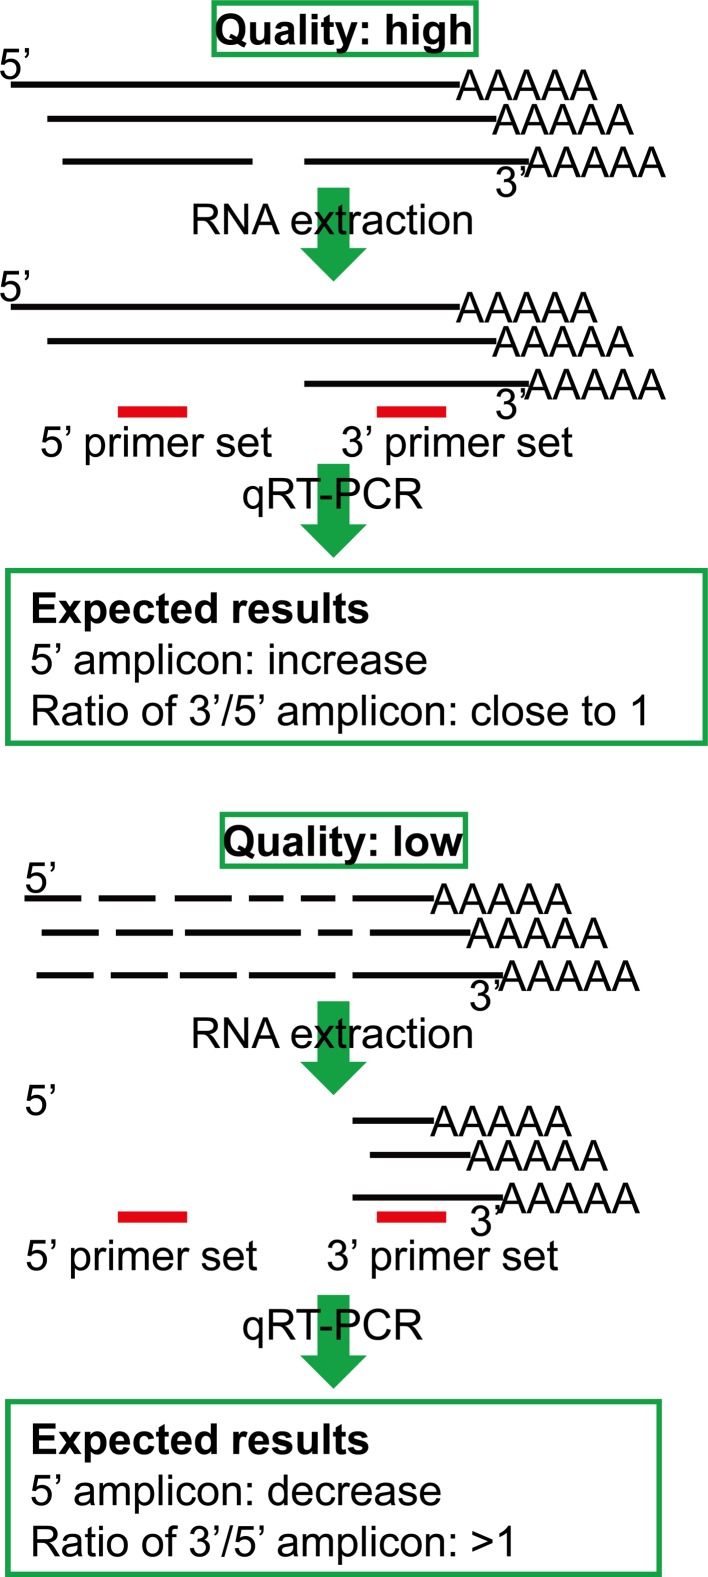
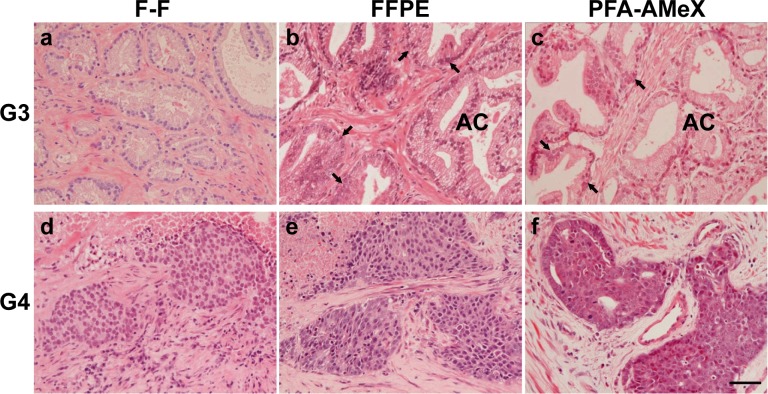
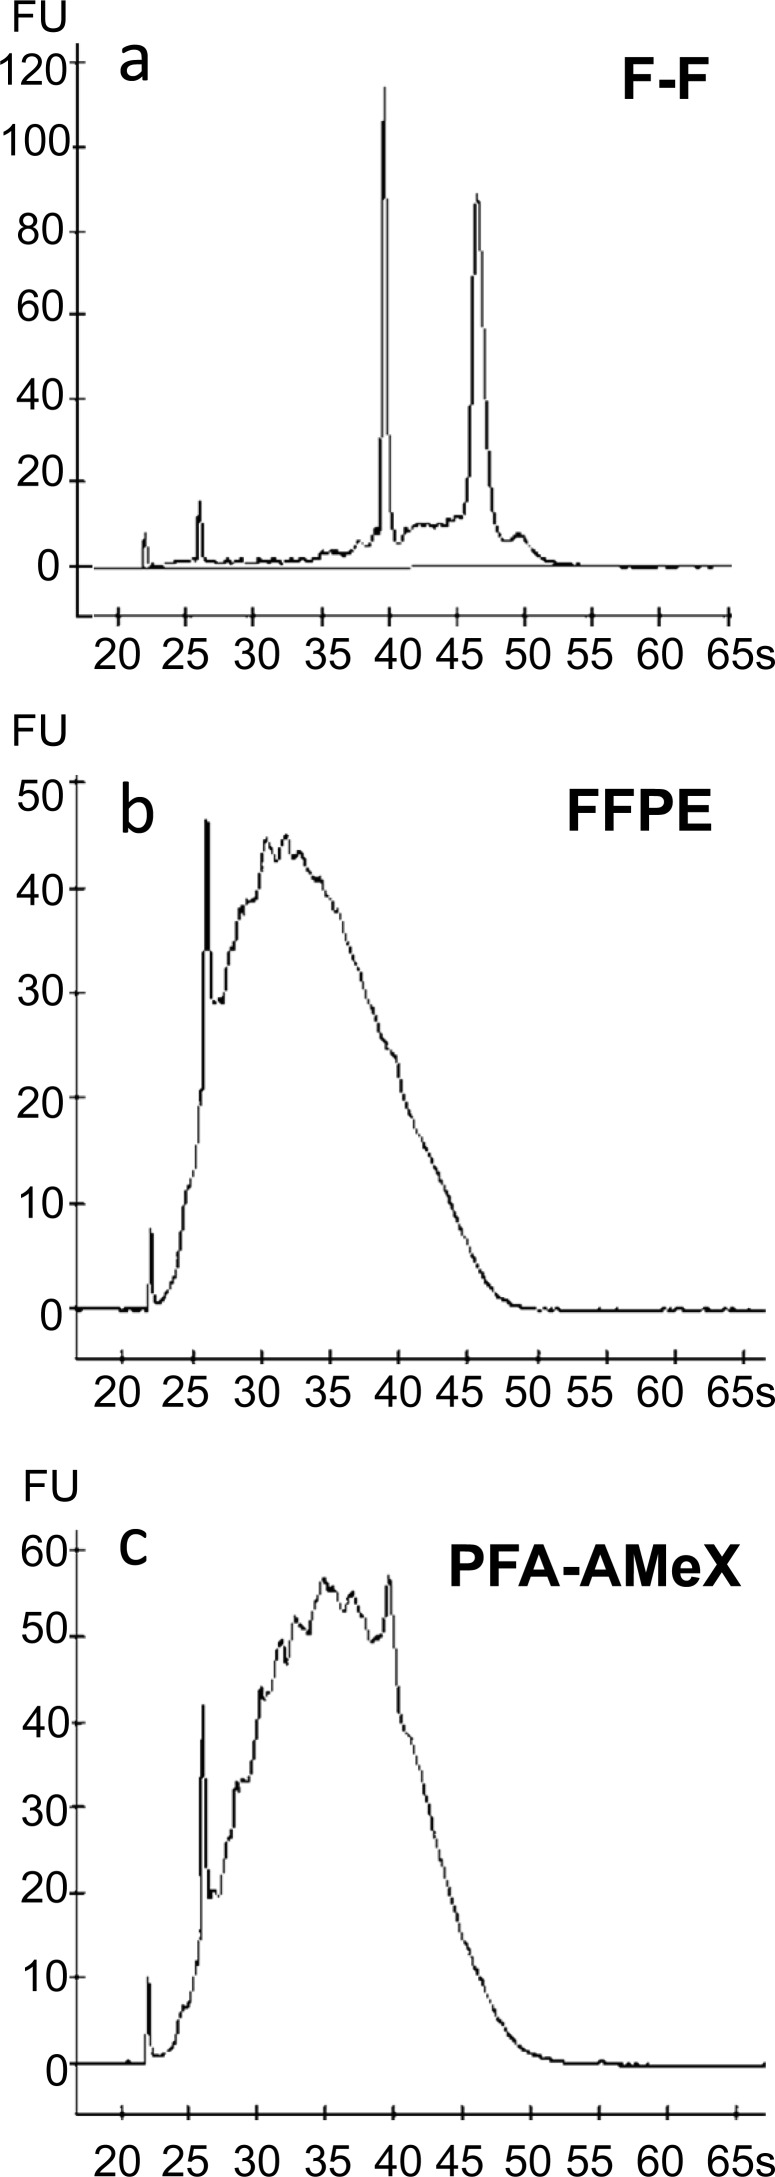
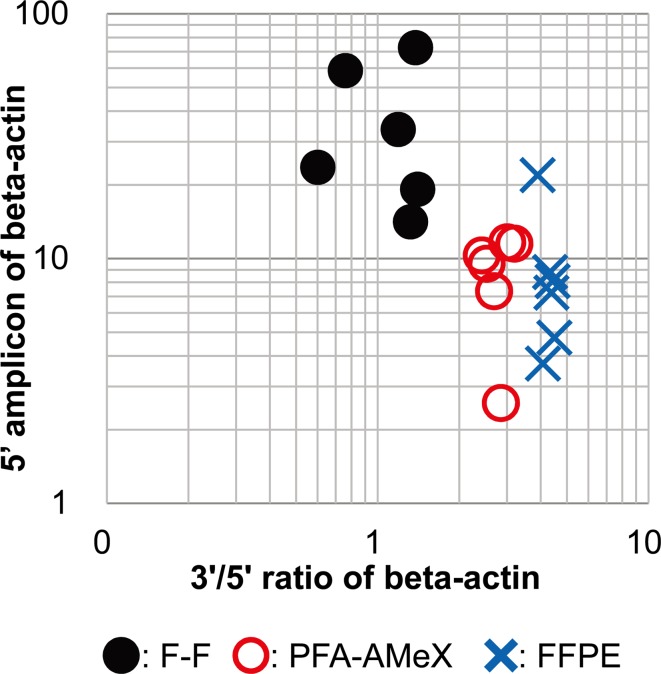
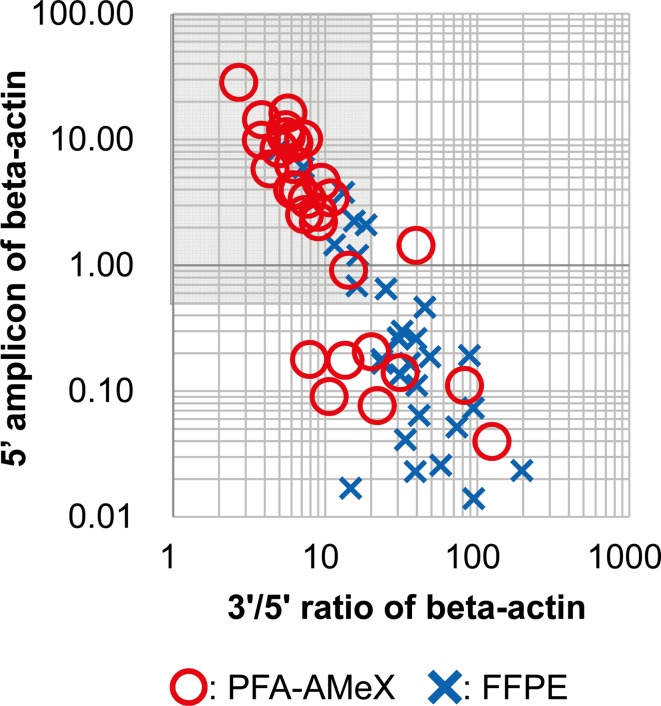
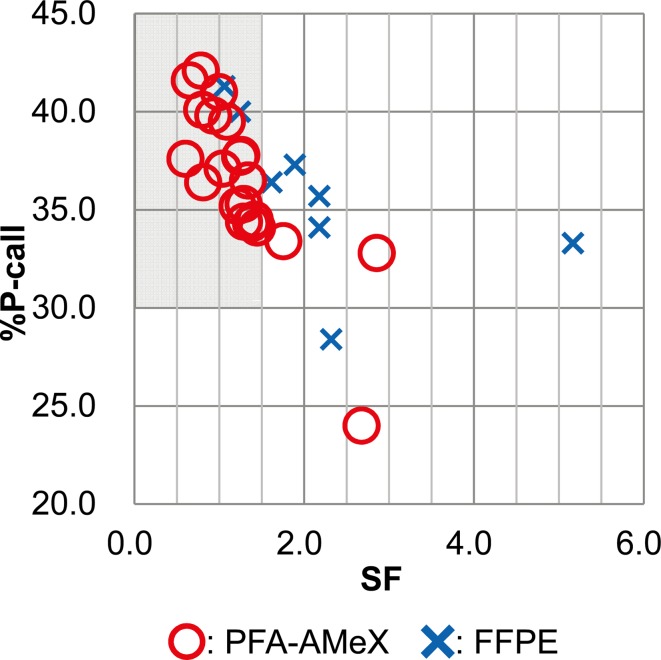
Recently, large-scale gene expression profiling is often performed using RNA extracted from unfixed frozen or formalin-fixed paraffin embedded (FFPE) samples. However, both types of samples have drawbacks in terms of the morphological preservation and RNA quality. In the present study, we investigated 30 human prostate tissues using the PFA-AMeX method (fixation using paraformaldehyde (PFA) followed by embedding in paraffin by AMeX) with a DNA microarray combined with laser-capture microdissection. Morphologically, in contrast to the case of atypical adenomatous hyperplasia, loss of basal cells in prostate adenocarcinomas was as obvious in PFA-AMeX samples as in FFPE samples. As for quality, the loss of rRNA peaks 18S and 28S on the capillary electropherograms from both FFPE and PFA-AMeX samples showed that the RNA was degraded equally during processing. However, qRT-PCR with 3' and 5' primer sets designed against human beta-actin revealed that, although RNA degradation occurred in both methods, it occurred more mildly in the PFA-AMeX samples. In conclusion, the PFA-AMeX method is good with respect to morphology and RNA quality, which makes it a promising tool for DNA microarrays combined with laser-capture microdissection, and if the appropriate RNA quality criteria are used, the capture of credible GeneChip data is well over 80% efficient, at least in human prostate specimens.
Keywords: AMeX method; DNA microarray; PFA; RNA quality; laser-capture microdissection; prostate.
Figures
References
-
- Chibon F. Cancer gene expression signatures - the rise and fall? Eur J Cancer. 49: 2000–2009 2013. - PubMed
-
- Espina V, Wulfkuhle JD, Calvert VS, VanMeter A, Zhou W, Coukos G, Geho DH, Petricoin EF, 3rd , and Liotta LA. Laser-capture microdissection. Nat Protoc. 1: 586–603 2006. - PubMed
-
- Grützmann R, Pilarsky C, Ammerpohl O, Lüttges J, Böhme A, Sipos B, Foerder M, Alldinger I, Jahnke B, Schackert HK, Kalthoff H, Kremer B, Klöppel G, and Saeger HD. Gene expression profiling of microdissected pancreatic ductal carcinomas using high-density DNA microarrays. Neoplasia. 6: 611–622 2004. - PMC - PubMed
-
- Sugiyama Y, Farrow B, Murillo C, Li J, Watanabe H, Sugiyama K, and Evers BM. Analysis of differential gene expression patterns in colon cancer and cancer stroma using microdissected tissues. Gastroenterology. 128: 480–486 2005. - PubMed
-
- Tomlins SA, Mehra R, Rhodes DR, Cao X, Wang L, Dhanasekaran SM, Kalyana-Sundaram S, Wei JT, Rubin MA, Pienta KJ, Shah RB, and Chinnaiyan AM. Integrative molecular concept modeling of prostate cancer progression. Nat Genet. 39: 41–51 2007. - PubMed
LinkOut - more resources
Full Text Sources
Other Literature Sources
Research Materials