. 2015 Mar-Apr;2(2):ENEURO.0001-15.2015.
doi: 10.1523/ENEURO.0001-15.2015.

3D Imaging of Axons in Transparent Spinal Cords from Rodents and Nonhuman Primates

Affiliations

3D Imaging of Axons in Transparent Spinal Cords from Rodents and Nonhuman Primates

Cynthia Soderblom et al. eNeuro. 2015 Mar-Apr.

Abstract

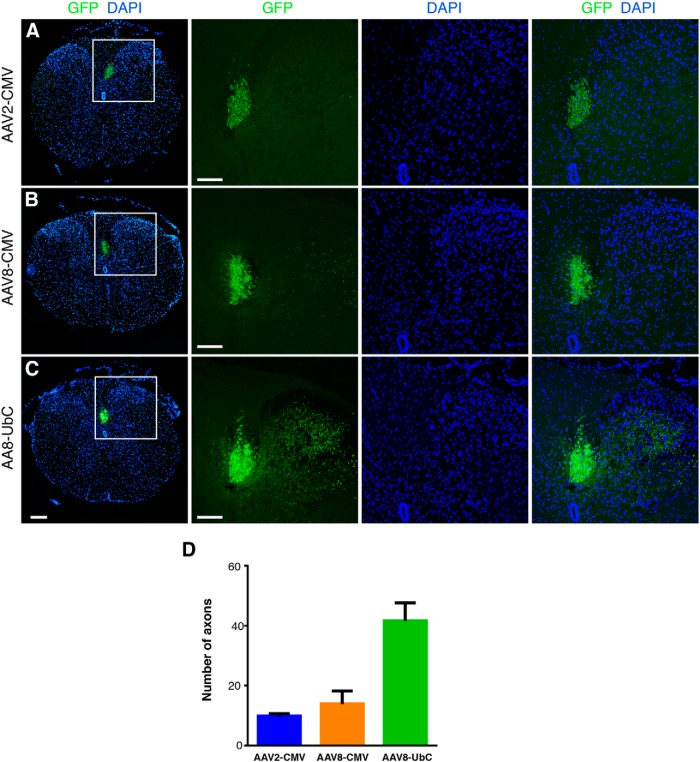
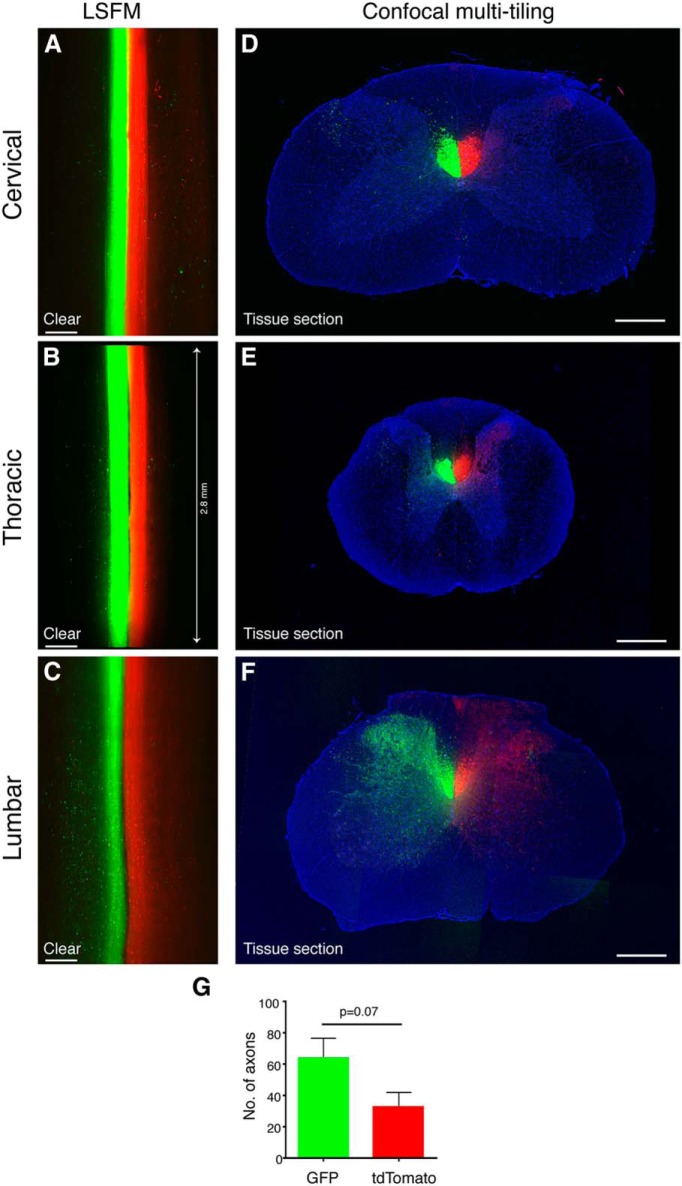
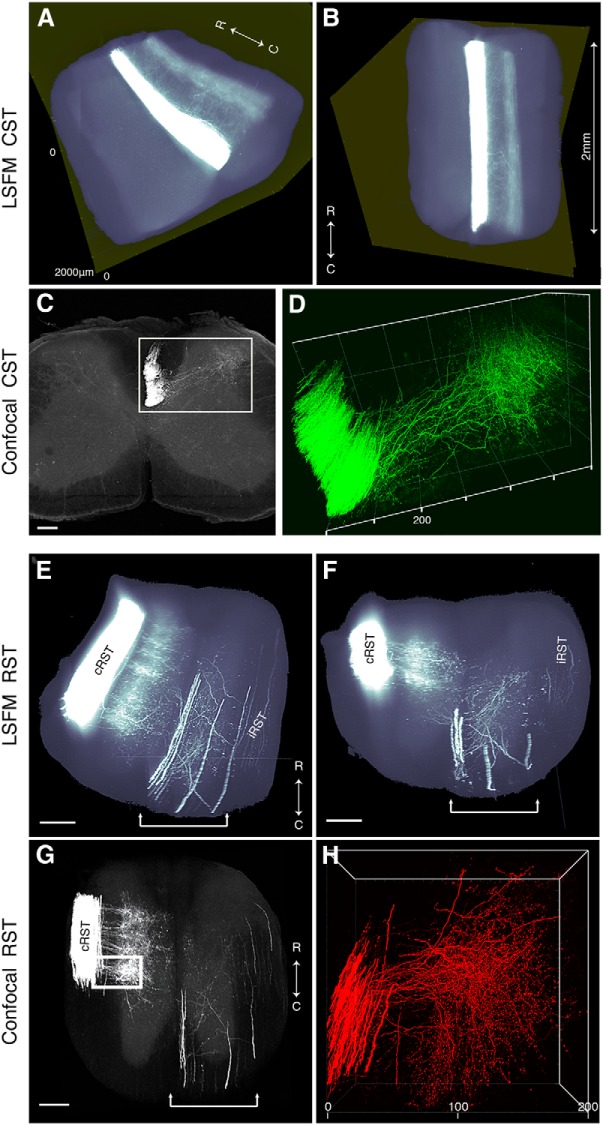
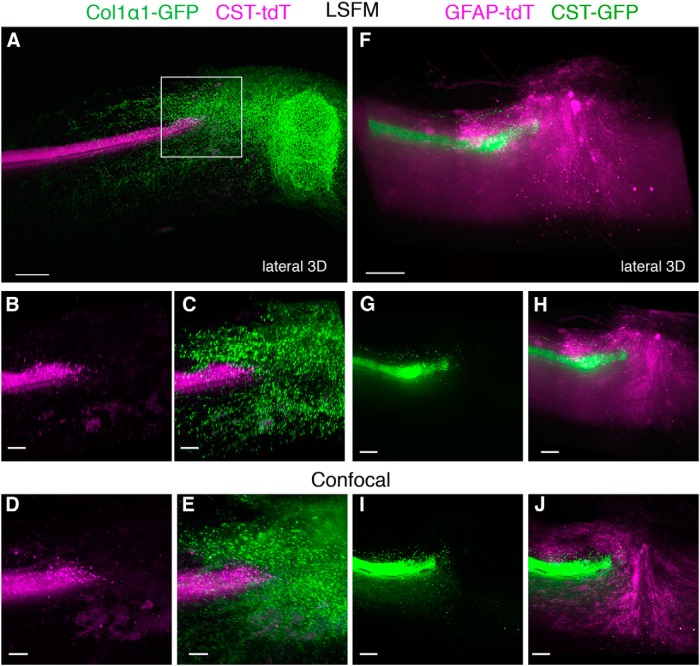
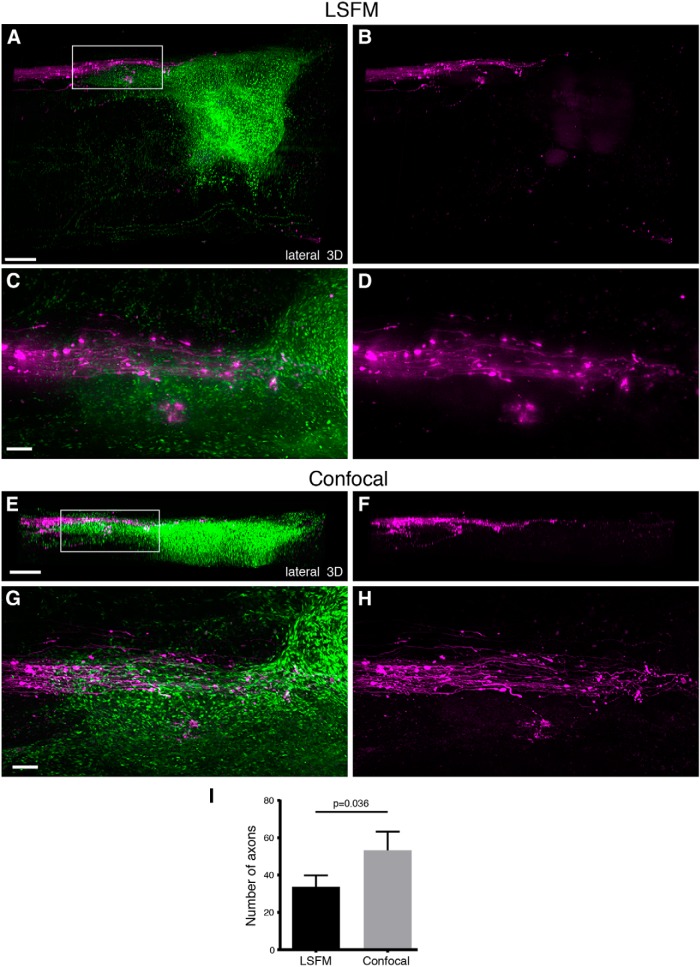
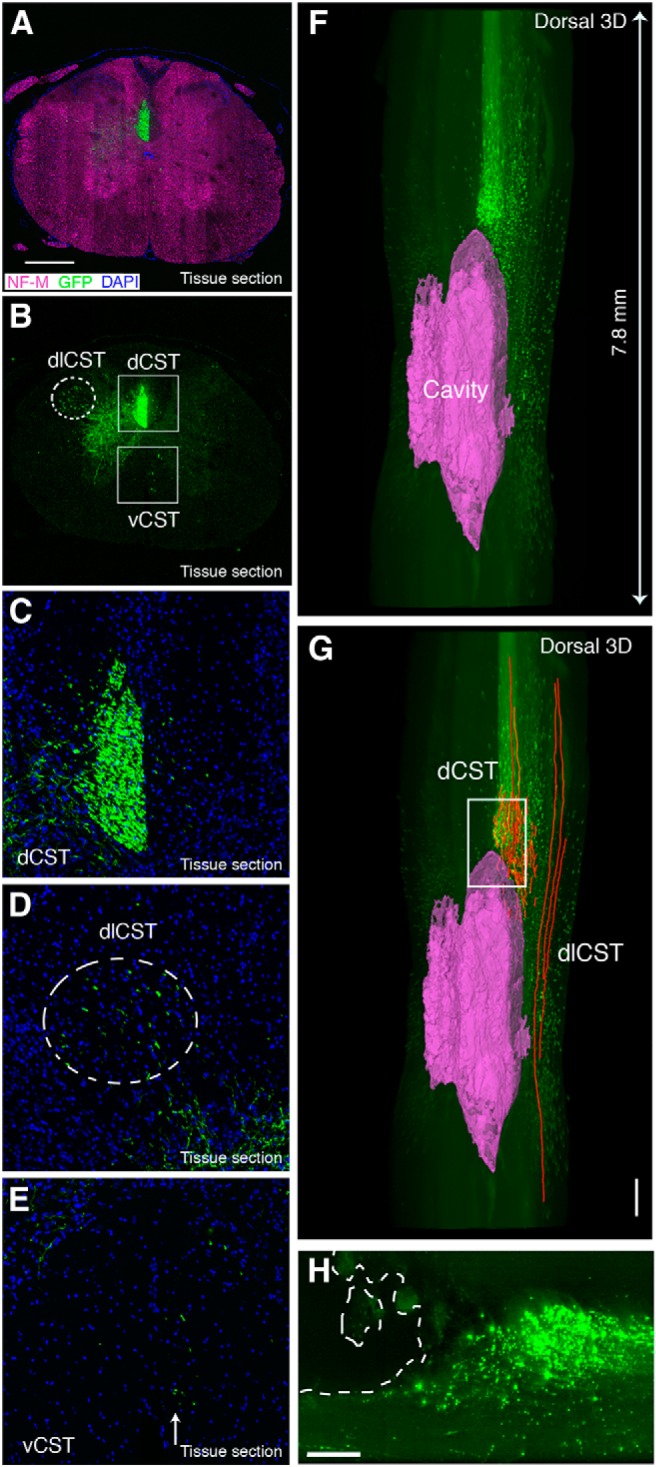
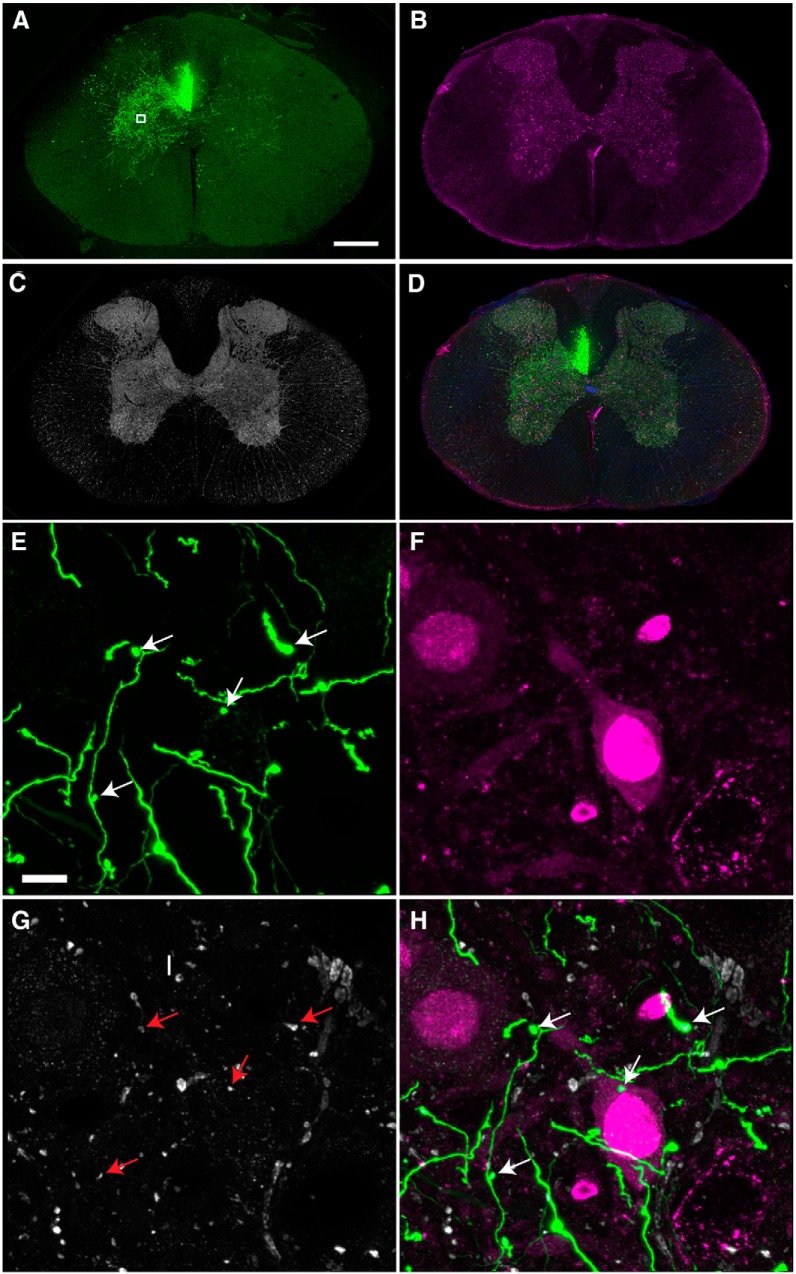
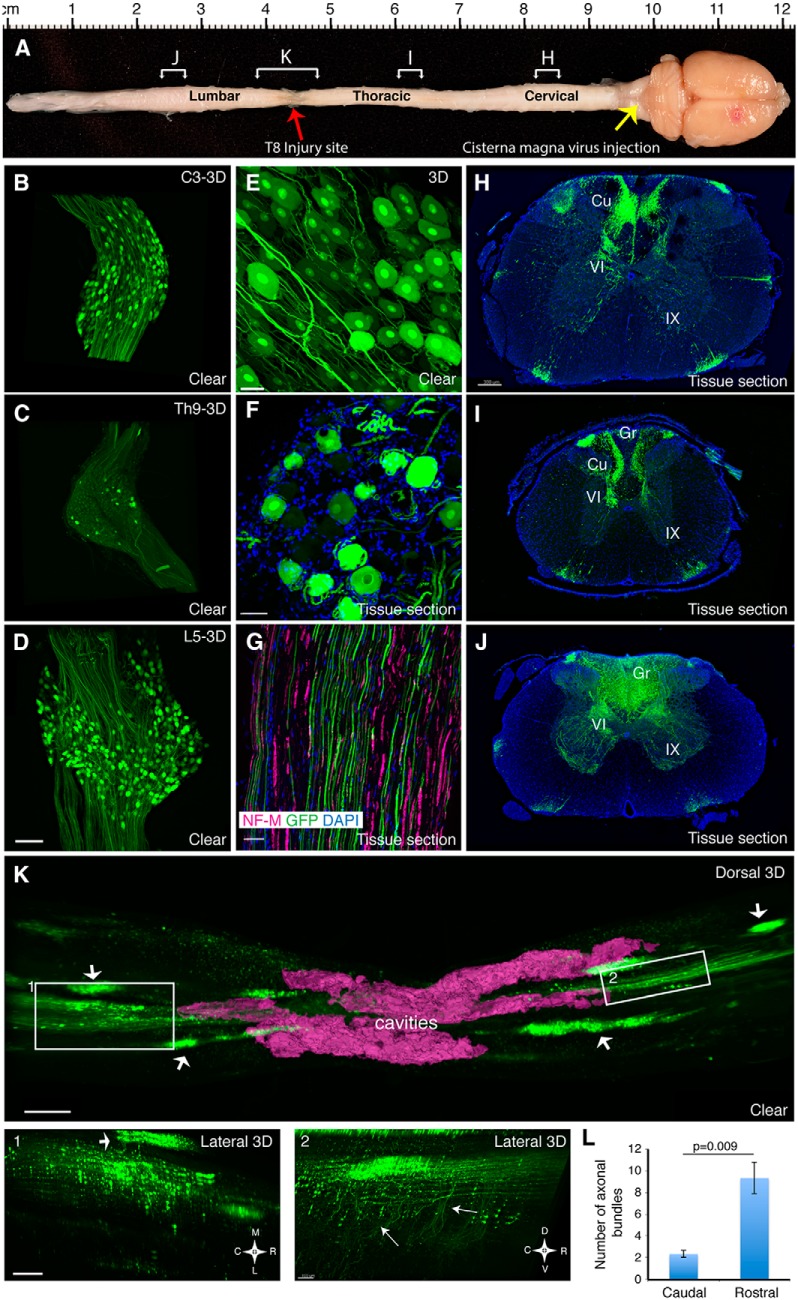
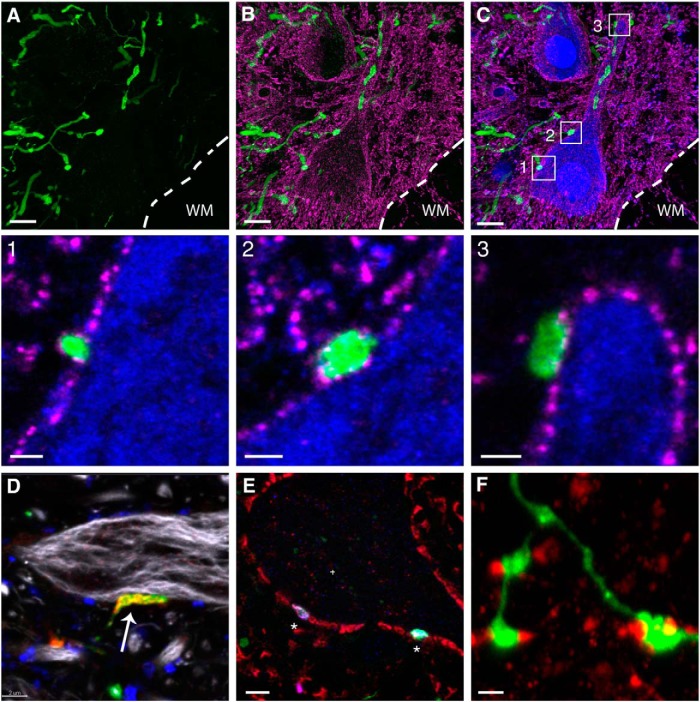
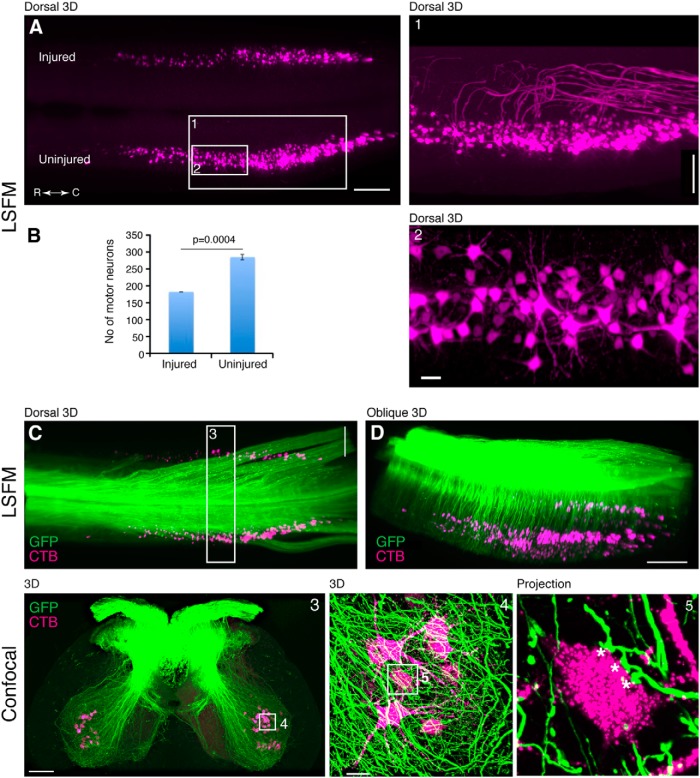
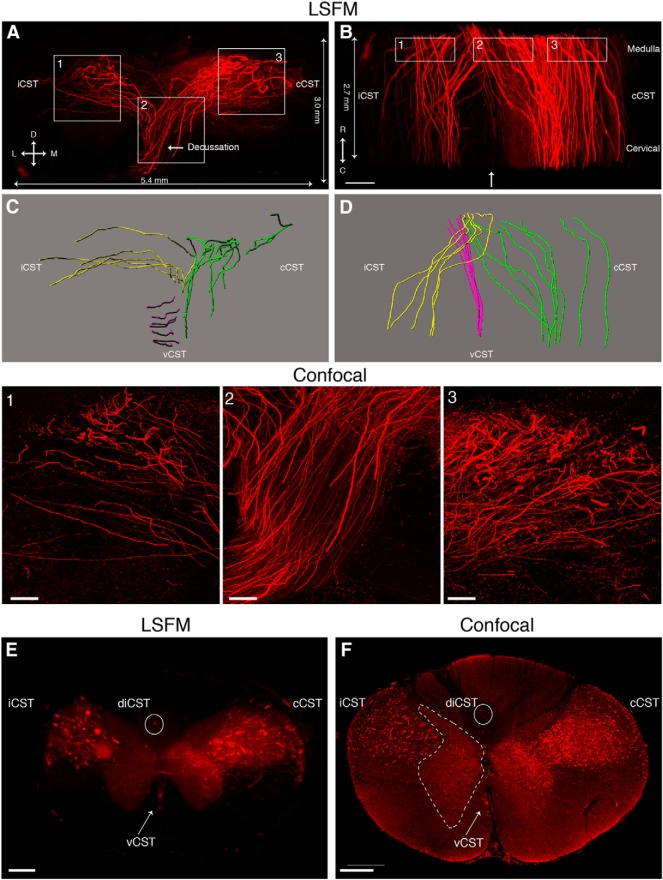
The histological assessment of spinal cord tissue in three dimensions has previously been very time consuming and prone to errors of interpretation. Advances in tissue clearing have significantly improved visualization of fluorescently labelled axons. While recent proof-of-concept studies have been performed with transgenic mice in which axons were prelabeled with GFP, investigating axonal regeneration requires stringent axonal tracing methods as well as the use of animal models in which transgenic axonal labeling is not available. Using rodent models of spinal cord injury, we labeled axon tracts of interest using both adeno-associated virus and chemical tracers and performed tetrahydrofuran-based tissue clearing to image multiple axon types in spinal cords using light sheet and confocal microscopy. Using this approach, we investigated the relationships between axons and scar-forming cells at the injury site as well as connections between sensory axons and motor pools in the spinal cord. In addition, we used these methods to trace axons in nonhuman primates. This reproducible and adaptable virus-based approach can be combined with transgenic mice or with chemical-based tract-tracing methods, providing scientists with flexibility in obtaining axonal trajectory information from transparent tissue.

Keywords: 3DISCO; axon regeneration; spinal cord injury; tissue clearing.


Conflict of interest statement

The authors declare no competing financial interests.

Figures

Figure 1
Figure 1
Comparison of AAV-GFP labeling of the mouse corticospinal tract. A, B, AAV8-CMV-GFP (B) labeled the dorsal CST slightly more efficiently than AAV2-CMV-GFP (A). C, However, AAV8-UbC-GFP labeled the dorsal tract and collaterals most efficiently compared with the other two viruses. DAPI-labeled nuclei are in blue. Insets show higher magnification of the dorsal CST and their collaterals. All images are from coronal tissue sections of mouse thoracic spinal cord 2 weeks postinjection. Scale bars: leftmost panels, 200 μm; all other panels, 100 μm. D, Comparison of number of axons labeled in the gray matter between different viruses. Axons quantified from specific regions of interest as detailed in Materials and Methods. Error bars represent SEM. n = 2 biological replicates per group.
Figure 2
Figure 2
Comparison of AAV8-UbC-GFP and AAV8-UbC-tdTomato labeling of the rat corticospinal tract. A, B, C, Horizontal optical sections of cleared spinal cords from different levels imaged with LSFM. D, E, F, Confocal images of coronal tissue sections of spinal cord regions adjacent to A, B, and C, respectively. G, Quantification of axon collaterals in the gray matter from tissue sections show greater labeling with GFP than tdTomato. Axon quantified from specific regions of interest as detailed in Materials and Methods. Line in B shows the length of the cleared cord. All images are from rat spinal cord at 8 weeks after AAV injection. Error bars represent SEM. p = 0.07 using unpaired two-tailed Student’s t test. n = 3 biological replicates. Scale bars: A−C, 300 μm; D−F, 500 μm.
Figure 3
Figure 3
CST and RST axons can be visualized in cleared mouse spinal cord using AAVs. A, 3D reconstruction from serial LSFM optical sections of a segment of the upper thoracic spinal cord from a mouse injected with AAV8-UbC-GFP into sensorimotor cortex to label CST axons (white; see also Fig. 1). B, Dorsal view of the same 3D reconstruction as in A. C, D, Confocal microscopy, which has higher resolution than LSFM, can better distinguish individual CST axons (see also Movie 1). Boxed area in C is represented in D. E, 3D reconstruction from serial LSFM optical sections of a cleared segment of the upper thoracic spinal cord from a mouse injected with AAV2-UbC-tdTomato into the red nucleus to label RST axons (white). F, Coronal view of the same 3D reconstruction as in A. G, Projection view of coronal image stack taken with confocal microscopy from cleared spinal cord (as shown in E and F). Bracketed regions in E, F, and G refer to non-RST axons that were mislabeled during virus injection. Boxed area in G is shown at higher magnification in H (see also Movie 2). All images are taken from cleared mouse midthoracic spinal cord tissue at 4 weeks after virus injection. Scale bars: C, 80 μm; E−G, 100 μm. n = 3 biological replicates per group. iRST, Ipsilateral RST; cRST, contralateral RST.
Figure 4
Figure 4
AAV-labeled CST axons in relation to the fibrotic and astroglial scar after SCI in mice. A−E, AAV8-UbC-tdTomato was used to label CST axons in Col1α1-GFP mice where fibroblasts are labeled with GFP (n = 3 biological replicates) (see also Movie 3). A−C, At 4 weeks after a contusive SCI, 3D reconstruction of the injury site using LSFM shows the lesioned CST (magenta) terminating at the rostral edge of the fibrotic scar (green). D, E, 3D reconstruction using confocal microscopy shows greater number of CST axons and fibroblasts. F−J, AAV8-UbC-GFP was used to label CST axons in GFAPCreER-tdTomato mice where astrocytes are labeled with tdTomato (see also Movie 4). F−H, At 4 weeks after a dorsal hemisection, 3D reconstruction of the injury site using LSFM showed lesioned CST axons (green) terminating around the astroglial scar (magenta). While the fluorescent signal was not sufficient to clearly identify the astroglial scar using LSFM, confocal microscopy provided much better results (I, J, n = 3 biological replicates). All images are from cleared mouse spinal cord 4 weeks after midthoracic injury and virus injection. Boxed area in A is represented in B−E. Scale bars: A, F, 200 μm; B−E, 50 μm; G−J, 100 μm.
Figure 5
Figure 5
AAV-labeled RST axons in relation to the fibrotic scar after SCI in mice. 3D reconstruction of the injury site using LSFM (A−D) or confocal (E−H) microscopy after using AAV2-UbC-tdTomato to label the RST in Col1α1-GFP mice. Lesioned RST axons (magenta) terminate at the rostral edge of the fibrotic scar (green) at 4 weeks after contusive SCI. While confocal microscopy could not image through the entire depth of the spinal cord due to the limited working distance of the 10× objective (A vs E), the visualization of individual axons was much better (D vs H) than with LSFM, as indicated by the quantification of the number of axons that could be detected by the two imaging methods (I). The axons were counted from a region of interest that included the entire CST bundle in 3D as shown in D and H. p = 0.036 using paired two-tailed Student’s t test. All images are from cleared mouse spinal cord injury site. Boxed area in A is represented in C and D. Boxed area in E is represented in G and H. Scale bars, 100 μm. n = 5 biological replicates. See also Movie 5.
Figure 6
Figure 6
AAV-labeled CST axons in relation to the cavity after SCI in rats. A−E, Confocal images of coronal tissue sections from the upper thoracic segments (rostral to the injury site) after using AAV8-UbC-GFP to label CST in rats. All CSTs including the main dorsal CST (dCST; B, C), the minor dorsolateral CST (dlCST; B, D), and the ventral CST (vCST; B, E) were labeled with this method. F−H, 3D reconstruction of LSFM images from cleared injured spinal cord (dorsal view) showing the lesioned CST terminating at the rostral portion of the cavity (magenta) (see also Movie 6). Axon tracing (G, red lines) shows spared dlCST next to the cavity. Cavity reconstruction and axon tracing were performed using Imaris software. H is a maximum projection image of 15 LSFM optical sections from the boxed area in G, depicting the cavity in the outlined region. All images are from rat spinal cord 8-9 weeks after AAV injection and spinal cord injury. Scale bars: A, G, 500 μm; H, 200 μm. n = 4 biological replicates.
Figure 7
Figure 7
Rat CST terminals labeled with AAV express vGlut1. A−D, Coronal tissue sections of rat thoracic spinal cord immunostained with NeuN in magenta and vGlut1 in gray. GFP-positive CST axons can be seen sprouting into the contralateral and ipsilateral gray matter. A, B, and C are merged in D. E, F, High magnification view from lamina 6 (boxed region in A) shows colocalization of vGlut1 and GFP terminals (indicated by arrows). All images are from tissue sections from rat spinal cord. Scale bars: A−D, 400 μm; EH, 5 μm. n = 3 biological replicates.
Figure 8
Figure 8
AAV-labeled Ia afferent axons after SCI in rats. A, Adult rat CNS with injured spinal cord at T8 (red arrow) showing the site of virus injection (yellow arrow) and the regions from where the images in H−K were taken (brackets with corresponding letters). B−D, 3D reconstruction of confocal images from cleared DRG at C3, T9, and L5 levels labelled with AAV8-UbC-GFP. Confocal images of labeled neurons and their axon projections show similar quality between whole cleared DRG (E) and DRG tissue sections (F). Tissue sections from the cervical (H), thoracic (I), and lumbar (J) spinal cord as well from L5 nerve (G) show that this method labels both the central and peripheral branches of the DRG (see also Movie 7). 3D reconstruction of LSFM images from the cleared injury site (K, dorsal view) shows the caudal (left, box 1) and rostral (right, box 2) portions of the lesioned ascending sensory axons disrupted by the injury site as outlined by the cavity (magenta, see also Movie 8). Arrows in K indicate dorsal roots that are still attached to the spinal cord. Arrows in inset 2 indicate afferent collaterals that are present in greater numbers in the rostral regions compared to caudal regions (inset 1). This is quantified in L, which displays the number of axon bundles emanating from the dorsal columns in a similar region of interest drawn rostral and caudal to the injury site in 3D reconstructions. Error bars represent SEM. p = 0.009 using unpaired two-tailed Student’s t test. All images are from rat spinal cord 8-9 weeks after AAV injection and SCI. Scale bars: B−D, 200 μm; E, 40 μm; F, 50 μm; G, 10 μm; H−J, 300 μm; K, 500 μm; Insets 1, 2, 100 μm. Gr, gracile; Cu, cuneate; VI and IX indicate the Rexed laminae.
Figure 9
Figure 9
AAV-labeled Ia afferent terminals in rat spinal cord gray matter express vGlut1. A−C, Confocal images of rat spinal cord tissue sections (lamina IX) with GFP-labeled Ia afferents (A) immunostained with NeuN (blue) and the presynaptic marker bassoon (magenta). C is the merged image of A and B. Insets 1-3 are high-magnification images of corresponding regions depicted in C. D, GFP terminals adjacent to NF-M-positive (gray) axon express vGlut1 (red) but not vGlut2 (blue), indicating their sensory origin. E, GFP terminals express the presynaptic marker SV2 (red) and vGlut1 (blue), indicating their proprioceptive origin. Left asterisk denotes overlapping SV2 and vGlut1, while right asterisk has SV2, vGlut1, and GFP overlapping. F, GAD65 boutons make contacts with GFP terminals, indicating axo-axonic contacts from interneurons onto sensory axons. All images are confocal images of rat spinal cord tissues sections 8-9 weeks after AAV8-UbC-GFP injection. Scale bars: AC, E, 10 μm; Insets 1-3, 1 μm; D, 2 μm; F, 3 μm. n = 4 biological replicates.
Figure 10
Figure 10
AAV-labeled Ia sensory afferents innervating CTB-labeled rat gastrocnemius motor pool targets. A, 3D reconstruction of LSFM images from rat lumbar spinal cord with gastrocnemius motor pool retrogradely labeled with CTB. Inset 1 is a magnified view with the motor axons highlighted using a filtering mask. Inset 2 is a magnified view showing the motoneuron soma and dendrites. The difference in motoneuron number between the two sides is due to the unilateral lumbar SCI is quantified in B. C, D, 3D reconstruction in A shown together with GFP-labeled sensory axons (also see Movie 9). Inset 3, Confocal transverse images of a cleared spinal cord segment outlined in C. Inset 4 depicts a network of axons and their terminals surrounding CTB-labeled motoneurons. Inset 5 is a projection of 15 confocal optical sections showing three “en passant” boutons (asterisks) on a single motoneuron (see also Movie 10). All cords were examined 8-9 weeks after the AAV injection. All images are from cleared spinal cord from the same animal. Scale bars: A, 500 μm; C, 500 μm; D, 700 μm; Inset 1, 300 μm; Inset 2, 50 μm; Inset 3, 200 μm; Inset 4, 30 μm. n = 3 biological replicates.
Figure 11
Figure 11
3D visualization of fluoro-Ruby-labeled CST axons in cleared nonhuman primate spinal cord. A, B, 3D reconstruction of LSFM images showing fluoro-Ruby-labeled CST axons at the level of the pyramidal decussation in cleared nonhuman primate tissue (see also Movie 11). Lines on the edges indicate the length of the cleared specimen imaged by LSFM. Actual thickness of the cleared tissue was 5 mm. Insets 1, 2, and 3 are confocal images of the same cleared tissue taken from corresponding regions depicted in A and B. The confocal scans are ∼400 μm in depth and taken from the rostral side of the tissue. C, D, Axon tracings from A and B, respectively, showing the iCST (ipsilateral CST, yellow), cCST (contralateral CST, green), and vCST (ventral CST, magenta). Images are slightly tilted to reveal the projections better and do not represent the exact orientation of images in A and B. E, F, Coronal views from LSFM (C2 level in E) and confocal (C1 level in F) images show the main contralateral (cCST) and ipsilateral (iCST) CST in the dorsolateral white matter as well as the minor ventral CST (vCST, arrow) in the ventromedial white matter. Note the presence of two CST axons in the ipsilateral dorsal column (diCST, circle). The gray matter in F is delineated with dashed lines. All images are from cleared nonhuman primate tissue injected with fluoro-Ruby. L, Lateral; M, medial; D, dorsal; V, ventral; R, rostral; C, caudal. Scale bars: A, B, E, F, 600 μm; insets 1-3, 150 μm. n = 1.

References

    1. Arenkiel BR, Hasegawa H, Yi JJ, Larsen RS, Wallace ML, Philpot BD, Wang F, Ehlers MD (2011) Activity-induced remodeling of olfactory bulb microcircuits revealed by monosynaptic tracing. PloS One 6:e29423. 10.1371/journal.pone.0029423 - DOI - PMC - PubMed
    1. Ayuso E, Mingozzi F, Montane J, Leon X, Anguela XM, Haurigot V, Edmonson SA, Africa L, Zhou S, High KA, Bosch F, Wright JF (2010) High AAV vector purity results in serotype- and tissue-independent enhancement of transduction efficiency. Gene Ther 17:503-510. 10.1038/gt.2009.157 - DOI - PubMed
    1. Becker K, Jährling N, Saghafi S, Weiler R, Dodt HU (2012) Chemical clearing and dehydration of GFP expressing mouse brains. PLoS One 7:e33916. 10.1371/journal.pone.0033916 - DOI - PMC - PubMed
    1. Belle M, Godefroy D, Dominici C, Heitz-Marchaland C, Zelina P, Hellal F, Bradke F, Chédotal A (2014) A simple method for 3D analysis of immunolabeled axonal tracts in a transparent nervous system. Cell Rep 9:1191-1201. 10.1016/j.celrep.2014.10.037 - DOI - PubMed
    1. Blits B, Derks S, Twisk J, Ehlert E, Prins J, Verhaagen J (2010) Adeno-associated viral vector (AAV)-mediated gene transfer in the red nucleus of the adult rat brain: comparative analysis of the transduction properties of seven AAV serotypes and lentiviral vectors. J Neurosci Methods 185:257-263. 10.1016/j.jneumeth.2009.10.009 - DOI - PubMed

LinkOut - more resources