. 2015 Dec;9(12):2605-19.
doi: 10.1038/ismej.2015.72. Epub 2015 May 29.

Meta-omics uncover temporal regulation of pathways across oral microbiome genera during in vitro sugar metabolism

Affiliations

Meta-omics uncover temporal regulation of pathways across oral microbiome genera during in vitro sugar metabolism

Anna Edlund et al. ISME J. 2015 Dec.

Abstract

Dental caries, one of the most globally widespread infectious diseases, is intimately linked to pH dynamics. In supragingival plaque, after the addition of a carbohydrate source, bacterial metabolism decreases the pH which then subsequently recovers. Molecular mechanisms supporting this important homeostasis are poorly characterized in part due to the fact that there are hundreds of active species in dental plaque. Only a few mechanisms (for example, lactate fermentation, the arginine deiminase system) have been identified and studied in detail. Here, we conducted what is to our knowledge, the first full transcriptome and metabolome analysis of a diverse oral plaque community by using a functionally and taxonomically robust in vitro model system greater than 100 species. Differential gene expression analyses from the complete transcriptome of 14 key community members revealed highly varied regulation of both known and previously unassociated pH-neutralizing pathways as a response to the pH drop. Unique expression and metabolite signatures from 400 detected metabolites were found for each stage along the pH curve suggesting it may be possible to define healthy and diseased states of activity. Importantly, for the maintenance of healthy plaque pH, gene transcription activity of known and previously unrecognized pH-neutralizing pathways was associated with the genera Lactobacillus, Veillonella and Streptococcus during the pH recovery phase. Our in vitro study provides a baseline for defining healthy and disease-like states and highlights the power of moving beyond single and dual species applications to capture key players and their orchestrated metabolic activities within a complex human oral microbiome model.


Conflict of interest statement

The authors declare that Dr W Shi is a part time Chief Science Officer of C3 Jian Inc., which has licensed technologies from UC Regents that could be indirectly related to this research project. The other authors declare no conflict of interest.

Figures
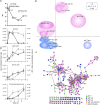
Figure 1
Figure 1
Primary metabolite and small molecule fingerprints are discernable temporally and cluster by environment. (a) Dynamic changes of extracellular pH and 133 metabolites with annotations in reference libraries. Metabolite measurements derive from both extracellular (open triangles) and intracelular (open circles) fractions before and after a glucose pulse. (b) Similarities between metabolite profiles obtained by gas chromatography-mass spectrometry (GCMS) from the extracellular (ext) and intracellular (int) biofilm environments at the different pH stages were analyzed with correspondence analyses (CA). The first ordination axis explains 53% of the variation of the data set and the second ordination axis explains 32% of the variation. Six replicate samples (depicted as small black squares in ordination diagram) from GCMS analyses were included to represent each environment and pH stage. (c) Tandem mass spectrometry (MS/MS) network of secreted mall molecules from biofilms at pH stages 7, 4.2 and 5.2. Molecular networks were obtained by spectral alignment as described in Watrous et al. (2012). Molecules with no structural homologues were included as singletons in the lower section of the network. The network comparison is based upon the similarity cosine scoring of MS/MS spectra and the visualization of those relationships. A single chemical species is represented as a colored node and the relatedness between spectra are represented as edges.
Figure 2
Figure 2
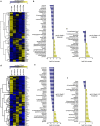
Global metabolite profiles reflect temporal changes within extra- and intracellular biofilm fractions. (a and d) Hierarchical cluster analyses of metabolites obtained from (a) intracellular extracts of biofilms across different pH stages and (d) supernatant (extracellular) extracts of biofilms across different pH stages by gas chromatography-mass spectrometry. Peak height data for each identified compound within each row were normalized using the z-score. Yellow indicates high relative metabolite concentrations (z-score values ⩾2); blue indicate low relative metabolite concentrations (z-score values ⩽2); black indicate the median z-score values. (a and d) Metabolites showing significant fold change comparisons between pH stages (Fold change <log2 or >log2). (b) Relative metabolite differences of the intracellular environment between the lowest pH stage (pH 4.2) and neutral pH (prior to glucose amendment). (c) Relative supernatant differences between the lowest pH stage and the recovery stage (pH 5.2) representing intracellular metabolites changing during the pH recovery phase. (e) Relative differences in metabolites from the extracellular environment between the lowest pH stage (pH 4.2) and neutral pH (prior to glucose amendment). (f) Relative differences in metabolites from the extracellular environment between the lowest pH stage and the recovery stage (pH 5.2).
Figure 3
Figure 3
Key species responses at mRNA read level and KEGG-Orthology (KO) level in reaction to glucose amendment followed by a drastic pH drop. (a) Normalized mRNA read counts that mapped to reference genomes at the different pH stages. (b) mRNA reads that mapped to coding DNA sequences of reference genomes could be classified by using the KO system to a high extent (Supplementary Dataset S1). Differential expression was calculated between pH 4.2 and 7 for each KO group and genome. Hierarchical cluster analyses grouped reference genomes together according to similarities in up- (yellow) and down-expression (blue) of KO groups. Shared KO groups across this set of genomes that showed no changes in expression are indicated in grey.
Figure 4
Figure 4
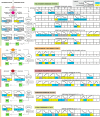
Gene transcription activity and metabolite fluxes associated with alkali-generating pathways at different pH stages within the in vitro biofilm. Relative metabolite abundance was determined by using gas chromatography-mass spectrometry of intracellular biofilm extracts and growth media of biofilms (extracellular growth extracts). Differential transcription activity of key enzymes at the different pH stages in alkali-generating pathways, representative of different community members was determined by mapping of mRNA reads to reference genomes. Reference genomes correspond to the species that recruited the most mRNA reads and represent; S. salivarius (SS), S. thermophilus (ST), S. vestibularis (SV), S. mitis (SM), S. parasanguinis (SP), Streptococcus sp. C-150 (SC), L. fermentum (LF), Fusobacterium sp., V. atypica (VA) and Klebsiella sp (KM). Significant transcription activities were identified for the ADS, the urease enzyme, the glutamate dehydrogenase enzyme and the threonine and serine deaminase enzymes. Transcription activity of associated metabolite transporters was also determined. −, no transcription activity was detected.

References

    1. Alaluusua S, Kleemola-Kujala E, Nystrom M, Evalahti M, Gronroos L. (1987). Caries in the primary teeth and salivary Streptococcus mutans and lactobacillus levels as indicators of caries in permanent teeth. Pediatr Dent 9: 126–130. - PubMed
    1. Anders S, Huber W. (2010). Differential expression analysis for sequence count data. Genome Biol 11: R106. - PMC - PubMed
    1. Andrade SL, Einsle O. (2007). The Amt/Mep/Rh family of ammonium transport proteins. Mol Membr Biol 24: 357–365. - PubMed
    1. Arneberg P, Giertsen E, Emberland H, Ogaard B. (1997). Intra-oral variations in total plaque fluoride related to plaque pH. A study in orthodontic patients. Caries Res 31: 451–456. - PubMed
    1. Bender GR, Sutton SV, Marquis RE. (1986). Acid tolerance, proton permeabilities, and membrane ATPases of oral streptococci. Infect Immun 53: 331–338. - PMC - PubMed

Publication types

Associated data