

High-fat diet induces hepatic insulin resistance and impairment of synaptic plasticity
- PMID: 26023930
- PMCID: PMC4449222
- DOI: 10.1371/journal.pone.0128274
High-fat diet induces hepatic insulin resistance and impairment of synaptic plasticity
Abstract
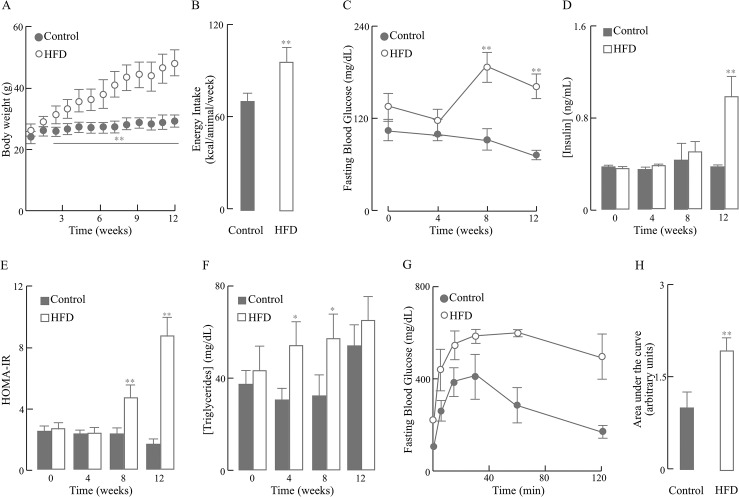
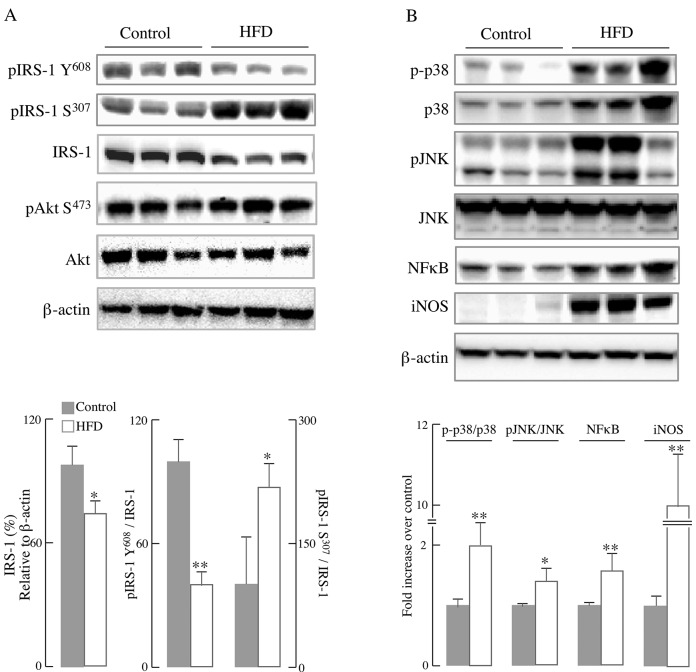
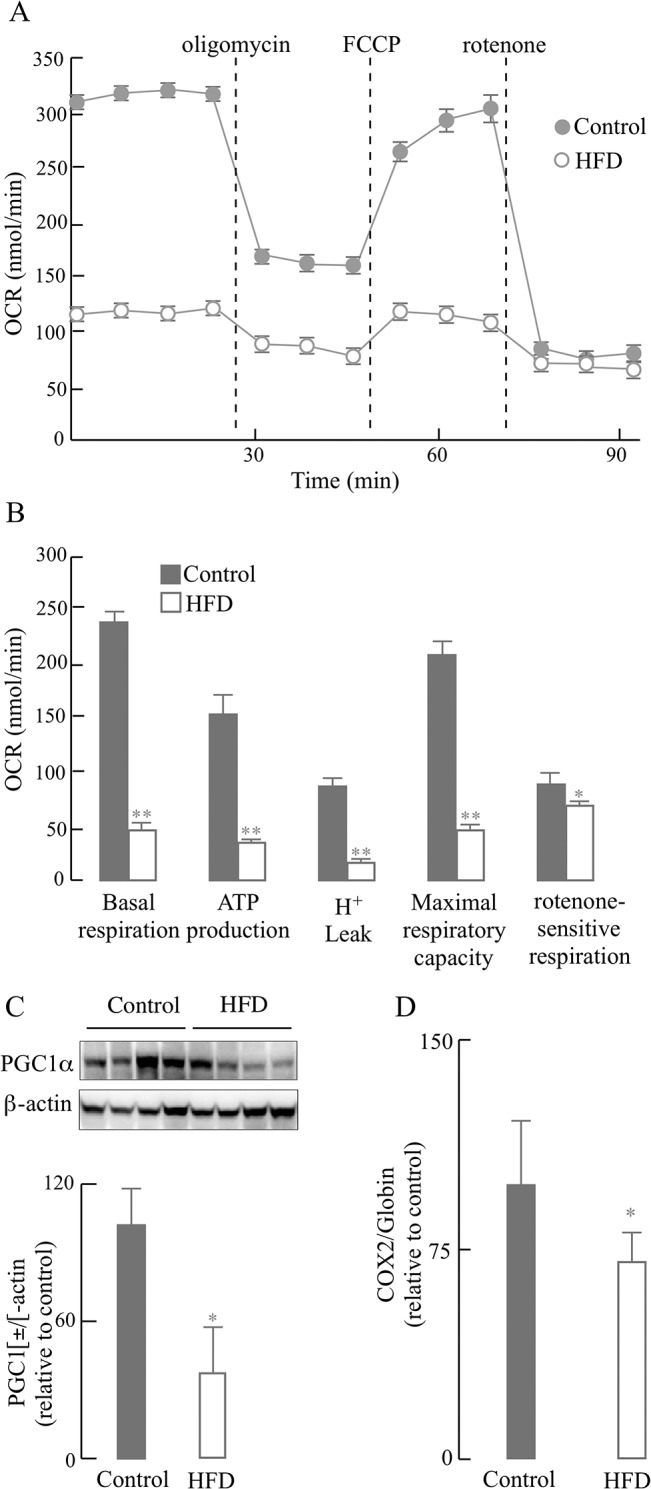
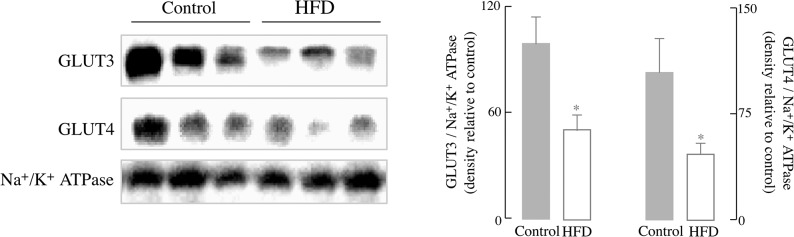
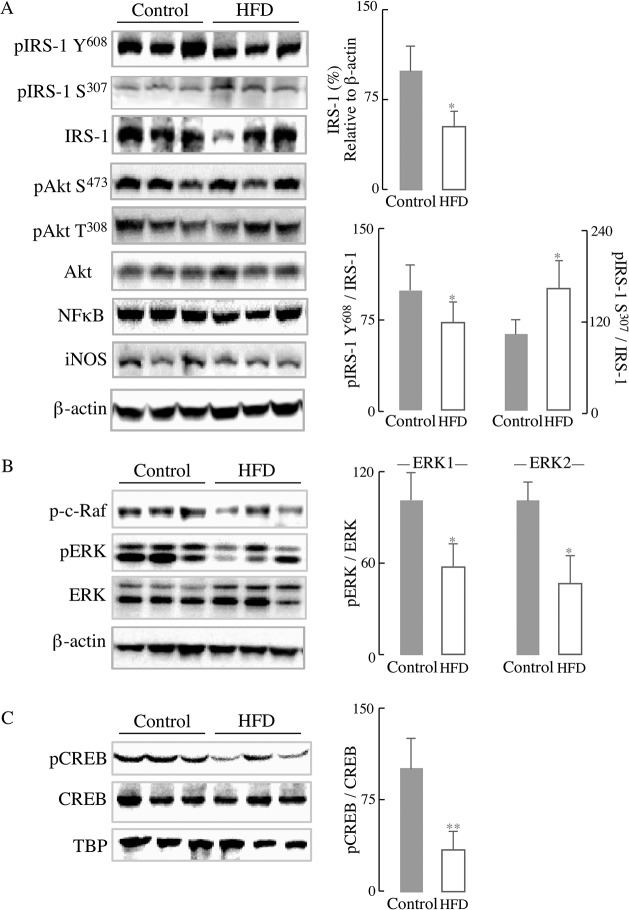
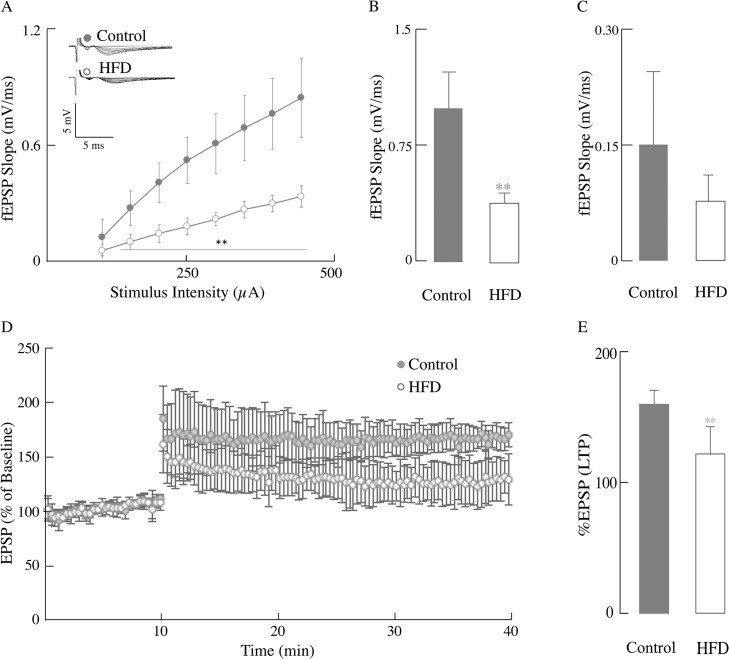
High-fat diet (HFD)-induced obesity is associated with insulin resistance, which may affect brain synaptic plasticity through impairment of insulin-sensitive processes underlying neuronal survival, learning, and memory. The experimental model consisted of 3 month-old C57BL/6J mice fed either a normal chow diet (control group) or a HFD (60% of calorie from fat; HFD group) for 12 weeks. This model was characterized as a function of time in terms of body weight, fasting blood glucose and insulin levels, HOMA-IR values, and plasma triglycerides. IRS-1/Akt pathway was assessed in primary hepatocytes and brain homogenates. The effect of HFD in brain was assessed by electrophysiology, input/output responses and long-term potentiation. HFD-fed mice exhibited a significant increase in body weight, higher fasting glucose- and insulin levels in plasma, lower glucose tolerance, and higher HOMA-IR values. In liver, HFD elicited (a) a significant decrease of insulin receptor substrate (IRS-1) phosphorylation on Tyr608 and increase of Ser307 phosphorylation, indicative of IRS-1 inactivation; (b) these changes were accompanied by inflammatory responses in terms of increases in the expression of NFκB and iNOS and activation of the MAP kinases p38 and JNK; (c) primary hepatocytes from mice fed a HFD showed decreased cellular oxygen consumption rates (indicative of mitochondrial functional impairment); this can be ascribed partly to a decreased expression of PGC1α and mitochondrial biogenesis. In brain, HFD feeding elicited (a) an inactivation of the IRS-1 and, consequentially, (b) a decreased expression and plasma membrane localization of the insulin-sensitive neuronal glucose transporters GLUT3/GLUT4; (c) a suppression of the ERK/CREB pathway, and (d) a substantial decrease in long-term potentiation in the CA1 region of hippocampus (indicative of impaired synaptic plasticity). It may be surmised that 12 weeks fed with HFD induce a systemic insulin resistance that impacts profoundly on brain activity, i.e., synaptic plasticity.
Conflict of interest statement
Figures
Similar articles
-
Effects of Lipoic Acid on High-Fat Diet-Induced Alteration of Synaptic Plasticity and Brain Glucose Metabolism: A PET/CT and 13C-NMR Study.Sci Rep. 2017 Jul 14;7(1):5391. doi: 10.1038/s41598-017-05217-z. Sci Rep. 2017. PMID: 28710347 Free PMC article.
-
Ursolic acid and rosiglitazone combination improves insulin sensitivity by increasing the skeletal muscle insulin-stimulated IRS-1 tyrosine phosphorylation in high-fat diet-fed C57BL/6J mice.J Physiol Biochem. 2016 Jun;72(2):345-52. doi: 10.1007/s13105-016-0484-6. Epub 2016 Apr 18. J Physiol Biochem. 2016. PMID: 27090933
-
Paraoxonase1 (PON1) reduces insulin resistance in mice fed a high-fat diet, and promotes GLUT4 overexpression in myocytes, via the IRS-1/Akt pathway.Atherosclerosis. 2013 Jul;229(1):71-8. doi: 10.1016/j.atherosclerosis.2013.03.028. Epub 2013 Apr 10. Atherosclerosis. 2013. PMID: 23639858
-
Interplay between Peripheral and Central Inflammation in Obesity-Promoted Disorders: The Impact on Synaptic Mitochondrial Functions.Int J Mol Sci. 2020 Aug 19;21(17):5964. doi: 10.3390/ijms21175964. Int J Mol Sci. 2020. PMID: 32825115 Free PMC article. Review.
-
High fat diet and its effects on cognitive health: alterations of neuronal and vascular components of brain.Physiol Behav. 2021 Oct 15;240:113528. doi: 10.1016/j.physbeh.2021.113528. Epub 2021 Jul 11. Physiol Behav. 2021. PMID: 34260890 Review.
Cited by
-
Attenuation of Oxidative Stress and Inflammatory Response by Chronic Cannabidiol Administration Is Associated with Improved n-6/n-3 PUFA Ratio in the White and Red Skeletal Muscle in a Rat Model of High-Fat Diet-Induced Obesity.Nutrients. 2021 May 11;13(5):1603. doi: 10.3390/nu13051603. Nutrients. 2021. PMID: 34064937 Free PMC article.
-
Sirt1-PPARS Cross-Talk in Complex Metabolic Diseases and Inherited Disorders of the One Carbon Metabolism.Cells. 2020 Aug 11;9(8):1882. doi: 10.3390/cells9081882. Cells. 2020. PMID: 32796716 Free PMC article. Review.
-
The relationship of insulin resistance and diabetes to tau PET SUVR in middle-aged to older adults.Alzheimers Res Ther. 2023 Mar 17;15(1):55. doi: 10.1186/s13195-023-01180-2. Alzheimers Res Ther. 2023. PMID: 36932429 Free PMC article.
-
Tobacco-induced hyperglycemia promotes lung cancer progression via cancer cell-macrophage interaction through paracrine IGF2/IR/NPM1-driven PD-L1 expression.Nat Commun. 2024 Jun 8;15(1):4909. doi: 10.1038/s41467-024-49199-9. Nat Commun. 2024. PMID: 38851766 Free PMC article.
-
Platycodi Radix Extract Prevents Hepatic Steatosis by Enhancing Bile Acid Synthesis in a High-Fat Diet-Induced Fatty Liver Mouse Model.Nutrients. 2024 Mar 20;16(6):893. doi: 10.3390/nu16060893. Nutrients. 2024. PMID: 38542804 Free PMC article.
References
-
- Carmiel-Haggai M, Cederbaum AI, Nieto N. A high-fat diet leads to the progression of non-alcoholic fatty liver disease in obese rats. FASEB J. 2005;19:136–8. - PubMed
-
- Winzell MS, Ahreen B. The high-fat- diet-fed mouse: a model for studying mechanisms and treatment of impaired glucose tolerance and type 2 diabetes. Diabetes. 2004;53:S215–S9. - PubMed
-
- Marchesini G, Brizi M, Morselli-Labate AM, Bianchi G, Bugianesi E, McCullough AJ. Association of nonalcoholic fatty liver disease with insulin resistance. Am J Med. 1999;107:450–5. - PubMed
Publication types
MeSH terms
Substances
Grants and funding
LinkOut - more resources
Full Text Sources
Other Literature Sources
Medical
Molecular Biology Databases
Research Materials
Miscellaneous
