. 2015 May;56(5):3075-83.
doi: 10.1167/iovs.14-15891.

Rat, mouse, and primate models of chronic glaucoma show sustained elevation of extracellular ATP and altered purinergic signaling in the posterior eye

Affiliations

Rat, mouse, and primate models of chronic glaucoma show sustained elevation of extracellular ATP and altered purinergic signaling in the posterior eye

Wennan Lu et al. Invest Ophthalmol Vis Sci. 2015 May.

Abstract

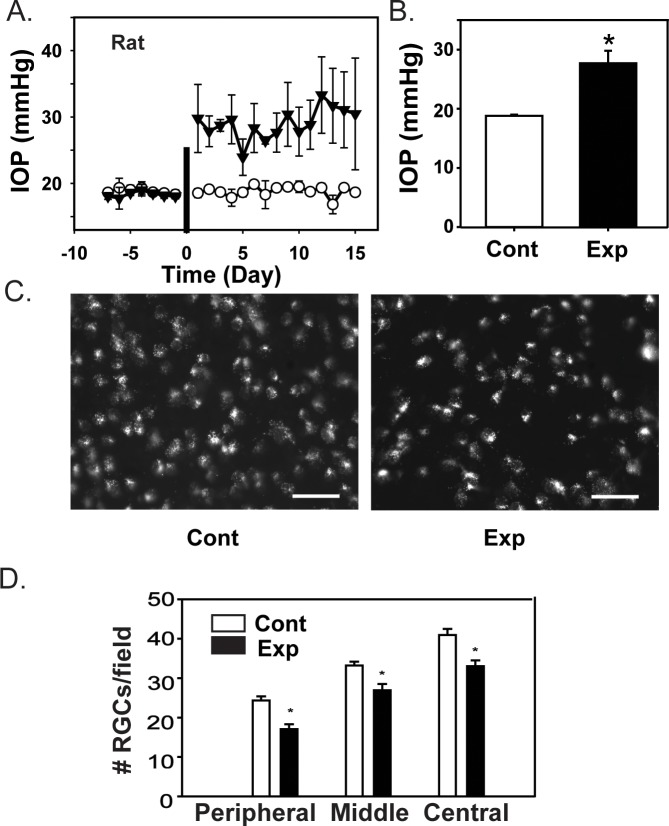
Purpose: The cellular mechanisms linking elevated IOP with glaucomatous damage remain unresolved. Mechanical strains and short-term increases in IOP can trigger ATP release from retinal neurons and astrocytes, but the response to chronic IOP elevation is unknown. As excess extracellular ATP can increase inflammation and damage neurons, we asked if sustained IOP elevation was associated with a sustained increase in extracellular ATP in the posterior eye.

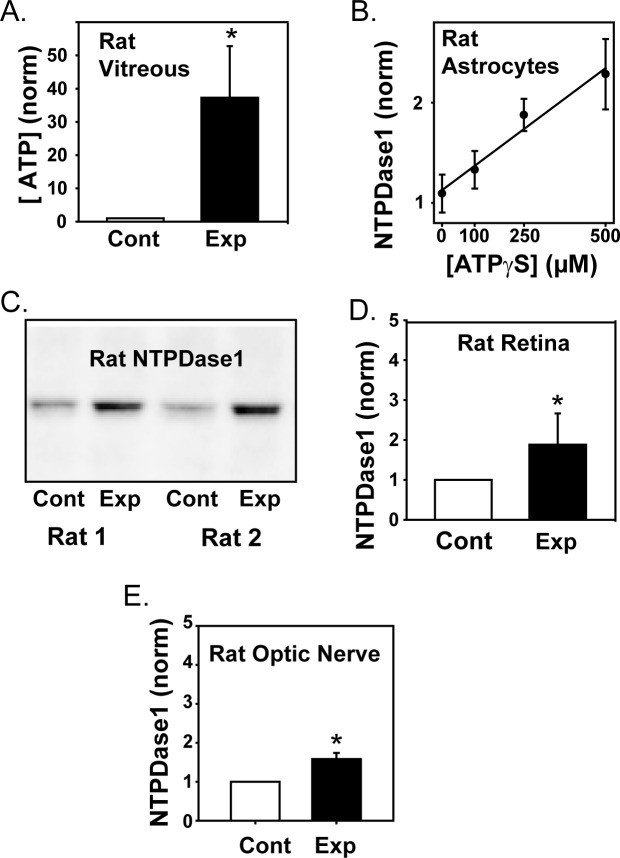
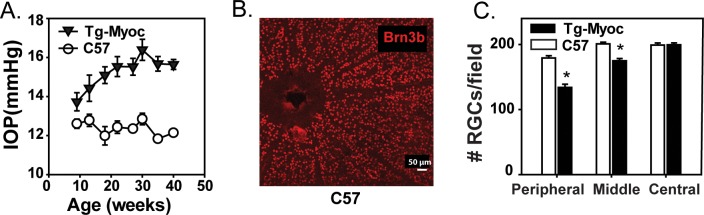
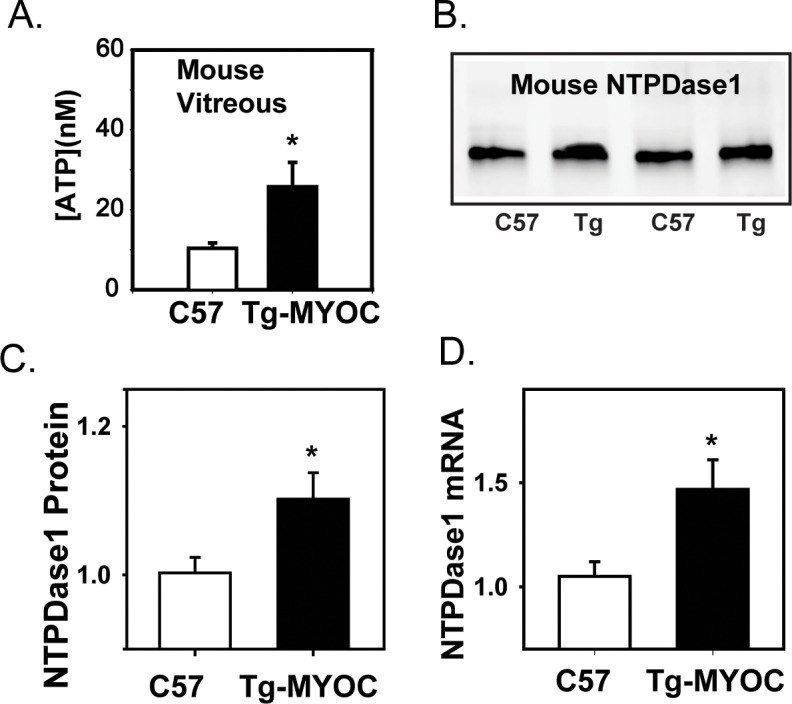
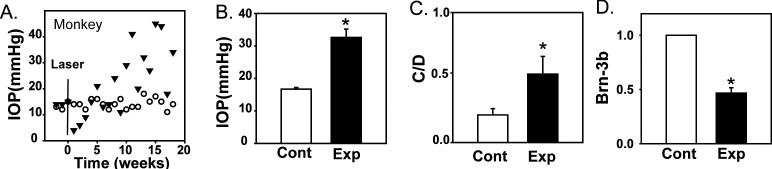
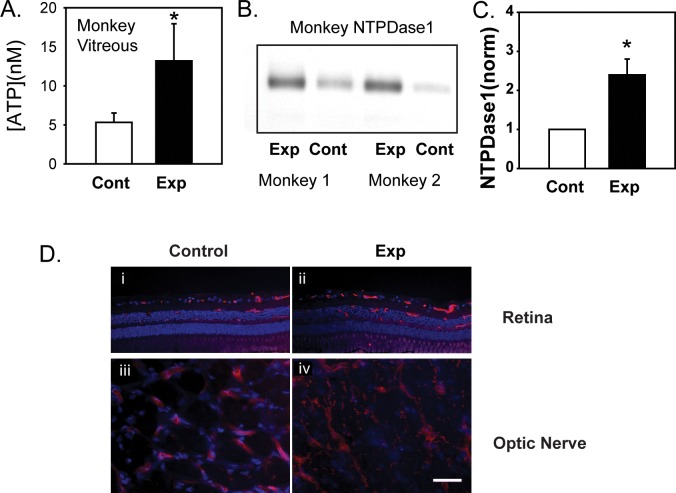
Methods: No ideal animal model of chronic glaucoma exists, so three different models were used. Tg-Myoc(Y437H) mice were examined at 40 weeks, while IOP was elevated in rats following injection of hypertonic saline into episcleral veins and in cynomolgus monkeys by laser photocoagulation of the trabecular meshwork. The ATP levels were measured using the luciferin-luciferase assay while levels of NTPDase1 were assessed using qPCR, immunoblots, and immunohistochemistry.

Results: The ATP levels were elevated in the vitreal humor of rats, mice, and primates after a sustained period of IOP elevation. The ecto-ATPase NTPDase1 was elevated in optic nerve head astrocytes exposed to extracellular ATP for an extended period. NTPDase1 was also elevated in the retinal tissue of rats, mice, and primates, and in the optic nerve of rats, with chronic elevation in IOP.

Conclusions: A sustained elevation in extracellular ATP, and upregulation of NTPDase1, occurs in the posterior eye of rat, mouse, and primate models of chronic glaucoma. This suggests the elevation in extracellular ATP may be sustained in chronic glaucoma, and implies a role for altered purinergic signaling in the disease.


Figures

Figure 1
Figure 1
Intraocular pressure elevation in rat eyes with experimental glaucoma. Increased IOP following injection of hypertonic saline induces RGC loss in rats. (A) The temporal changes in IOP measurements from all rats, indicating the IOP levels in the control (white circles) and contralateral experimental eyes (black circles) before and after injection of hypertonic saline. The injection point is indicated with a vertical bar on day 0. Each symbol is the mean ± SEM from three to nine measurements (IOP was not measured daily from each rat). (B) Mean values of IOP. There was a significant difference in the mean IOP between experimental (Exp) and control (Cont) eyes (n = 9 pairs, each a mean of measurements taken on 3–11 days, P = 0.004, paired t-test). (C) Representative images from a pair of eyes with control (Cont) and experimentally elevated levels of IOP (Exp), showing RGCs loaded with aminostilbamidine for cell counting. Images were obtained in the peripheral area of the nasal quadrant, one visual field from the retinal edge. A reduced density of fluorescent ganglion cells was apparent in the experimental eye, scale bars: 50 μm. (D) Quantification of RGCs after 14 days of elevated IOP. A significant reduction in cell number was present in all three retinal regions (n = 3, P = 0.002, 0.010, and <0.001 respectively for peripheral, middle, and central regions).
Figure 2
Figure 2
The ATP levels in retina of rats with experimental glaucoma. (A) The concentrations of ATP in the vitreous of rats with experimentally increased IOP (Exp) was greater than in contralateral control eyes (Cont; n = 8, P = 0.039). Levels were normalized to the luminescence output from the luciferase assay in the control eye of each pair. (B) Exposure of rat optic nerve head astrocytes to ATPγS in the bath led to a dose dependent rise in mRNA for NTPDase1, with data fit by a first order regression (P = 0.015). (C) Representative immunoblots of two eye pairs with anti-NTPDase1 antibody demonstrating the increase in protein levels in retinas from experimental eyes with increased IOP as compared with contralateral controls. Blots were detected at the expected size of 72 to 75 kDa for the glycosylated protein in rat. (D) Mean elevation in NTPDase1 protein levels in retinas from eyes with elevated IOP. Blot intensities were normalized to the control of each pair (P = 0.016, n = 8). (E) NTPDase1 expression as determined from densitometry analysis of immunoblots increased in optic nerves from eyes with elevated IOP (Exp) as compared with contralateral control nerves (Cont; P = 0.002, n = 6).
Figure 3
Figure 3
Intraocular pressure and RGCs in retina of Tg-MyocY437H mice. (A) Intraocular pressure levels from Tg-MyocY437H mice (black triangles) as compared with sibling wild-types (white circles) measured every 4 weeks (mean ± SEM, P = 0.008, paired t-test for each time point, n = 12–16 eyes). (B) Typical whole mount of control retina stained with Brn-3b antibody showing distinct RGC soma used for quantification, scale bar: 50 μm. (C) Mean RGCs per field in peripheral (P < 0.001), middle (P = 0.020), and central (NS) retinal regions in 40-week-old wild-type (white bars) versus Tg-MyocY437H mice (black bars); (n = 3 mice, 8 counts per region).
Figure 4
Figure 4
Increase in ATP and NTPDase1 in Tg-MyocY437H mice. (A) The concentration of ATP in the vitreous of Tg-MyocY437H mice at 7 to 16 months was significantly higher than in age-matched sibling controls (n = 6, P = 0.034). (B) Representative immunoblots from retinas of two 40-week-old Tg-MyocY437H mice and two age-matched controls showing increased NTPDase1 bands in the Tg-MyocY437H mice. Bands were at the predicted 72 to 75 kDa of the glycosylated protein in mice. (C) Mean NTPDase1 protein levels quantified from immunoblots indicates an increase in Tg-MyocY437H mice (P = 0.031, n = 11–12). Message levels normalized to mean control levels. (D) Quantitative PCR results demonstrate an increase in mRNA message for NTPDase1 in retina for 40-week-old Tg-MyocY437H mice as compared with control (P = 0.029, n = 6–7). Message levels normalized to mean control levels.
Figure 5
Figure 5
Intraocular pressure elevation in primate eyes with experimental glaucoma. (A) Intraocular pressure measurements from the control eye (white circles) and contralateral eye of a monkey that underwent photocoagulation of the trabecular meshwork (black triangles) before and after treatment on week 0 (black line). Timolol was given on weeks 17 and 18 to the treated eye to reduce the pressure. (B) The mean IOP from the experimental treated eye (Exp) of monkeys used in this study was significantly higher than in the untreated contralateral control eye (Cont; P = 0.006, n = 6). (C) Cup-disc ratios of experimental and contralateral control eyes (P = 0.043, n = 6). (D) The intensity of RGC marker Brn-3b in immunoblots from experimental eyes was reduced as compared with the contralateral control eye (P = 0.002, n = 6).
Figure 6
Figure 6
NTPDase1 levels in primates with experimental glaucoma. (A) The ATP levels are increased in the vitreous of primates with increased IOP compared with the contralateral controls (n = 8, P = 0.039). (B) Representative immunoblots for NTPDase1 of experimental (Exp) and contralateral untreated control retinas (Cont) from two monkeys indicating increase in NTPDase1 protein levels in retinas from eyes with experimental glaucoma. Bands were at the predicted size of the glycosylated proteins in primates (75–80 kDa). (C) Quantification of NTPDase1 protein using densitometry analysis of immunoblots shows retinas from eyes with increased IOP (Exp) had significantly increased levels of NTPDase1 as compared with contralateral controls (Cont; P = 0.018, n = 6 in triplicate). (D) Immunohistochemical staining for NTPDase1 in retina (i, ii) and optic nerve (iii, iv) from eyes with elevated IOP (Exp) and the contralateral control (Cont), scale bar: 10 μm.

Comment in

References

    1. Quigley HA,, Broman AT. The number of people with glaucoma worldwide in 2010 and 2020. Br J Ophthalmol. 2006; 90: 262–267. - PMC - PubMed
    1. Osborne NN. Pathogenesis of ganglion “cell death” in glaucoma and neuroprotection: focus on ganglion cell axonal mitochondria. Prog Brain Res. 2008; 173: 339–352. - PubMed
    1. AGIS. The Advanced Glaucoma Intervention Study (AGIS): 7. The relationship between control of intraocular pressure and visual field deterioration. The AGIS Investigators. Am J Ophthalmol. 2000; 130: 429–440. - PubMed
    1. Broman AT,, Quigley HA,, West SK, et al. Estimating the rate of progressive visual field damage in those with open-angle glaucoma, from cross-sectional data. Invest Ophthalmol Vis Sci. 2008; 49: 66–76. - PMC - PubMed
    1. Wax MB,, Tezel G. Immunoregulation of retinal ganglion cell fate in glaucoma. Exp Eye Res. 2009; 88: 825–830. - PubMed

Publication types

MeSH terms