. 2015 May;56(5):3202-11.
doi: 10.1167/iovs.14-15669.

Validity of Automated Choroidal Segmentation in SS-OCT and SD-OCT

Affiliations

Validity of Automated Choroidal Segmentation in SS-OCT and SD-OCT

Li Zhang et al. Invest Ophthalmol Vis Sci. 2015 May.

Abstract

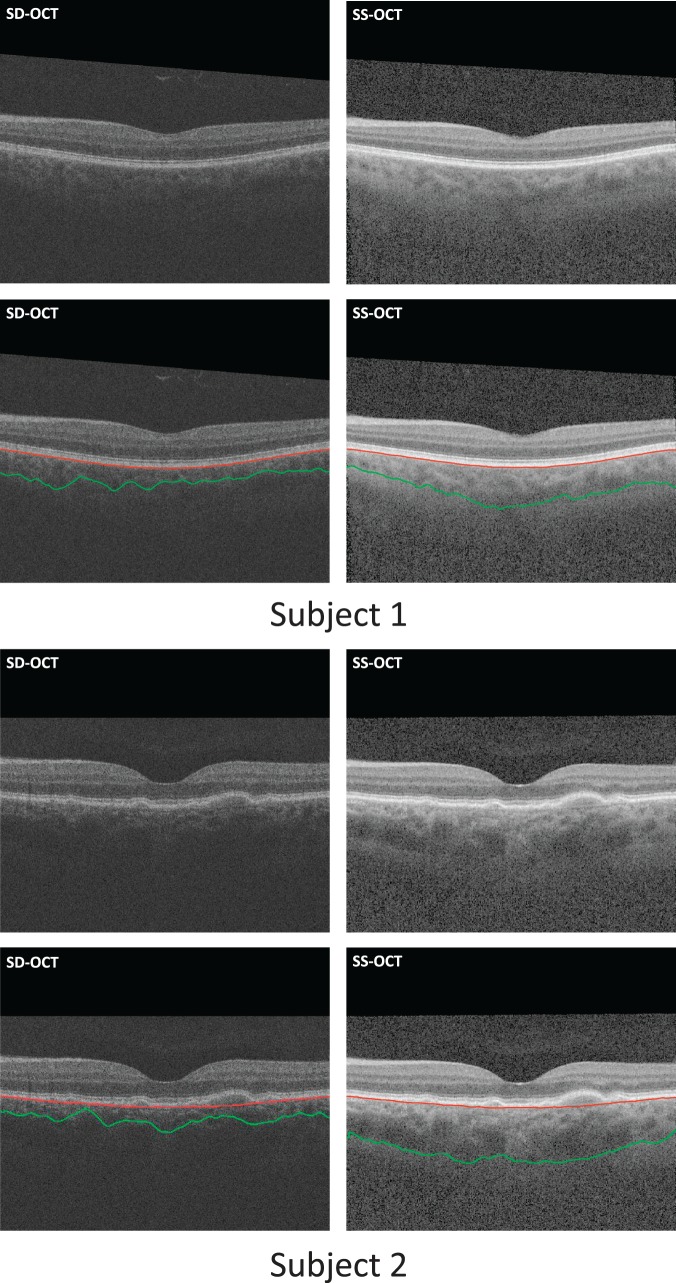
Purpose: To evaluate the validity of a novel fully automated three-dimensional (3D) method capable of segmenting the choroid from two different optical coherence tomography scanners: swept-source OCT (SS-OCT) and spectral-domain OCT (SD-OCT).

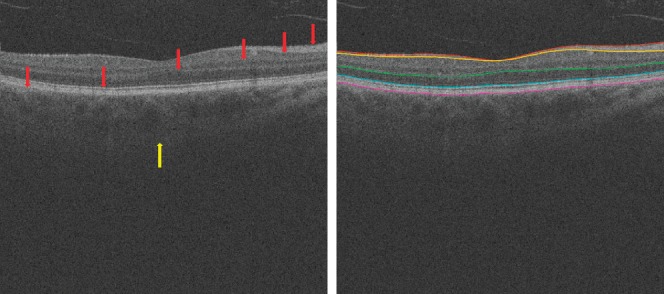
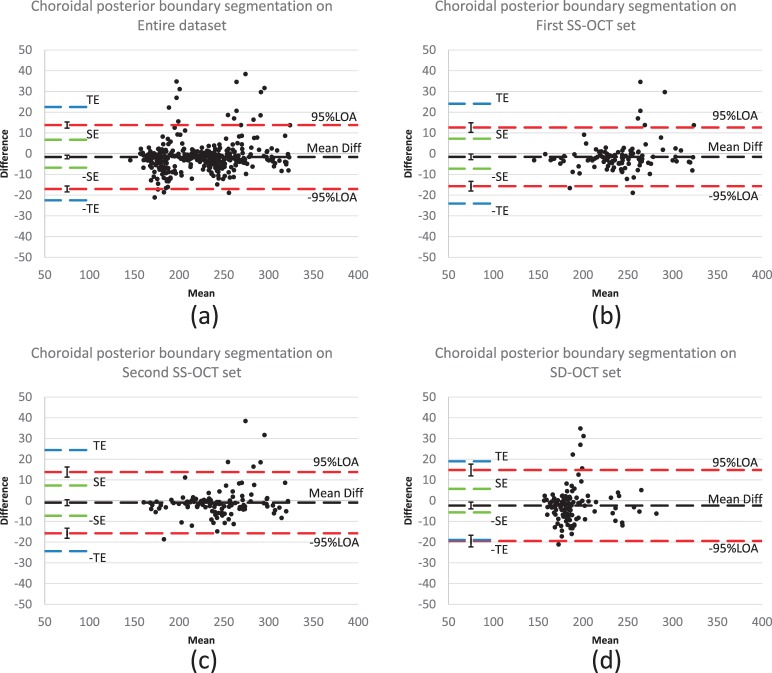
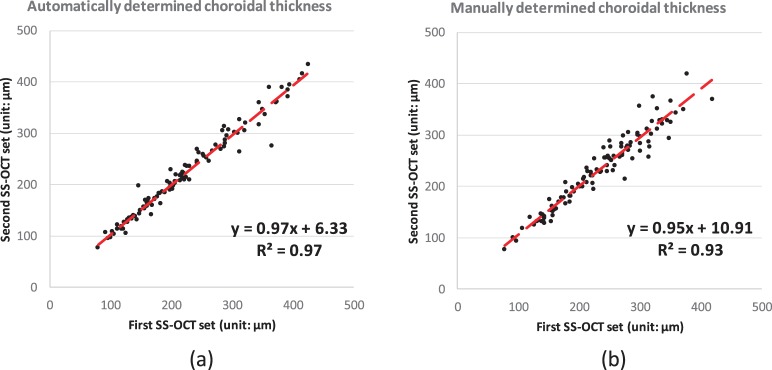
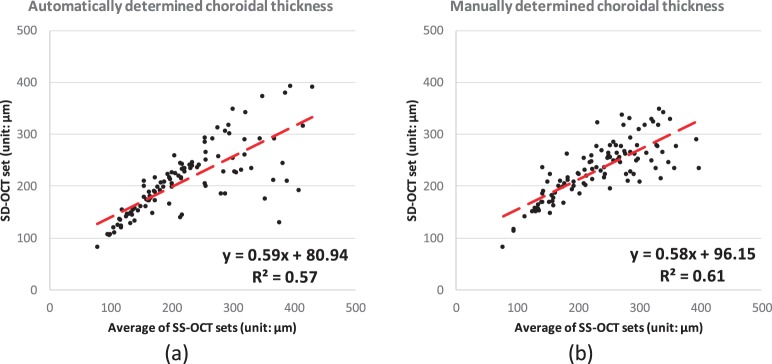
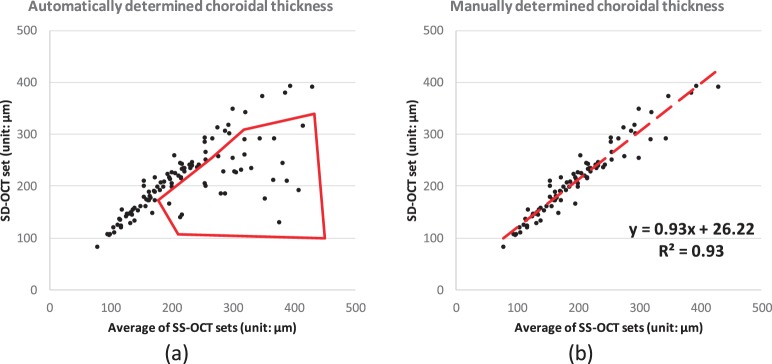
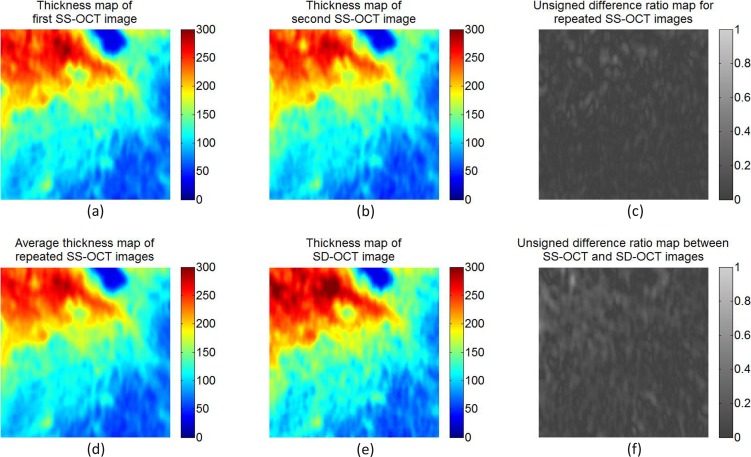
Methods: One hundred eight subjects were imaged using SS-OCT and SD-OCT. A 3D method was used to segment the choroid and quantify the choroidal thickness along each A-scan. The segmented choroidal posterior boundary was evaluated by comparing to manual segmentation. Differences were assessed to test the agreement between segmentation results of the same subject. Choroidal thickness was defined as the Euclidian distance between Bruch's membrane and the choroidal posterior boundary, and reproducibility was analyzed using automatically and manually determined choroidal thicknesses.

Results: For SS-OCT, the average choroidal thickness of the entire 6- by 6-mm2 macular region was 219.5 μm (95% confidence interval [CI], 204.9-234.2 μm), and for SD-OCT it was 209.5 μm (95% CI, 197.9-221.0 μm). The agreement between automated and manual segmentations was high: Average relative difference was less than 5 μm, and average absolute difference was less than 15 μm. Reproducibility of choroidal thickness between repeated SS-OCT scans was high (coefficient of variation [CV] of 3.3%, intraclass correlation coefficient [ICC] of 0.98), and differences between SS-OCT and SD-OCT results were small (CV of 11.0%, ICC of 0.73).

Conclusions: We have developed a fully automated 3D method for segmenting the choroid and quantifying choroidal thickness along each A-scan. The method yielded high validity. Our method can be used reliably to study local choroidal changes and may improve the diagnosis and management of patients with ocular diseases in which the choroid is affected.


Figures

Figure 1
Figure 1
In the standard clinically available SD-OCT scans, retinal layer structures are clear (red arrows), but the posterior choroidal boundary is difficult to distinguish (yellow arrow). At right, the surfaces from top to bottom are internal limiting membrane, the transition between retinal nerve fiber layer and ganglion cell layer, outer boundary of outer plexiform layer, boundary of myoid and ellipsoid of inner segments, and Bruch's membrane.
Figure 2
Figure 2
Segmentation results from the previous method on clinically available SD-OCT image (Zeiss Cirrus; EDI mode was not used): (a) Original B-scan; (b) 3D choroidal vasculature segmentation; (c) the outer boundary of choroidal vasculature is estimated using thinplate-spline surface fitting, real segmentation of choroidal–scleral interface was not achieved.
Figure 3
Figure 3
Swept-source OCT and spectral-domain OCT show difference of intensity contrast around choroidal–scleral interface. An example of the difference of intensity contrast at the same location from the same eye in (a) SS-OCT image data and in (b) SD-OCT image data.
Figure 4
Figure 4
Three-dimensional choroidal segmentation using our proposed method. (a) An example B-scan from the original data; (b) the B-scan after applying the angle adjustment; (c) Bruch's membrane segmentation result; (d) choroidal posterior segmentation result. The red curve is the segmentation of Bruch's membrane; the green curve is the segmentation of choroidal posterior boundary. Though only a single B-scan is shown, the method operates in 3D across all B-scans.
Figure 5
Figure 5
Difference assessment between automated and manual segmentations (Bland-Altman plots): (a) on entire datasets: 216 SS-OCT scans and 108 SD-OCT scans; (b) on the first SS-OCT set; (c) on the second SS-OCT set; (d) on the SD-OCT set. Black dashed lines represent the mean of relative difference between automated and manual segmentations and red dashed lines represent the 95% limits of agreement (LOA). Ninety-five percent confidence interval of the mean difference and 95% LOA are added on the left end of the corresponding dashed lines; blue dashed lines represent the predefined total error (TE) as 10% of the average thickness; green dashed lines represent the redefined systematic error (SE) as 3% of the average thickness.
Figure 6
Figure 6
Correlation analysis of the choroidal thickness on entire 6-by-6 macular region between SS-OCT repeated scans: (a) automated segmentation; (b) manual segmentation.
Figure 7
Figure 7
Correlation analysis of the choroidal thickness on entire 6-by-6 macular region between the mean of SS-OCT repeated scans and SD-OCT scan from the same subject: (a) automated segmentation; (b) manual segmentation.
Figure 8
Figure 8
Two examples of subjects in whom the proposed choroidal segmentation of SD-OCT scans (left column) resulted in a large underestimation due to the lower contrast in that region, while segmentation of the SS-OCT scans of the same subjects (right column) led to adequate estimates.
Figure 9
Figure 9
(a) The correlation between the choroidal thicknesses from SS-OCT and SD-OCT is fair as shown in Figure 7 (R2 < 0.65). The region outlined by the red segments represents where some SD-OCT images do not have enough intensity contrast around choroidal–scleral interface; (b) the correlation is largely improved if we consider only those images with sufficient image quality.
Figure 10
Figure 10
Choroidal thickness maps and relative difference ratio maps from the same subject. (a) Thickness map of the first SS-OCT image; (b) thickness map of the second SS-OCT image; (c) absolute difference ratio map for the repeated SS-OCT images; (d) average thickness map of the repeated SS-OCT images; (e) thickness map of SD-OCT image; (f) absolute difference ratio map between the average SS-OCT image and SD-OCT image. The absolute difference ratio is computed as the result of the absolute difference along each A-scan divided by the average thickness between the thicknesses. The absolute difference ratio map between SS-OCT and SD-OCT images shows relatively larger difference than the absolute difference ratio map for repeated SS-OCT images.

Similar articles

Cited by

References

    1. Nickla DL,, Wallman J. The multifunctional choroid. Prog Retin Eye Res. 2010; 29: 144–168. - PMC - PubMed
    1. Zarbin MA. Current concepts in the pathogenesis of age-related macular degeneration. Arch Ophthalmol. 2004; 122: 598–614. - PubMed
    1. Spaide RF. Age-related choroidal atrophy. Am J Ophthalmol. 2009; 147: 801–810. - PubMed
    1. Wang M,, Munch IC,, Hasler PW,, Prünte C,, Larsen M. Central serous chorioretinopathy. Acta Ophthalmol. 2008; 86: 126–145. - PubMed
    1. Ramrattan RS,, van der Schaft TL,, Mooy CM,, de Bruijn WC,, Mulder PG,, de Jong PT. Morphometric analysis of Bruch's membrane, the choriocapillaris, and the choroid in aging. Invest Ophthalmol Vis Sci. 1994; 35: 2857–2864. - PubMed

Publication types

LinkOut - more resources