

Near-infrared autofluorescence: its relationship to short-wavelength autofluorescence and optical coherence tomography in recessive stargardt disease
- PMID: 26024107
- PMCID: PMC4453463
- DOI: 10.1167/iovs.14-16050
Near-infrared autofluorescence: its relationship to short-wavelength autofluorescence and optical coherence tomography in recessive stargardt disease
Abstract
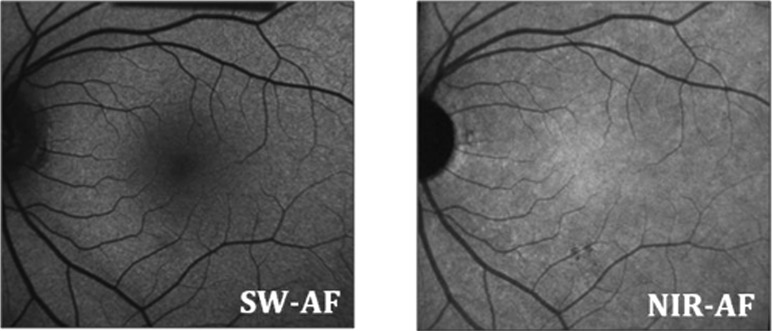
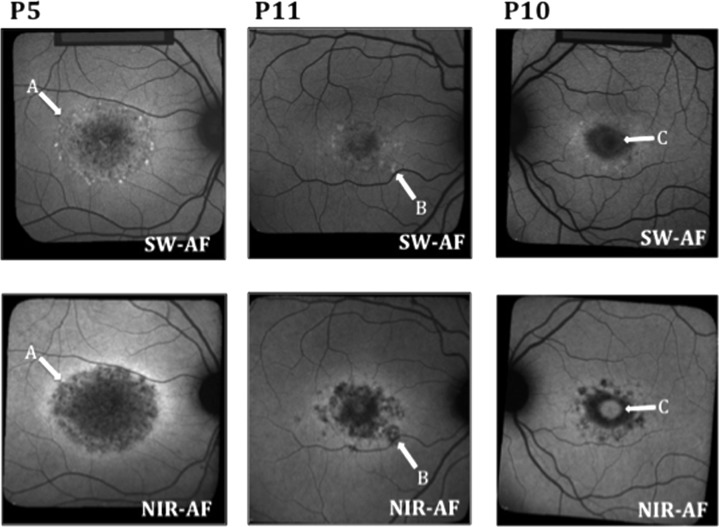
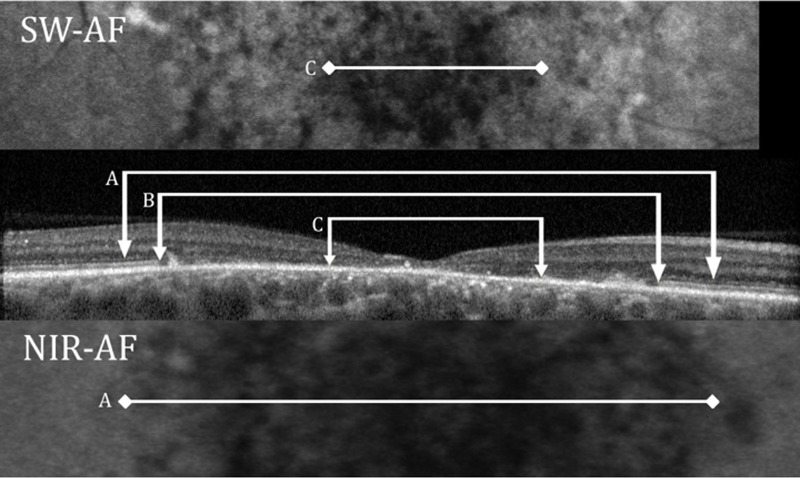
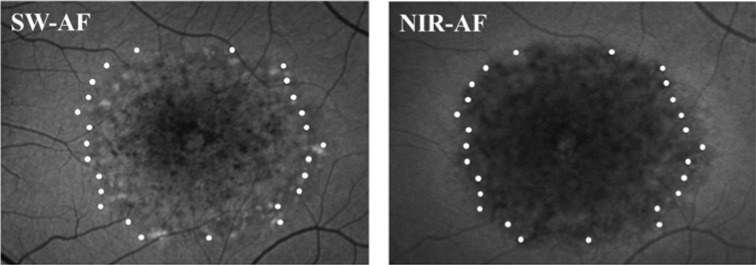
Purpose: We compared hypoautofluorescent (hypoAF) areas detected with near-infrared (NIR-AF) and short-wavelength autofluorescence (SW-AF) in patients with recessive Stargardt disease (STGD1) to retinal structure using spectral domain optical coherence tomography (SD-OCT).
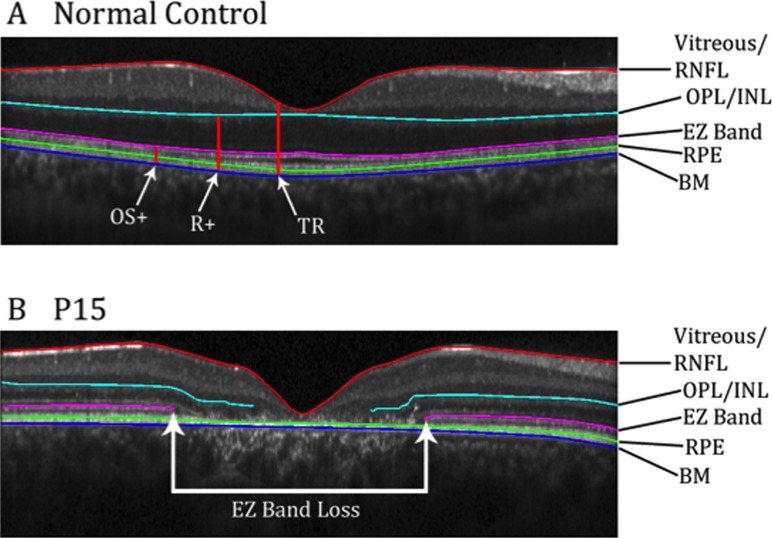
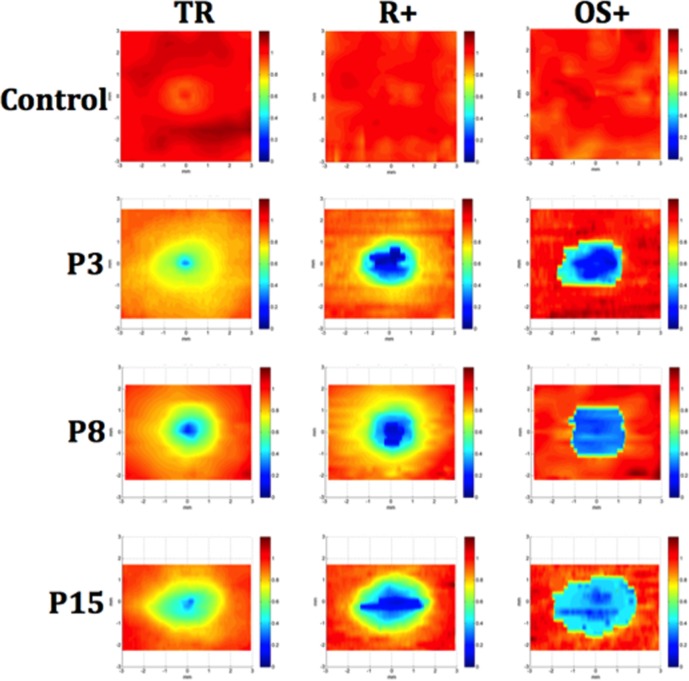
Methods: The SD-OCT volume scans, and SW-AF and NIR-AF images were obtained from 15 eyes of 15 patients with STGD1 and registered to each other. Thickness maps of the total retina, receptor-plus layer (R+, from distal border of the RPE to outer plexiform/inner nuclear layer boundary), and outer segment-plus layer (OS+, from distal border of the RPE to ellipsoid zone [EZ] band) were created from SD-OCT scans. These were compared qualitatively and quantitatively to the hypoAF areas in SW-AF and NIR-AF images.
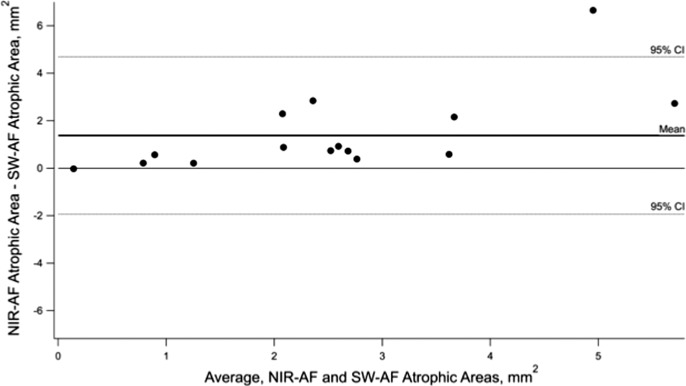
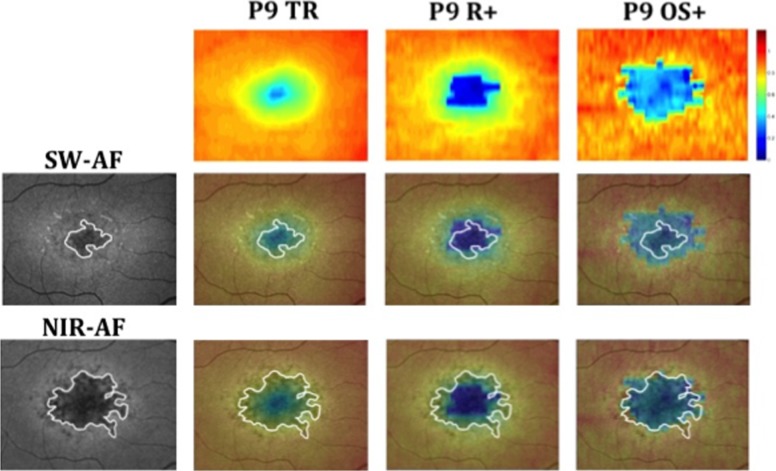
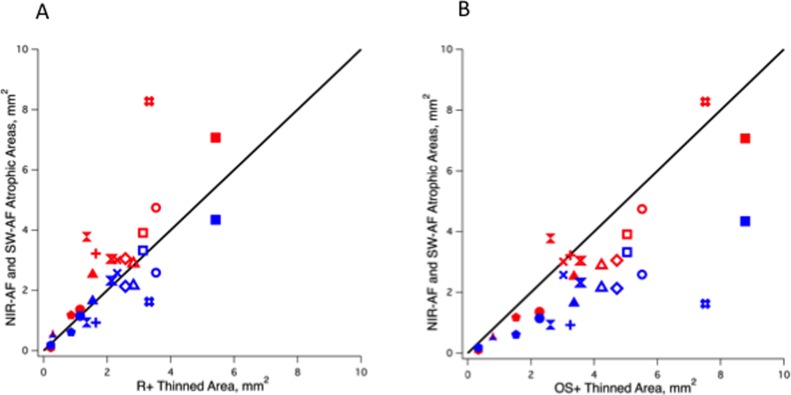
Results: All eyes showed a hypoAF area in the central macula and loss of the EZ band in SD-OCT scans. The hypoAF area was larger in NIR than SW-AF images and it exceeded the area of EZ band loss for 12 eyes. The thickness maps showed progressive thinning towards the central macula, with the OS+ layer showing the most extensive and severe thinning. The central hypoAF areas on NIR corresponded to the OS+ thinned areas, while the hypoAF areas on SW-AF corresponded to the R+ thinned areas.
Conclusions: Since the larger hypoAF area on NIR-AF exceeded the region of EZ band loss, and corresponded to the OS+ thinned area, RPE cell loss occurred before photoreceptor cell loss. The NIR-AF imaging may be an effective tool for following progression and predicting loss of photoreceptors in STGD1.
Figures
References
-
- Allikmets R,, Singh N,, Sun H,, et al. A photoreceptor cell-specific ATP-binding transporter gene (ABCR) is mutated in recessive Stargardt macular dystrophy. Nat Genet. 1997; 15: 236–246. - PubMed
-
- Rotenstreich Y,, Fishman GA,, Anderson RJ. Visual acuity loss and clinical observations in a large series of patients with Stargardt disease. Ophthalmology. 2003; 110: 1151–1158. - PubMed
-
- Armstrong JD,, Meyer D,, Xu S,, Elfervig JL. Long-term follow-up of Stargardt's disease and fundus flavimaculatus. Ophthalmology. 1998; 105: 448–457. - PubMed
-
- Fishman GA,, Farber M,, Patel BS,, Derlacki DJ. Visual acuity loss in patients with Stargardt's macular dystrophy. Ophthalmology. 1987; 94: 809–814. - PubMed
-
- von Rückmann A,, Fitzke FW,, Bird AC. In vivo fundus autofluorescence in macular dystrophies. Arch Ophthalmol. 1997; 115: 609–615. - PubMed
Publication types
MeSH terms
Grants and funding
LinkOut - more resources
Full Text Sources
Other Literature Sources
Medical
Miscellaneous
