

Optical Coherence Tomography Angiography of Peripapillary Retinal Blood Flow Response to Hyperoxia
- PMID: 26024111
- PMCID: PMC4453965
- DOI: 10.1167/iovs.15-16655
Optical Coherence Tomography Angiography of Peripapillary Retinal Blood Flow Response to Hyperoxia
Abstract
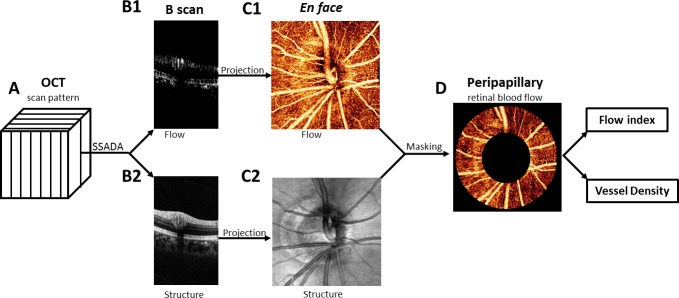
Purpose: To measure the change in peripapillary retinal blood flow in response to hyperoxia by using optical coherence tomography (OCT) angiography.
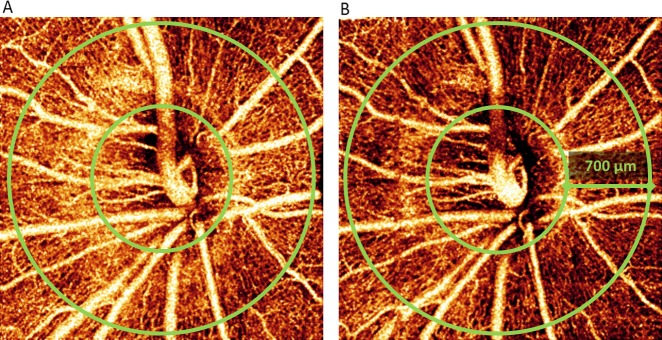
Methods: One eye of each healthy human participants (six) was scanned with a commercial high-speed (70 kHz) spectral OCT. Scans were captured twice after 10-minute exposures to normal breathing (baseline) and hyperoxia. Blood flow was detected by the split-spectrum amplitude-decorrelation angiography (SSADA) algorithm. Peripapillary retinal blood flow index and vessel density were calculated from en face maximum projections of the retinal layers. The experiment was performed on 2 separate days for each participant. Coefficient of variation (CV) was used to measure within-day repeatability and between-day reproducibility. Paired t-tests were used to compare means of baseline and hyperoxic peripapillary retinal blood flow.
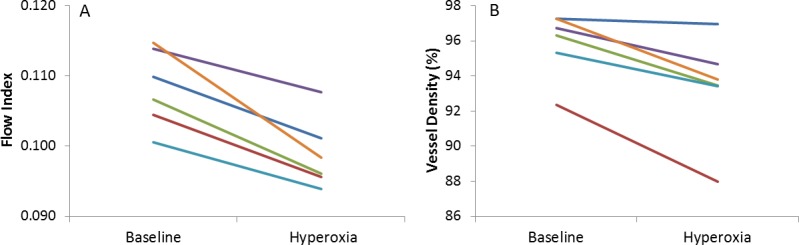
Results: A decrease of 8.87% ± 3.09% (mean ± standard deviation) in flow index and 2.61% ± 1.50% in vessel density was observed under hyperoxia. The within-day repeatability CV of baseline measurements was 5.75% for flow index and 1.67% for vessel density. The between-day reproducibility CV for baseline flow index and vessel density was 11.1% and 1.14%, respectively. The between-day reproducibility of the hyperoxic response was 3.71% and 1.67% for flow index and vessel density, respectively.
Conclusions: Optical coherence tomography angiography with SSADA was able to detect a decrease in peripapillary retinal blood flow in response to hyperoxia. The response was larger than the variability of baseline measurements. The magnitude of an individual's hyperoxic response was highly variable between days. Thus, reliable assessment may require averaging multiple measurements.
Figures
Similar articles
-
Retinal Blood Flow Response to Hyperoxia Measured With En Face Doppler Optical Coherence Tomography.Invest Ophthalmol Vis Sci. 2016 Jul 1;57(9):OCT141-5. doi: 10.1167/iovs.15-18917. Invest Ophthalmol Vis Sci. 2016. PMID: 27409465 Free PMC article.
-
Optical Coherence Tomography Angiography of the Peripapillary Retina in Glaucoma.JAMA Ophthalmol. 2015 Sep;133(9):1045-52. doi: 10.1001/jamaophthalmol.2015.2225. JAMA Ophthalmol. 2015. PMID: 26203793 Free PMC article.
-
Retinal vascular layers imaged by fluorescein angiography and optical coherence tomography angiography.JAMA Ophthalmol. 2015 Jan;133(1):45-50. doi: 10.1001/jamaophthalmol.2014.3616. JAMA Ophthalmol. 2015. PMID: 25317632
-
[Optical coherence tomography angiography in glaucoma diagnosis].Vestn Oftalmol. 2016;132(5):98-102. doi: 10.17116/oftalma2016132598-102. Vestn Oftalmol. 2016. PMID: 28635733 Review. Russian.
-
Optical Coherence Tomography Angiography Using the Optovue Device.Dev Ophthalmol. 2016;56:6-12. doi: 10.1159/000442770. Epub 2016 Mar 15. Dev Ophthalmol. 2016. PMID: 27022989 Review.
Cited by
-
Reproducibility of Perfusion Parameters of Optic Disc and Macula in Rhesus Monkeys by Optical Coherence Tomography Angiography.Chin Med J (Engl). 2016 May 5;129(9):1087-90. doi: 10.4103/0366-6999.180532. Chin Med J (Engl). 2016. PMID: 27098795 Free PMC article.
-
Optical coherence tomography angiography-derived flow density: a review of the influencing factors.Graefes Arch Clin Exp Ophthalmol. 2020 Apr;258(4):701-710. doi: 10.1007/s00417-019-04553-2. Epub 2019 Dec 9. Graefes Arch Clin Exp Ophthalmol. 2020. PMID: 31820079 Review.
-
Optical Coherence Tomography Angiography, the powerful new imaging modality for clinical ophthalmology.Taiwan J Ophthalmol. 2017 Jul-Sep;7(3):113-114. doi: 10.4103/2211-5056.214233. Taiwan J Ophthalmol. 2017. PMID: 29034150 Free PMC article. No abstract available.
-
Reversed Neurovascular Coupling on Optical Coherence Tomography Angiography Is the Earliest Detectable Abnormality before Clinical Diabetic Retinopathy.J Clin Med. 2020 Oct 31;9(11):3523. doi: 10.3390/jcm9113523. J Clin Med. 2020. PMID: 33142724 Free PMC article.
-
A comparative study of structural, functional and circulatory parameters in glaucoma diagnostics.PLoS One. 2018 Aug 23;13(8):e0201599. doi: 10.1371/journal.pone.0201599. eCollection 2018. PLoS One. 2018. PMID: 30138396 Free PMC article.
References
-
- Vanderkooi JM,, Erecinska M,, Silver IA. Oxygen in mammalian tissue: methods of measurement and affinities of various reactions. Am J Physiol. 1991; 260: C1131–C1150. - PubMed
-
- Harris A,, Arend O,, Kopecky K, et al. Physiological perturbation of ocular and cerebral blood flow as measured by scanning laser ophthalmoscopy and color Doppler imaging. Surv Ophthalmol. 1994; 38 (suppl): S81–S86. - PubMed
-
- Gilmore ED,, Hudson C,, Venkataraman ST,, Preiss D,, Fisher J. Comparison of different hyperoxic paradigms to induce vasoconstriction: implications for the investigation of retinal vascular reactivity. Invest Ophthalmol Vis Sci. 2004; 45: 3207–3212. - PubMed
-
- Kiss B,, Dallinger S,, Polak K,, Findl O,, Eichler HG,, Schmetterer L. Ocular hemodynamics during isometric exercise. Microvasc Res. 2001; 61: 1–13. - PubMed
Publication types
MeSH terms
Grants and funding
LinkOut - more resources
Full Text Sources
Other Literature Sources
Research Materials
