

Autofluorescence imaging with near-infrared excitation:normalization by reflectance to reduce signal from choroidal fluorophores
- PMID: 26024124
- PMCID: PMC4455314
- DOI: 10.1167/iovs.15-16726
Autofluorescence imaging with near-infrared excitation:normalization by reflectance to reduce signal from choroidal fluorophores
Abstract
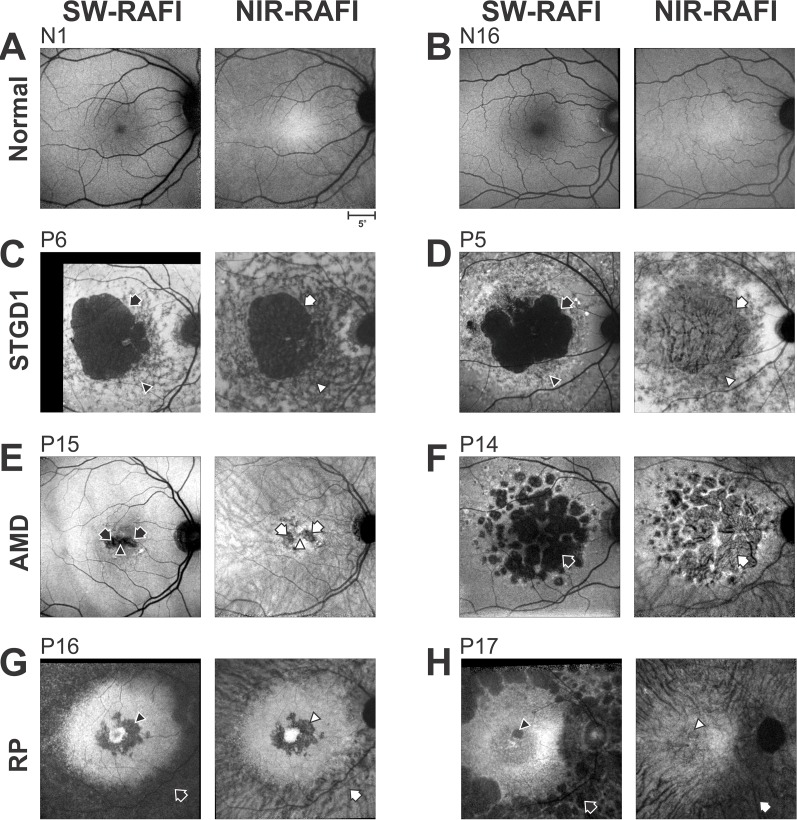
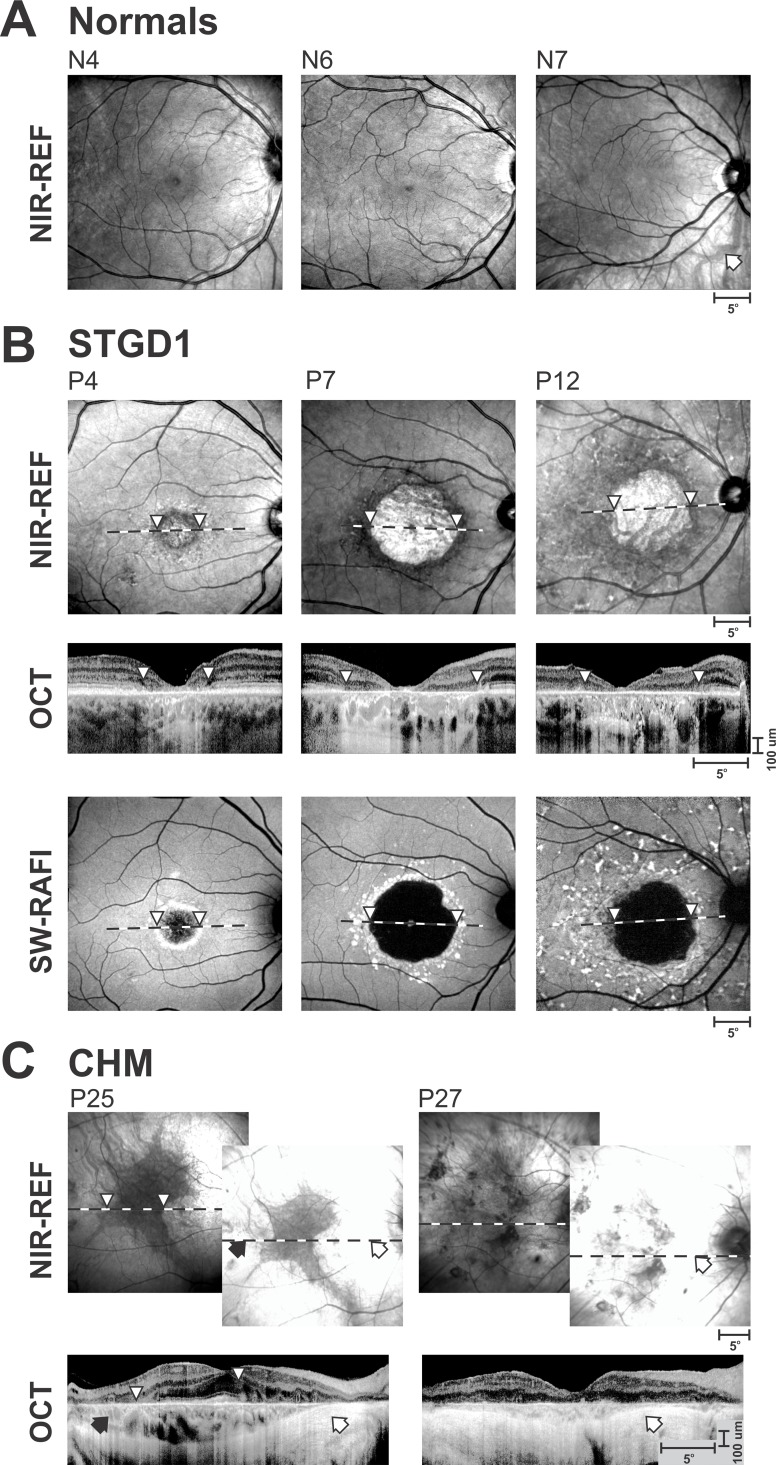
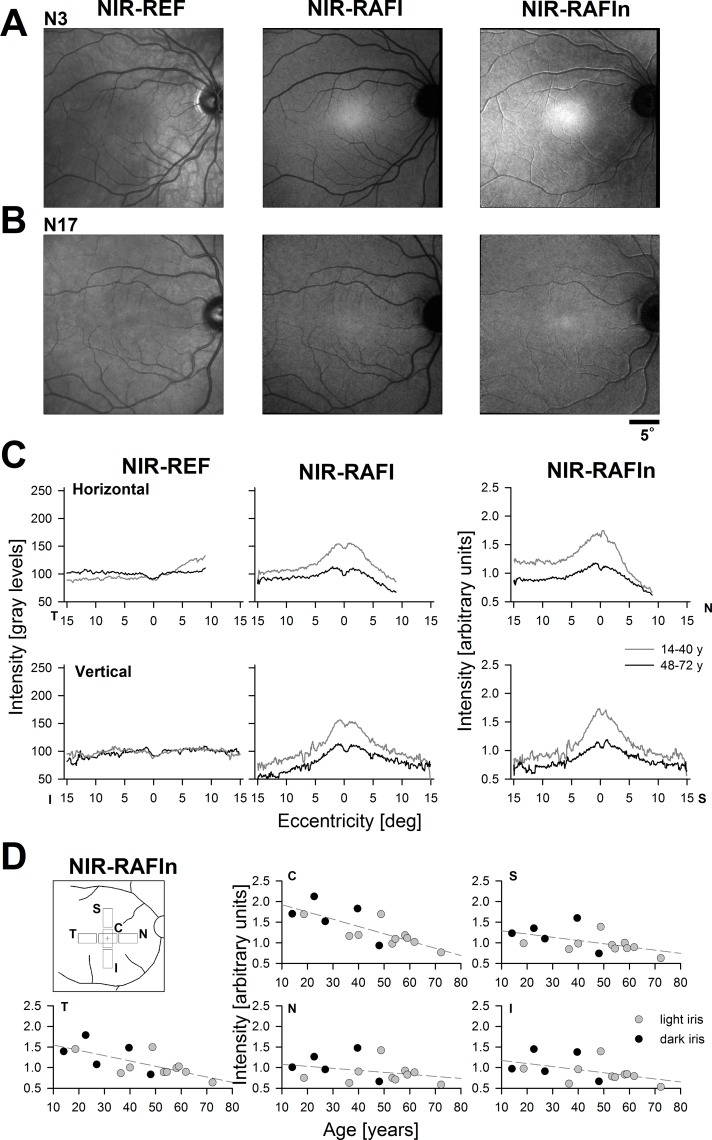
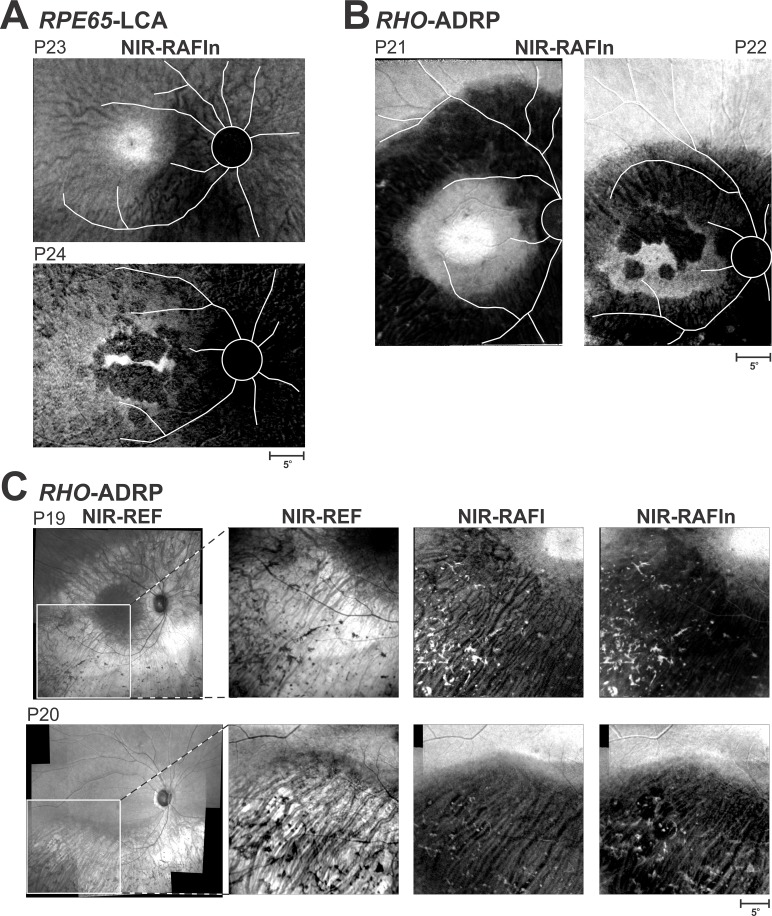
Purpose: We previously developed reduced-illuminance autofluorescence imaging (RAFI) methods involving near-infrared (NIR) excitation to image melanin-based fluorophores and short-wavelength (SW) excitation to image lipofuscin-based flurophores. Here, we propose to normalize NIR-RAFI in order to increase the relative contribution of retinal pigment epithelium (RPE) fluorophores.
Methods: Retinal imaging was performed with a standard protocol holding system parameters invariant in healthy subjects and in patients. Normalized NIR-RAFI was derived by dividing NIR-RAFI signal by NIR reflectance point-by-point after image registration.
Results: Regions of RPE atrophy in Stargardt disease, AMD, retinitis pigmentosa, choroideremia, and Leber congenital amaurosis as defined by low signal on SW-RAFI could correspond to a wide range of signal on NIR-RAFI depending on the contribution from the choroidal component. Retinal pigment epithelium atrophy tended to always correspond to high signal on NIR reflectance. Normalizing NIR-RAFI reduced the choroidal component of the signal in regions of atrophy. Quantitative evaluation of RPE atrophy area showed no significant differences between SW-RAFI and normalized NIR-RAFI.
Conclusions: Imaging of RPE atrophy using lipofuscin-based AF imaging has become the gold standard. However, this technique involves bright SW lights that are uncomfortable and may accelerate the rate of disease progression in vulnerable retinas. The NIR-RAFI method developed here is a melanin-based alternative that is not absorbed by opsins and bisretinoid moieties, and is comfortable to view. Further development of this method may result in a nonmydriatic and comfortable imaging method to quantify RPE atrophy extent and its expansion rate.
Figures

Similar articles
-
Mutations in GPR143/OA1 and ABCA4 Inform Interpretations of Short-Wavelength and Near-Infrared Fundus Autofluorescence.Invest Ophthalmol Vis Sci. 2018 May 1;59(6):2459-2469. doi: 10.1167/iovs.18-24213. Invest Ophthalmol Vis Sci. 2018. PMID: 29847651 Free PMC article.
-
Correlations among near-infrared and short-wavelength autofluorescence and spectral-domain optical coherence tomography in recessive Stargardt disease.Invest Ophthalmol Vis Sci. 2014 Oct 23;55(12):8134-43. doi: 10.1167/iovs.14-14848. Invest Ophthalmol Vis Sci. 2014. PMID: 25342616 Free PMC article.
-
Near-infrared autofluorescence in young choroideremia patients.Ophthalmic Genet. 2019 Oct;40(5):421-427. doi: 10.1080/13816810.2019.1666881. Epub 2019 Sep 21. Ophthalmic Genet. 2019. PMID: 31544579
-
[Pathophysiology of macular diseases--morphology and function].Nippon Ganka Gakkai Zasshi. 2011 Mar;115(3):238-74; discussion 275. Nippon Ganka Gakkai Zasshi. 2011. PMID: 21476310 Review. Japanese.
-
Autofluorescence of intraocular tumours.Curr Opin Ophthalmol. 2013 May;24(3):222-32. doi: 10.1097/ICU.0b013e32835f8ba1. Curr Opin Ophthalmol. 2013. PMID: 23429597 Review.
Cited by
-
Natural History of the Central Structural Abnormalities in Choroideremia: A Prospective Cross-Sectional Study.Ophthalmology. 2017 Mar;124(3):359-373. doi: 10.1016/j.ophtha.2016.10.022. Epub 2016 Dec 13. Ophthalmology. 2017. PMID: 27986385 Free PMC article.
-
Advancing Clinical Trials for Inherited Retinal Diseases: Recommendations from the Second Monaciano Symposium.Transl Vis Sci Technol. 2020 Jun 3;9(7):2. doi: 10.1167/tvst.9.7.2. eCollection 2020 Jun. Transl Vis Sci Technol. 2020. PMID: 32832209 Free PMC article. Review.
-
Cone Structure Persists Beyond Margins of Short-Wavelength Autofluorescence in Choroideremia.Invest Ophthalmol Vis Sci. 2019 Nov 1;60(14):4931-4942. doi: 10.1167/iovs.19-27979. Invest Ophthalmol Vis Sci. 2019. PMID: 31770433 Free PMC article.
-
Predicting Progression of ABCA4-Associated Retinal Degenerations Based on Longitudinal Measurements of the Leading Disease Front.Invest Ophthalmol Vis Sci. 2015 Sep;56(10):5946-55. doi: 10.1167/iovs.15-17698. Invest Ophthalmol Vis Sci. 2015. PMID: 26377081 Free PMC article.
-
Clinical Perspective: Treating RPE65-Associated Retinal Dystrophy.Mol Ther. 2021 Feb 3;29(2):442-463. doi: 10.1016/j.ymthe.2020.11.029. Epub 2020 Dec 3. Mol Ther. 2021. PMID: 33278565 Free PMC article. Review.
References
-
- Feeney L. Lipofuscin and melanin of human retinal pigment epithelium. Fluorescence, enzyme cytochemical, and ultrastructural studies. Invest Ophthalmol Vis Sci. 1978; 17: 583–600. - PubMed
-
- Feeney-Burns L,, Berman ER,, Rothman H. Lipofuscin of human retinal pigment epithelium. Am J Ophthalmol. 1980; 90: 783–791. - PubMed
-
- Weiter JJ,, Delori FC,, Wing GL,, Fitch KA. Retinal pigment epithelial lipofuscin and melanin and choroidal melanin in human eyes. Invest Ophthalmol Vis Sci. 1986; 27: 145–152. - PubMed
-
- Schraermeyer U,, Heimann K. Current understanding on the role of retinal pigment epithelium and its pigmentation. Pigment Cell Res. 1999; 12: 219–236. - PubMed
-
- Boulton M,, Dayhaw-Barker P. The role of the retinal pigment epithelium: topographical variation and ageing changes. Eye (Lond). 2001; 15 (Pt 3): 384–389. - PubMed
Publication types
MeSH terms
Substances
Grants and funding
LinkOut - more resources
Full Text Sources
Other Literature Sources
Medical
Miscellaneous
