. 2015 May 29:5:10722.
doi: 10.1038/srep10722.

Diabetic silkworms for evaluation of therapeutically effective drugs against type II diabetes

Affiliations

Diabetic silkworms for evaluation of therapeutically effective drugs against type II diabetes

Yasuhiko Matsumoto et al. Sci Rep. .

Abstract

We previously reported that sugar levels in the silkworm hemolymph, i.e., blood, increase immediately (within 1 h) after intake of a high-glucose diet, and that the administration of human insulin decreases elevated hemolymph sugar levels in silkworms. In this hyperglycemic silkworm model, however, administration of pioglitazone or metformin, drugs used clinically for the treatment of type II diabetes, have no effect. Therefore, here we established a silkworm model of type II diabetes for the evaluation of anti-diabetic drugs such as pioglitazone and metformin. Silkworms fed a high-glucose diet over a long time-period (18 h) exhibited a hyperlipidemic phenotype. In these hyperlipidemic silkworms, phosphorylation of JNK, a stress-responsive protein kinase, was enhanced in the fat body, an organ that functionally resembles the mammalian liver and adipose tissue. Fat bodies isolated from hyperlipidemic silkworms exhibited decreased sensitivity to human insulin. The hyperlipidemic silkworms have impaired glucose tolerance, characterized by high fasting hemolymph sugar levels and higher hemolymph sugar levels in a glucose tolerance test. Administration of pioglitazone or metformin improved the glucose tolerance of the hyperlipidemic silkworms. These findings suggest that the hyperlipidemic silkworms are useful for evaluating the hypoglycemic activities of candidate drugs against type II diabetes.


Figures

Figure 1
Figure 1. Changes in the amounts of glycogen, triglycerides, and free fatty acids in the fat body and hemolymph of silkworms fed a high-glucose diet for 18 h.
(AC) Silkworms were fed a normal diet (N.D.) or a diet containing 10% (w/w) glucose (G.D.) for 18 h, and then the silkworm fat bodies were isolated. (A) The amounts of glycogen in the silkworm fat bodies were determined using the anthrone-sulfuric acid method (n = 7/group). (B) Fat bodies were stained with Oil Red O. (C) Quantification of Oil Red O extracted from the stained fat bodies (n = 3/group). (DG) Silkworms were fed a normal diet (N.D.) or a diet containing 10% (w/w) glucose (G.D.) for 18 h, and the amounts of triglycerides (D,F) and free fatty acids (E,G) in the silkworm fat bodies and hemolymph were determined (n = 8/group). Data represent mean ± SEM. Significant differences between groups were evaluated using Student’s t-test.
Figure 2
Figure 2. Activation of JNK phosphorylation in the fat body cells of hyperlipidemic silkworms.
(A) Silkworms were fed a normal diet (N.D.) or a diet containing 10% (w/w) glucose (G.D.) for 18 h, and the fat bodies of the silkworms were isolated. Phosphorylated JNK and β-actin were determined by Western blot analysis. (B) Silkworms were fed a normal diet (N.D.) for 18 h, and then the silkworm fat bodies were isolated. Fat bodies were cultured in Grace’s insect medium (Life technologies) with 0.2% Bovine serum albumin (BSA) or palmitate (final conc. 500 μM and 0.2% BSA) at 27 °C for 1 h. Phosphorylated JNK and β-actin were determined by Western blot analysis. Samples were loaded in the same gel. Cropped blots were used. Full-length blots are presented in Supplementary Fig. 6.
Figure 3
Figure 3. Decrease in Akt phosphorylation facilitated by human insulin in cells of fat body in the hyperlipidemic silkworm.
(A,B) Silkworms were fed a normal diet (N.D.) or a diet containing 10% (w/w) glucose (G.D.) for 18 h, and then the silkworm fat bodies were isolated. (A) Fat bodies were cultured in Grace’s insect medium with or without human insulin (final conc. 160 μg/ml) at 27 °C for 0-20 min. (B) Fat bodies were cultured in Grace’s insect medium with or without human insulin (final conc. 0-160 μg/ml) at 27 °C for 15 min. (C) Silkworms were fed a normal diet (N.D.) for 18 h, and then the fat bodies were isolated. Fat bodies were cultured in Grace’s insect medium with 0.2% BSA or palmitate (final conc. 500 μM) with 0.2% BSA at 27 °C for 1 h. Human insulin (final conc. 160 μg/ml) or Grace’s insect medium were added to the culture medium, and the fat bodies were further incubated at 27 °C for 20 min. Phosphorylated Akt and β-actin were determined by Western blot analysis. Samples were loaded in the same gel. Cropped blots were used. Full-length blots are presented in Supplementary Fig. 6.
Figure 4
Figure 4. Increases in fasting hemolymph sugar levels in the hyperlipidemic silkworm.
(A) Experimental design. (B) Silkworms were fed a normal diet (N.D.) or a diet containing 10% (w/w) glucose (G.D.) for 18 h. Hemolymph sugar levels of the silkworms were determined using the phenol-sulfuric acid method. (C) Silkworms were fed a normal diet (N.D.) or a diet containing 10% (w/w) glucose (G.D.) for 18 h, and then the diets were removed. Silkworm hemolymph sugar levels were determined after starvation for 24 h (n = 5-7/group). Data represent mean ± SEM. Significant differences between groups were evaluated using Student’s t-test.
Figure 5
Figure 5. Impaired glucose tolerance of the hyperlipidemic silkworm.
(A) Experimental design. (B) Silkworms were fed a normal diet (N.D.) or a diet containing 10% (w/w) glucose (G.D.) for 18 h, and then the diets were removed. After incubation for 24 h, 100 μl of glucose (75 mg/ml) was injected into the silkworm hemolymph and the hemolymph sugar levels were determined at 0, 15, 30, 60, 90, and 120 min (n = 5/group). Data represent mean ± SEM. Asterisks indicate statistical significance based on Student’s t-test (p < 0.05). (C) Area under the curves of hemolymph sugar levels in Fig. 5B were calculated (n = 5/group). Data represent mean ± SEM. Significant differences between groups were evaluated using Student’s t-test. (D) Silkworms were fed a normal diet (N.D.) or a diet containing 10% (w/w) glucose (G.D.) for 18 h, and then the diets were removed. After 24 h, 100 μl of glucose (75 mg/ml) was injected into the silkworm hemolymph and the silkworms were further kept for 30 min. Phosphorylated Akt, phosphorylated JNK, phosphorylated AMPK and β -actin in the fat bodies were determined by Western blot analysis. Samples were loaded in the same gel. Cropped blots were used. Full-length blots are presented in Supplementary Fig. 6.
Figure 6
Figure 6. Decrease in fasting hemolymph sugar levels in the hyperlipidemic silkworm by administration of pioglitazone and metformin.
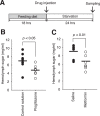
(A) Experimental design. (B,C) Silkworms were fed a diet containing 10% (w/w) glucose (G.D.) for 18 h. (B) Pioglitazone (250 μg/larvae) or control solution (0.01 M HCl in PBS) was injected into the silkworm hemolymph. (C) Metformin (200 μg/larvae) or saline (0.9% NaCl) was injected into the silkworm hemolymph. Hemolymph sugar levels of the silkworms were determined after starvation for 24 h (n = 7-8/group). Bar represents mean. Significant differences between groups were evaluated using Student’s t-test.
Figure 7
Figure 7. Improved glucose tolerance in the hyperlipidemic silkworm by administration of pioglitazone or metformin based on a glucose tolerance test.
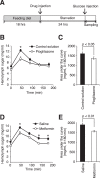
(A) Experimental design. (B,C) Silkworms were fed a diet containing 10% (w/w) glucose (G.D.) for 18 h, and then the diets were removed. (B) Pioglitazone (250 μg/larvae) or control solution (0.01 M HCl in PBS) was injected into the silkworm hemolymph. After incubation for 24 h, 100 μl of glucose (75 mg/ml) was injected into the silkworm hemolymph and hemolymph sugar levels were determined at 0, 45, 90, 135, and 180 min (n = 8/group). Data represent mean ± SEM. Asterisks indicate statistical significance based on Student’s t-test (p < 0.05). (C) Area under the curves of hemolymph sugar levels in Fig. 7B were calculated (n = 8/group). Data represent mean ± SEM. Significant differences between groups were evaluated using Student’s t-test. (D,E) Silkworms were fed a diet containing 10% (w/w) glucose (G.D.) for 18 h, and then the diets were removed. (D) Metformin (200 μg/larvae) or saline (0.9% NaCl) was injected into the silkworm hemolymph. After incubation for 24 h, 100 μl of glucose (75 mg/ml) was injected into the silkworm hemolymph and hemolymph sugar levels were determined at 0, 45, 90, 135, and 180 min (n = 7/group). Data represent mean ± SEM. Asterisks indicate statistical significance analyzed by Student’s t-test (p < 0.05). (E) Area under the curves of hemolymph sugar levels in Fig. 7D were calculated (n = 7/group). Data represent mean ± SEM. Significant differences between groups were evaluated using Student’s t-test.

Similar articles

Cited by

References

    1. Carver C. Insulin treatment and the problem of weight gain in type 2 diabetes. Diabetes Educ 32, 910–917, 10.1177/0145721706294259 (2006). - DOI - PubMed
    1. Fonseca V. A. & Haggar M. A. Achieving glycaemic targets with basal insulin in T2DM by individualizing treatment. Nat Rev Endocrinol 10, 276–281, 10.1038/nrendo.2014.17 (2014). - DOI - PubMed
    1. Zimmet P., Alberti K. G. & Shaw J. Global and societal implications of the diabetes epidemic. Nature 414, 782–787, 10.1038/414782a (2001). - DOI - PubMed
    1. Kahn B. B. Type 2 diabetes: when insulin secretion fails to compensate for insulin resistance. Cell 92, 593–596 (1998). - PubMed
    1. Yki-Jarvinen H. Thiazolidinediones. N Engl J Med 351, 1106–1118, 10.1056/NEJMra041001 (2004). - DOI - PubMed

Publication types

MeSH terms