. 2016 Jan;23(1):89-98.
doi: 10.1038/cdd.2015.42. Epub 2015 May 29.

NF-κB pathway controls mitochondrial dynamics

Affiliations

NF-κB pathway controls mitochondrial dynamics

M Laforge et al. Cell Death Differ. 2016 Jan.

Abstract

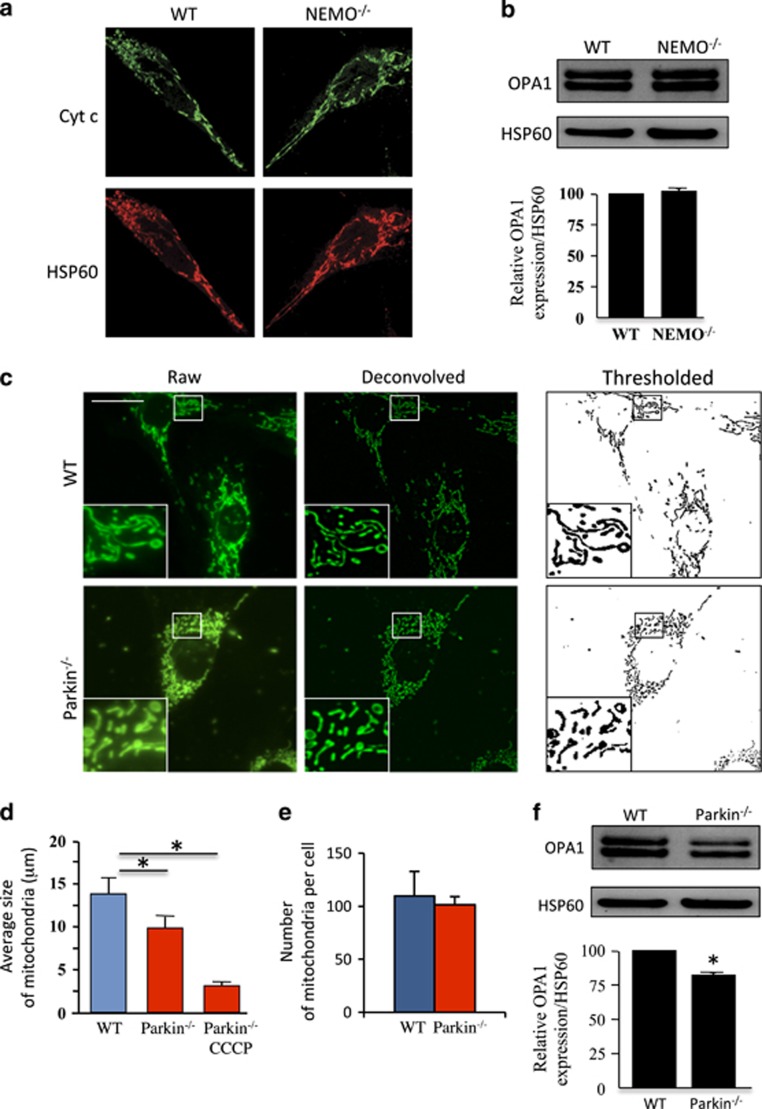
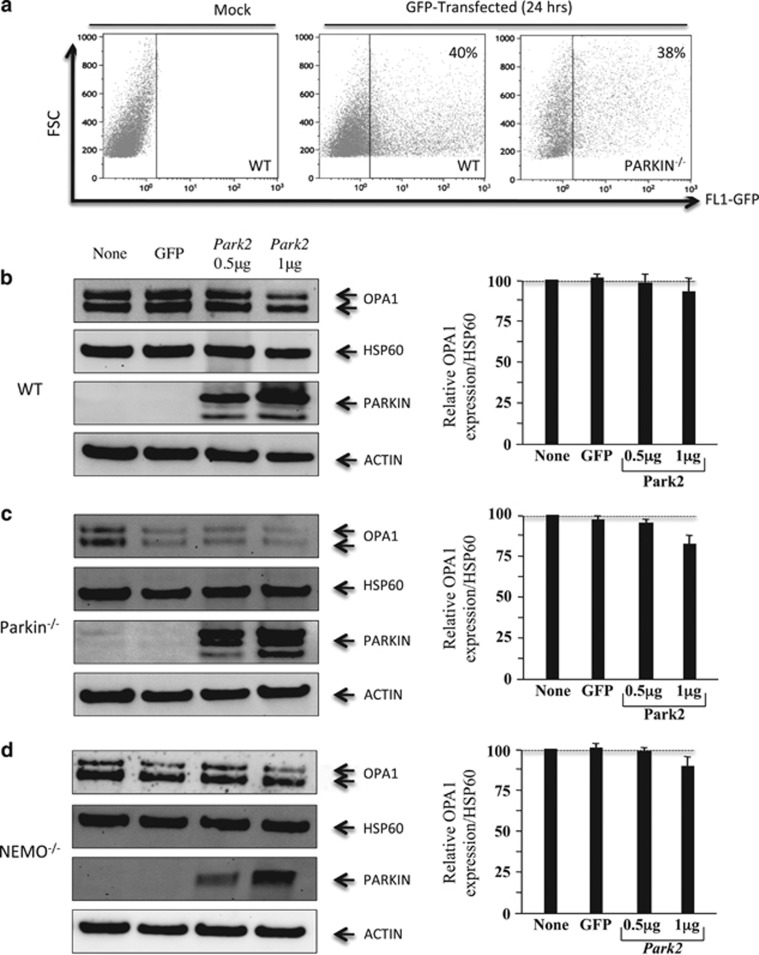
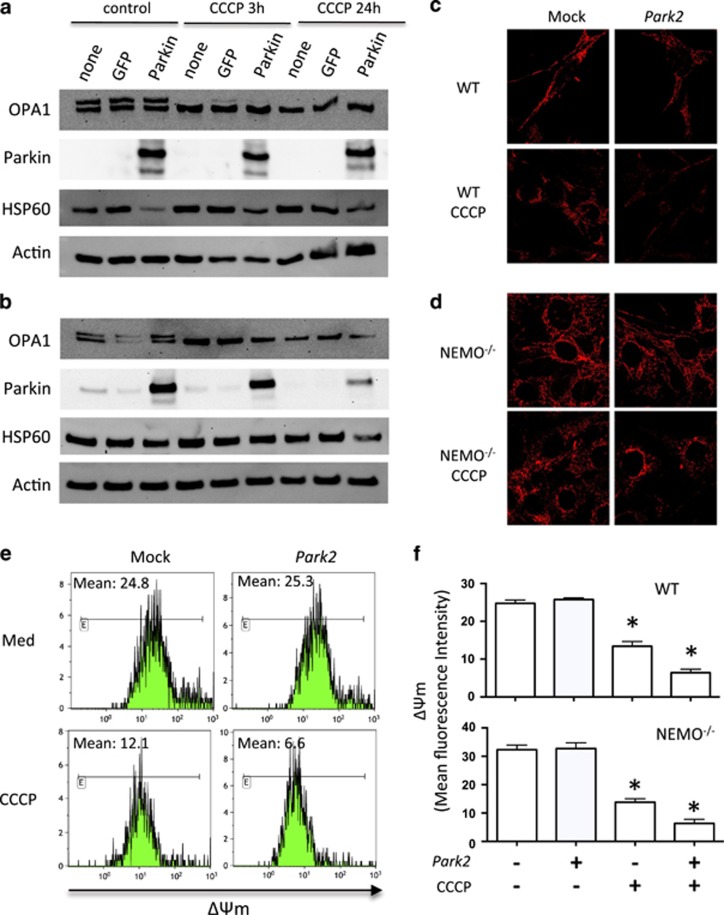
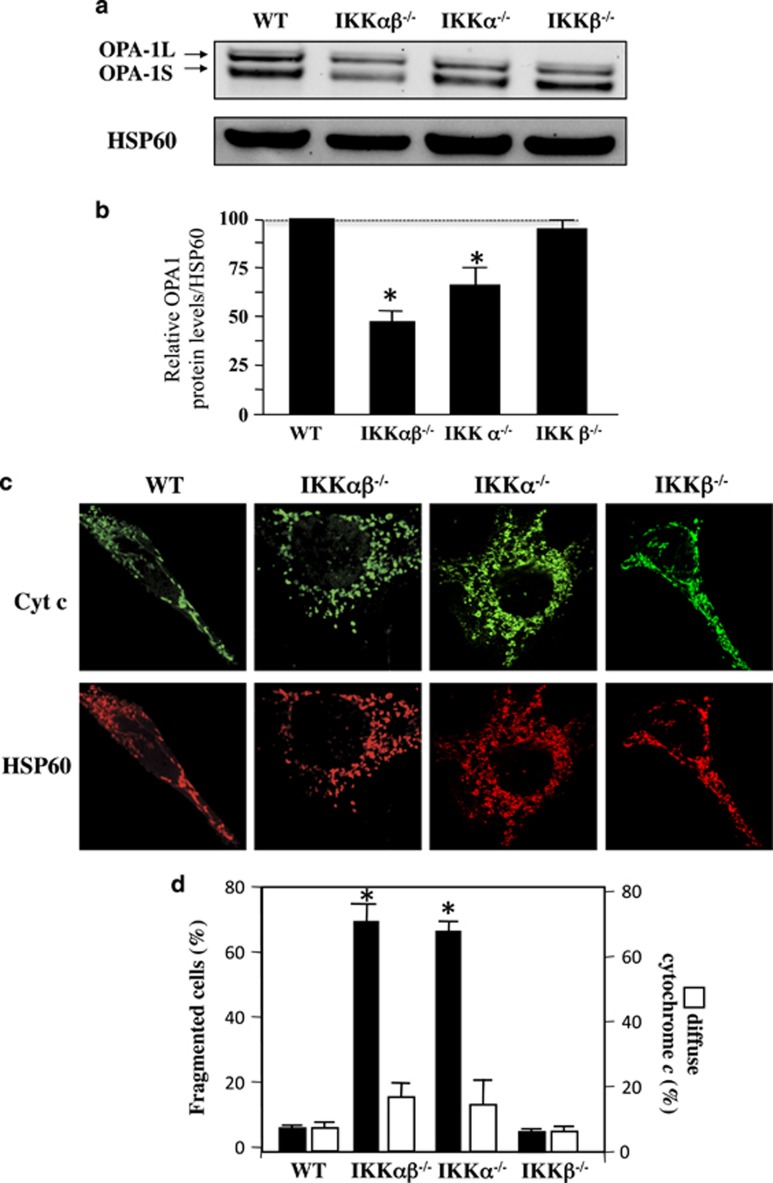
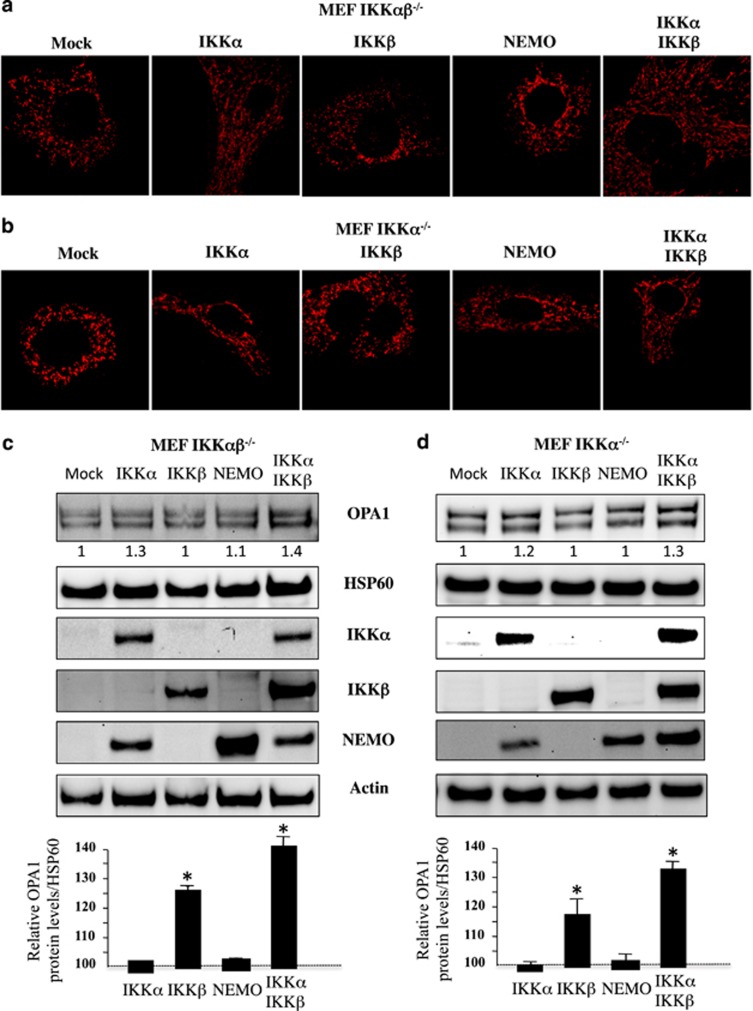
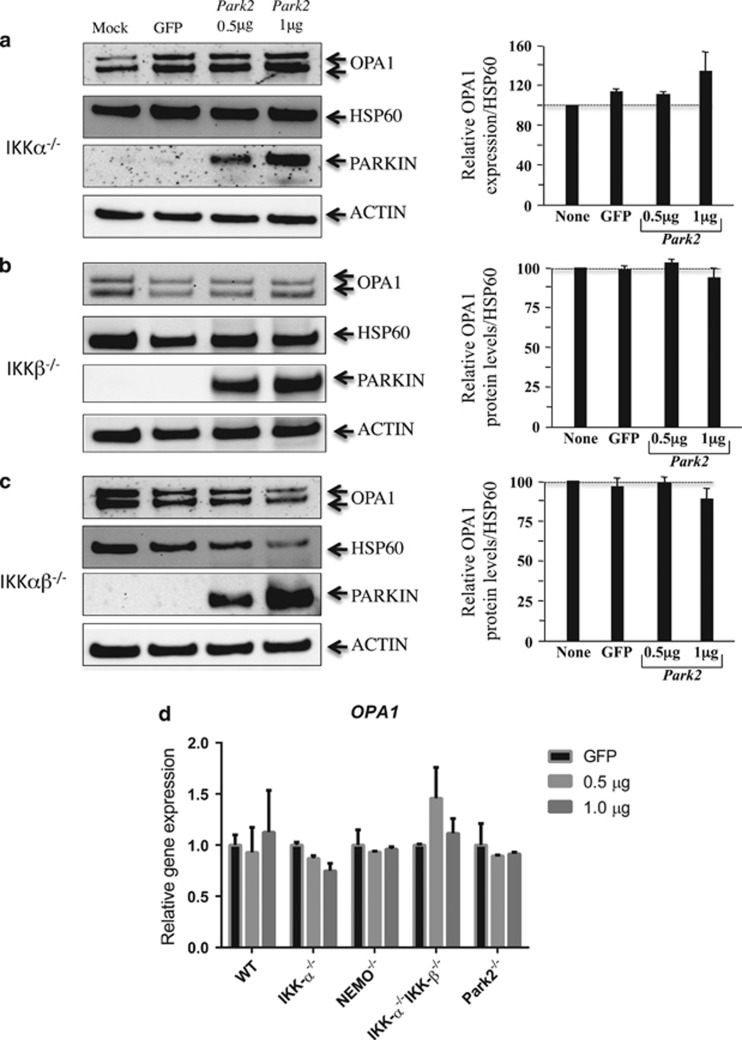
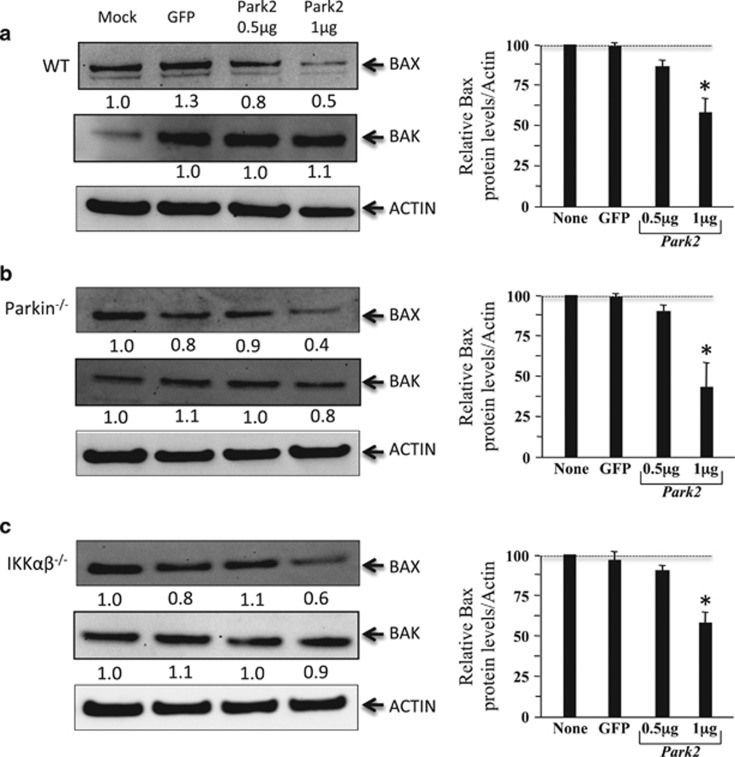
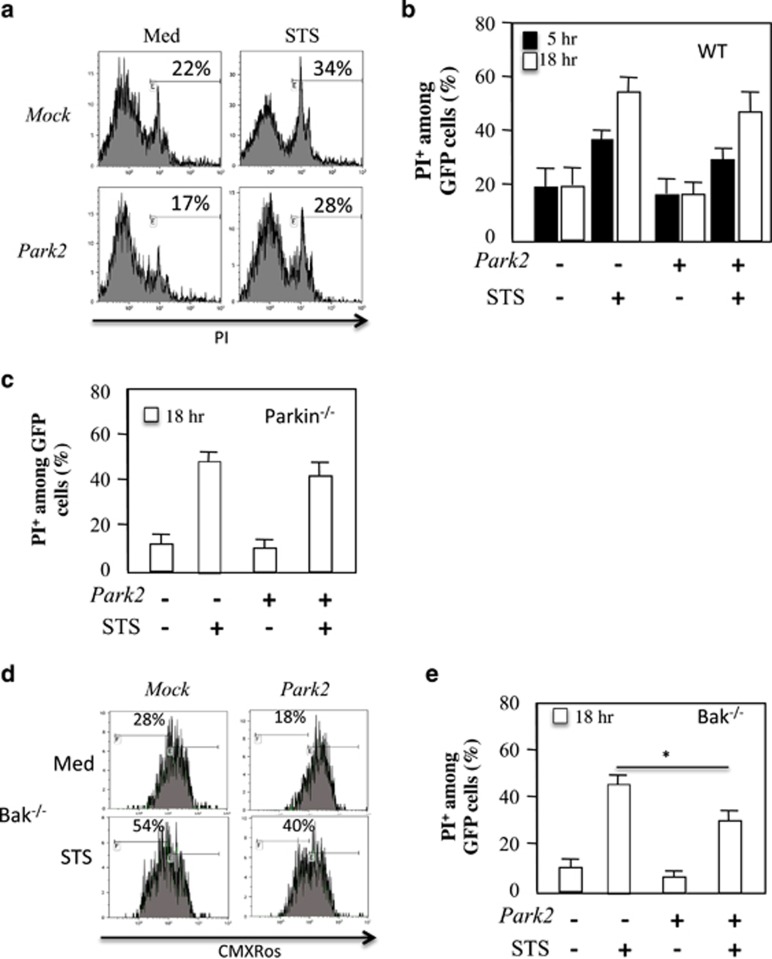
The Optic atrophy 1 protein (OPA1) is a key element in the dynamics and morphology of mitochondria. We demonstrated that the absence of IκB kinase-α, which is a key element of the nonclassical NF-κB pathway, has an impact on the mitochondrial network morphology and OPA1 expression. In contrast, the absence of NF-κB essential modulator (NEMO) or IκB kinase-β, both of which are essential for the canonical NF-κB pathway, has no impact on mitochondrial dynamics. Whereas Parkin has been reported to positively regulate the expression of OPA1 through NEMO, herein we found that PARK2 overexpression did not modify the expression of OPA1. PARK2 expression reduced the levels of Bax, and it prevented stress-induced cell death only in Bak-deficient mouse embryonic fibroblast cells. Collectively, our results point out a role of the nonclassical NF-κB pathway in the regulation of mitochondrial dynamics and OPA1 expression.


Figures

Figure 1
Figure 1
Mitochondrial morphology and OPA1 expression in NEMO- and Parkin-deficient MEF cells. (a) WT and NEMO−/− cells were stained with specific antibodies directed against cytochrome c (Cyt c, in green) and Hsp60 (in red). (b) OPA1 profile in WT and NEMO−/−. Immunoblot was probed with specific OPA1 antibodies. Hsp60 was used as a loading control to normalize protein content. Results correspond to the mean of three experiments. (c) Mitochondrial network in WT and Parkin−/− cells. MEFs were stained with MitoTracker Green and imaged on an inverted microscope to obtain raw epifluorescence images (left panels). Deconvolved images (center panels) were obtained by subtracting a Gaussian blur (σ: 12) to the original images. Deconvolved images were then thresholded to obtain a binary image of the mitochondrial network (right panels) used for the automatized analysis of the size and the number of mitochondria in each individual cell. (d and e) Bar graphs showing (d) the average number and (e) the average size of mitochondria in WT and Parkin−/− MEFs in the absence or presence of CCCP (n=130, 136, and 120, respectively). (f) OPA1 profile in WT and Parkin−/− MEFs. Immunoblot was probed with specific OPA1 antibodies. Hsp60 was used as a loading control to normalize protein content. Results are from three experiments, *P<0.05
Figure 2
Figure 2
OPA1 protein expression in Parkin-tranfected MEF cells. (a) Efficiency of cell transfection. Cells were cotransfected with Parkin and GFP (1 μg) or mock. Green fluorescent intensity was determined by flow cytometry after 24 h (bd). Profile of OPA1 expression in WT, Parkin−/−, and NEMO−/− MEFs (left panels), and quantification of the amount of OPA1 isoforms (right panels). The values indicate the relative levels of the long isoforms with respect to the baseline (value 1), in the absence (none) or after 24 h of transfection with either a GFP or PARK2 vector at the dose of 0.5 and 1 μg. HSP60 was used as a loading control to normalize protein content. Immunoblots were also probed with specific Parkin antibodies. Actin was used as a loading control. Four experiments were performed
Figure 3
Figure 3
Park2 overexpression in stressed MEF cells. (a) Profile of OPA1 expression in WT and (b) NEMO−/− MEFs. Cells were transfected with Park2 at a dose of 1 μg. OPA1 expression was assessed at 3 and 24 h in the absence or presence of CCCP. Hsp60 and actin were used as loading controls to normalize protein content. (c) WT and (d) NEMO−/− MEF cells were stained with specific antibodies directed against Hsp60 (in red). Mitochondrial network was analyzed after overexpression of Park2 in the absence or presence of CCCP after 24 h. (e) Mitochondrial membrane potential of WT MEF cells assessed by flow cytometry in the absence or presence of CCCP. (f) Histograms of ΔΨm from WT and NEMO−/− MEF cells (mean fluorescence intensity) of transfected Park2 cells in the absence or presence of CCCP. Mean±SD of three independent experiments; *P<0.05
Figure 4
Figure 4
Mitochondrial fragmentation and OPA1 loss in IKKα- and IKKαβ-deficient MEFs. (a) OPA1 profile in WT, IKKαβ−/−, IKKα−/−, and IKKβ−/− MEFs. Immunoblot was probed with specific OPA1 antibodies. Hsp60 was used as loading control to normalize protein content. (b) Results correspond to the mean of three experiments. *P<0.05 compared with WT and IKKβ−/− MEF cells. (c) WT and in IKKαβ−/− and IKKα−/− cells were stained with specific antibodies directed against cytochrome c (Cyt c, in green) and HSP60 (in red). (d) The histograms show the percentage of cells displaying mitochondrial fragmentation (% fragmented mitochondria) and the release and disappearance of cytochrome c (% diffuse Cyt c). For each condition, 150 cells were analyzed. Mean±S.D. of three independent experiments; *P<0.05
Figure 5
Figure 5
Mitochondrial network fragmentation and OPA1 expression. (a, c) IKKαβ−/− and (b, d) IKKα−/− MEF cells were transfected with plasmids encoding for IKKα, IKKβ, NEMO, or both IKKα+IKKβ at the dose of 1 μg, mock serves as a control. (a and b) After overnight culture, cells were stained with specific antibodies directed against HSP60 (in red) and mitochondrial fragmentation was analyzed (c and d) OPA1 expression. As control Hsp60 was used as loading control to normalize protein content. Furthermore immunoblots were probed with specific antibodies to IKKα, IKKβ, and NEMO. Actin was used as a control. Mean±S.D. of three independent experiments; *P<0.05
Figure 6
Figure 6
OPA1 expression in Parkin-transfected MEF cells. (a) IKKα−/−, (b) IKKβ−/−, and (c) IKKαβ−/−. MEFs were cotransfected with vectors encoding PARK2, GFP, or mock. The values indicate the relative levels of the long isoforms with respect to the baseline (value 1), in the absence (mock) or after 24 h of transfection with either GFP or PARK2 at the dose of 0.5 and 1 μg. HSP60 was used as a loading control to normalize protein content. Immunoblots were also probed with specific Parkin antibodies. Actin was used as a loading control. Four experiments were performed. (d) mRNA expression of OPA1 in Parkin–transfected MEF cells. RT-PCRs were performed in WT, IKKα−/−, NEMO−/−, IKKαβ−/−, and Parkin−/−. The values indicate the relative gene expression of OPA1 with respect to the GFP baseline (value set as 1). Two experiments were performed
Figure 7
Figure 7
Modulation of Bax and Bak expressions in Parkin-transfected MEF cells. Immunoblots from (a) WT, (b) Parkin−/− and (c) Ikkαβ−/− as described in Figure 2 and Figure 6 were probed with Bax and Bak antibodies. Values indicate Bax and Bak levels with respect to the baseline (mock, value set as 1) and to actin as a control of loading. Histograms represent mean±S.D. of three independent experiments; *P<0.05
Figure 8
Figure 8
Ovexpression of Park2 prevents cell death in Bak-deficient MEF cells. (a) Flow cytometry of WT MEF cells transfected with vectors encoding for PARK2 and GFP. Cells were treated or not with STS, 500 nM. Cells were gated on GFP and PI staining is shown. Percentage of dying (b) WT and (c) Parkin−/− MEF cells was analyzed at 5 and 18 h after STS treatment. (d) Flow cytometry of Bak−/− MEF cells transfected with vectors encoding for PARK2 and treated with Staurosporine (STS, 500 nM). Cells were stained with CMXRos. Mitochondrial depolarization is shown. (e) Percentage of dying Bak-deficient MEF cells is shown. Histograms represent mean±S.D. of three independent experiments; *P<0.05

References

    1. Narendra D, Tanaka A, Suen DF, Youle RJ. Parkin-induced mitophagy in the pathogenesis of Parkinson disease. Autophagy 2009; 5: 706–708. - PubMed
    1. Cherra SJ 3rd, Dagda RK, Tandon A, Chu CT. Mitochondrial autophagy as a compensatory response to PINK1 deficiency. Autophagy 2009; 5: 1213–1214. - PMC - PubMed
    1. Vives-Bauza C, Zhou C, Huang Y, Cui M, de Vries RL, Kim J et al. PINK1-dependent recruitment of Parkin to mitochondria in mitophagy. Proc Natl Acad Sci USA 2010; 107: 378–383. - PMC - PubMed
    1. Matsuda N, Sato S, Shiba K, Okatsu K, Saisho K, Gautier CA et al. PINK1 stabilized by mitochondrial depolarization recruits Parkin to damaged mitochondria and activates latent Parkin for mitophagy. J Cell Biol 2010; 189: 211–221. - PMC - PubMed
    1. Chen H, Detmer SA, Ewald AJ, Griffin EE, Fraser SE, Chan DC. Mitofusins Mfn1 and Mfn2 coordinately regulate mitochondrial fusion and are essential for embryonic development. J Cell Biol 2003; 160: 189–200. - PMC - PubMed

Publication types

MeSH terms