. 2015 May 29;10(5):e0126947.
doi: 10.1371/journal.pone.0126947. eCollection 2015.

The Homeobox Genes of Caenorhabditis elegans and Insights into Their Spatio-Temporal Expression Dynamics during Embryogenesis

Affiliations

The Homeobox Genes of Caenorhabditis elegans and Insights into Their Spatio-Temporal Expression Dynamics during Embryogenesis

Jürgen Hench et al. PLoS One. .

Abstract

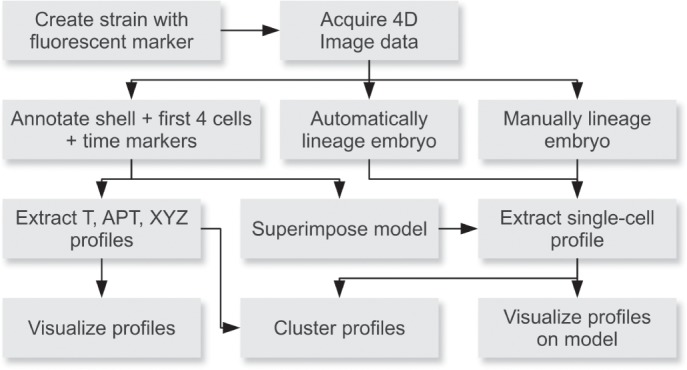
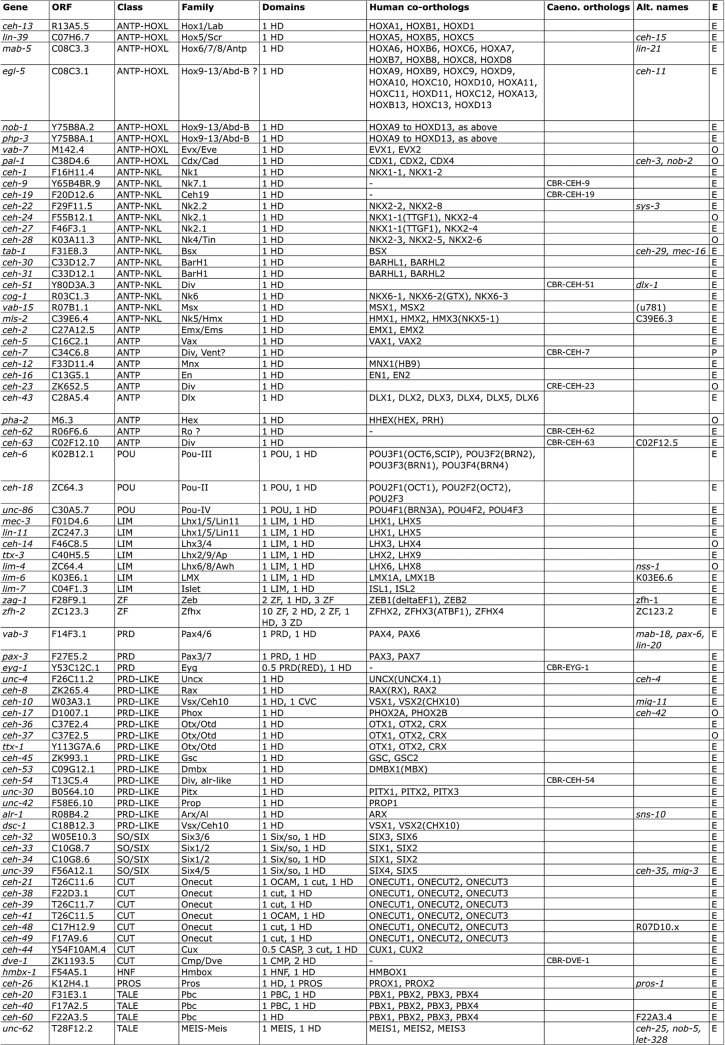
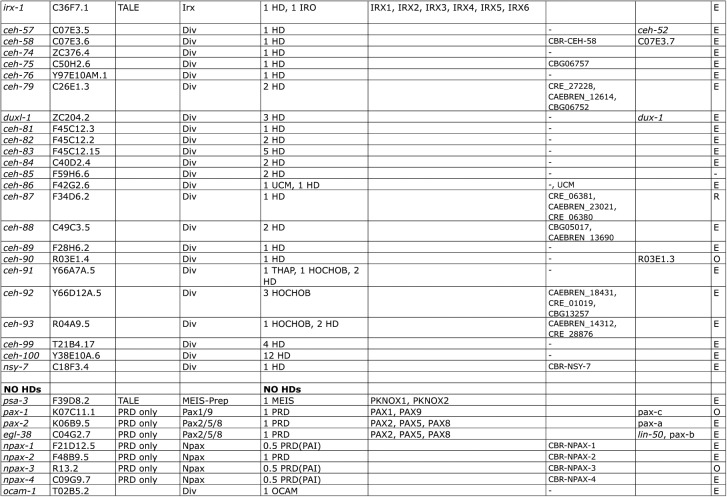
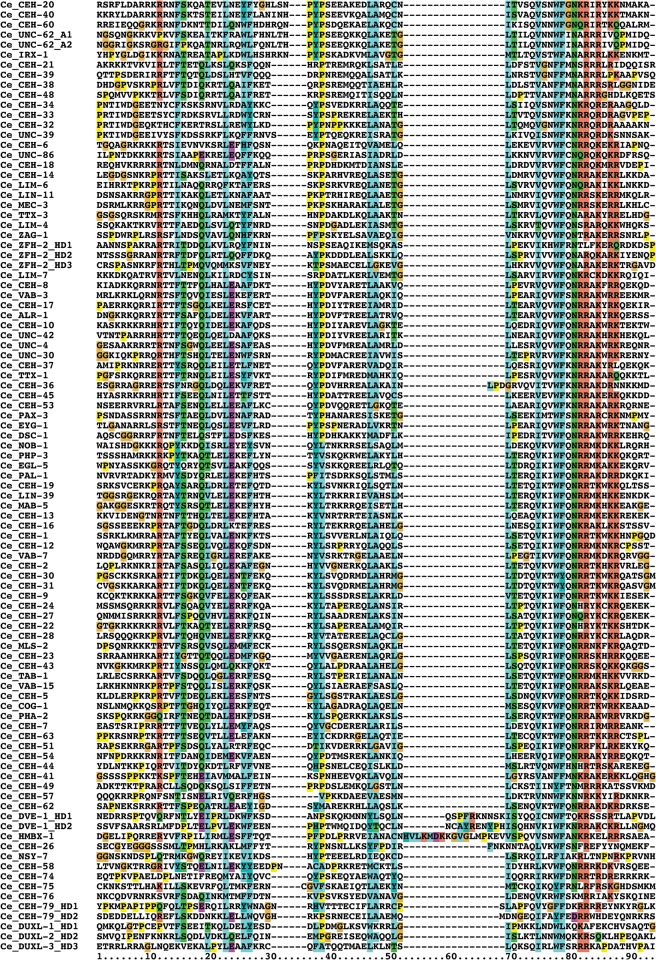
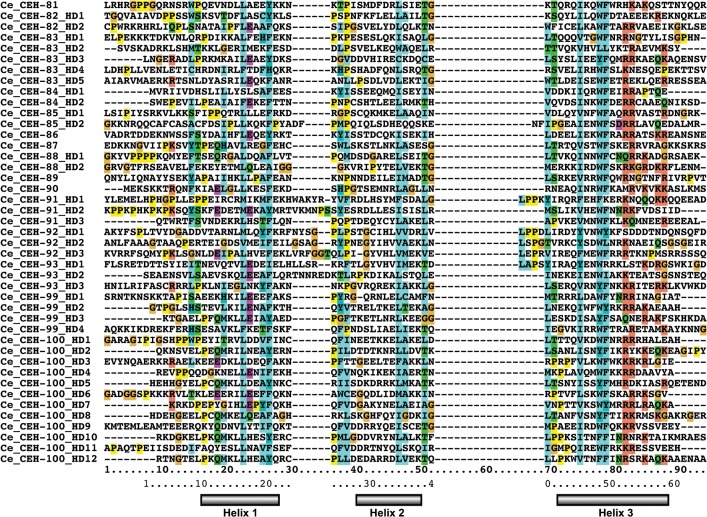
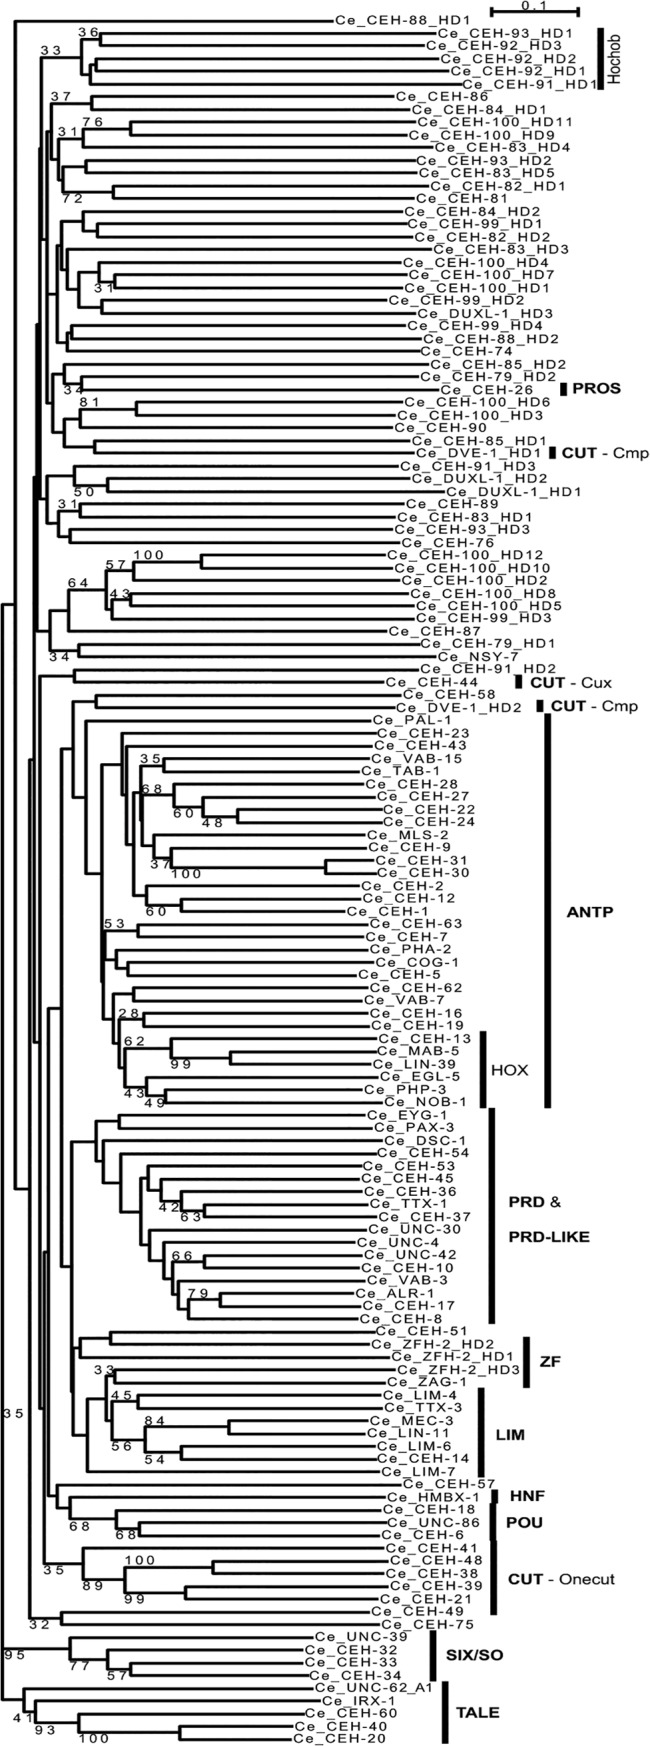
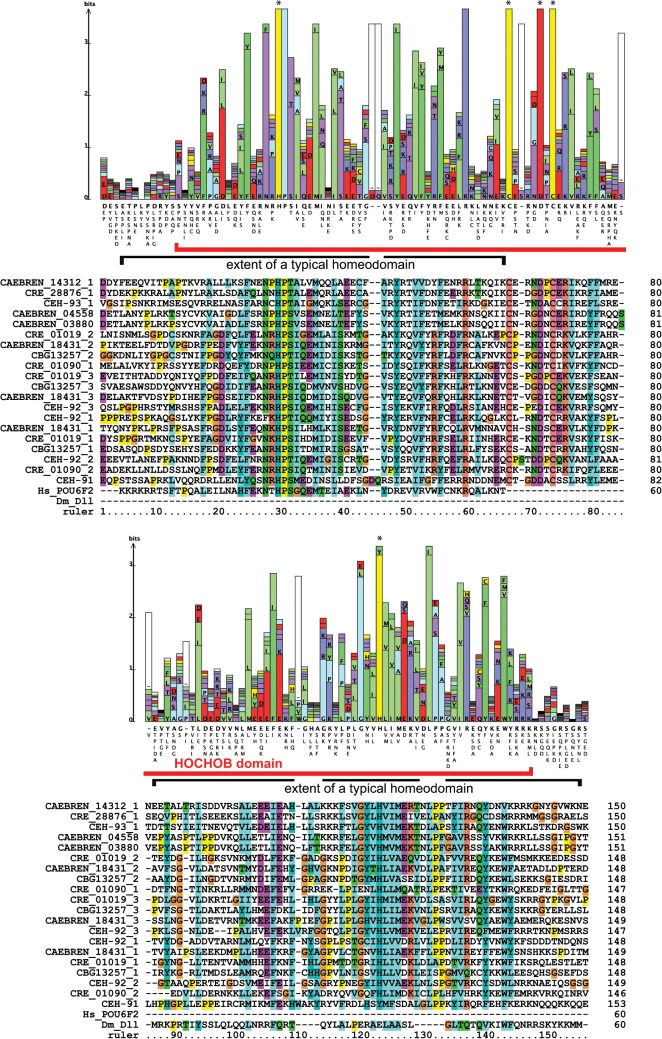
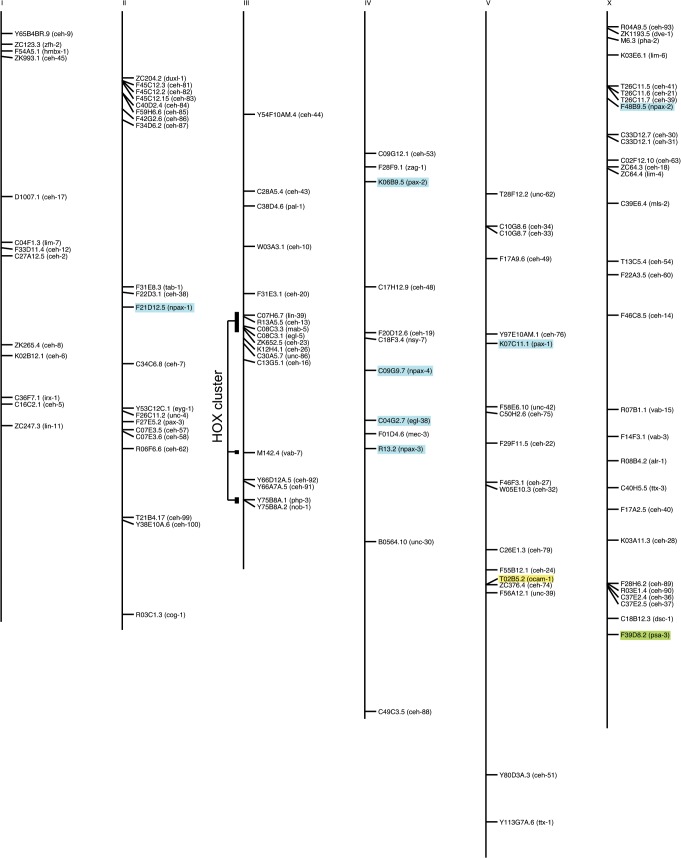
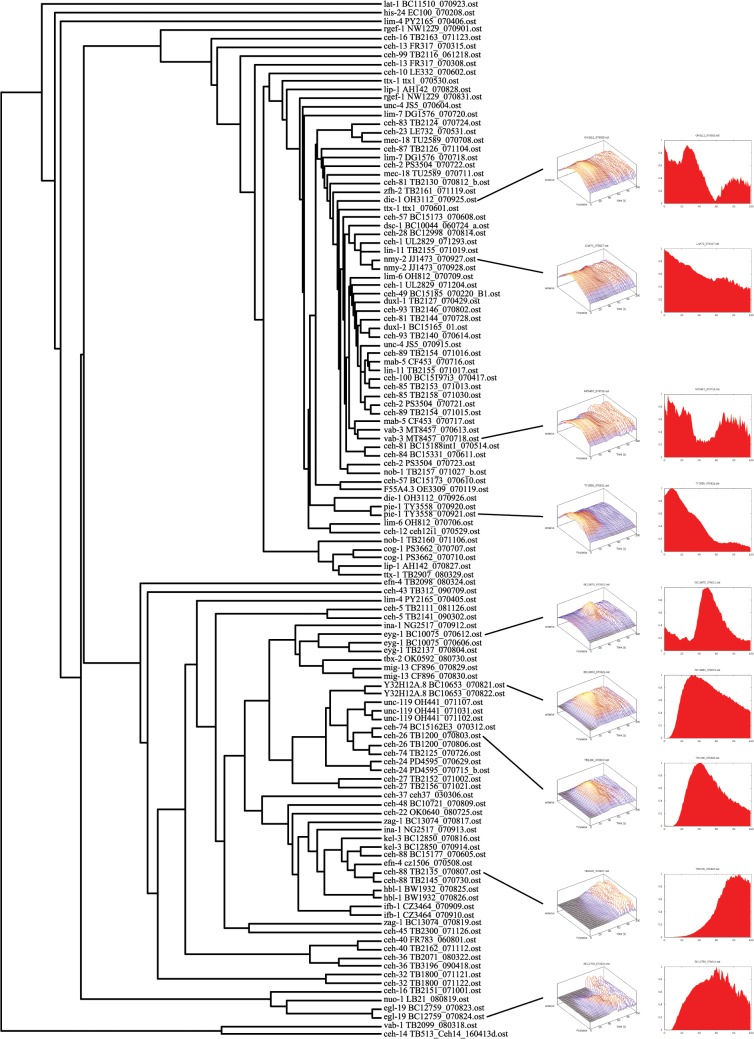
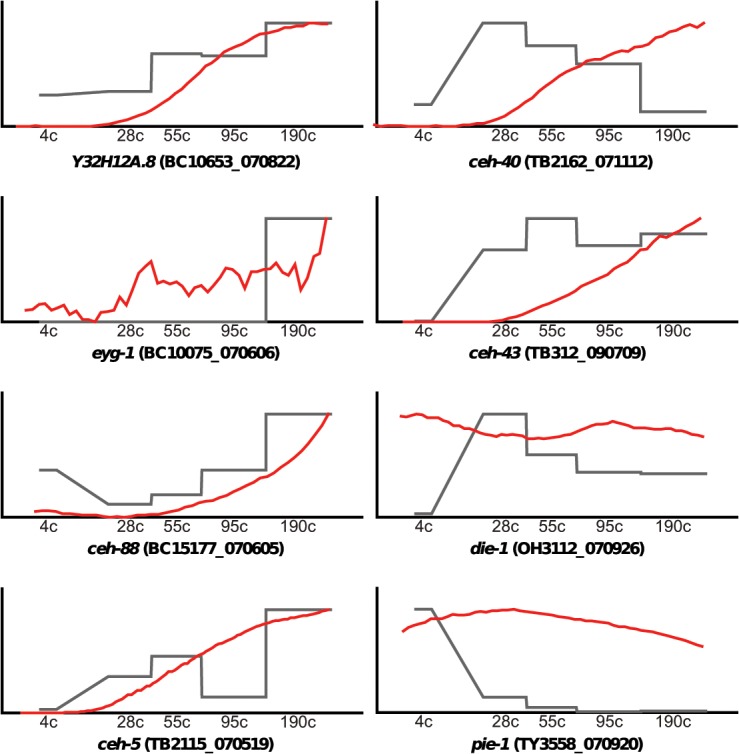
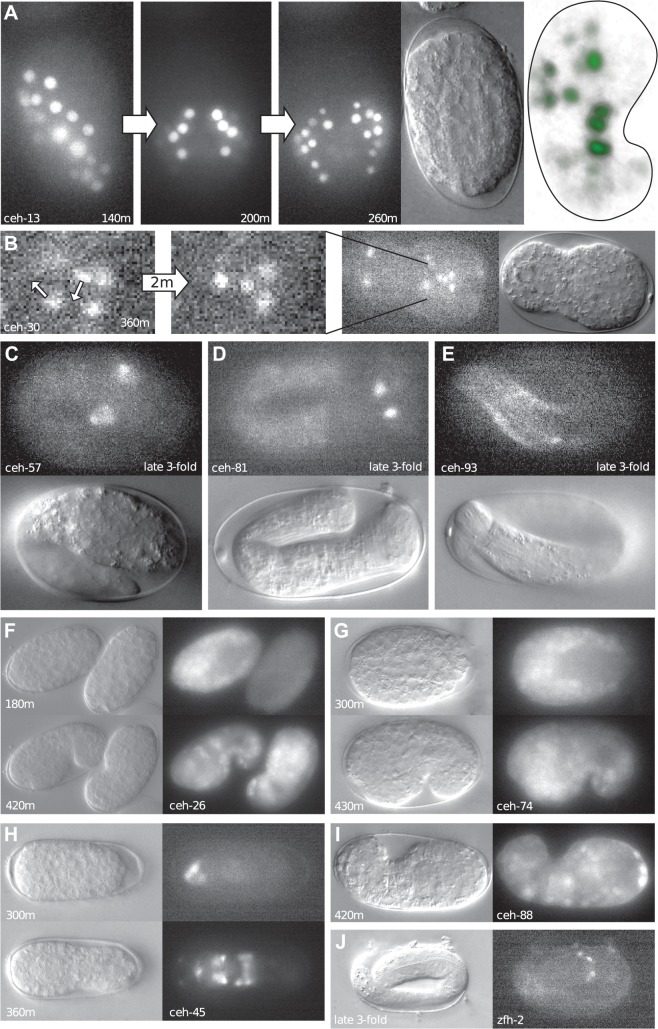
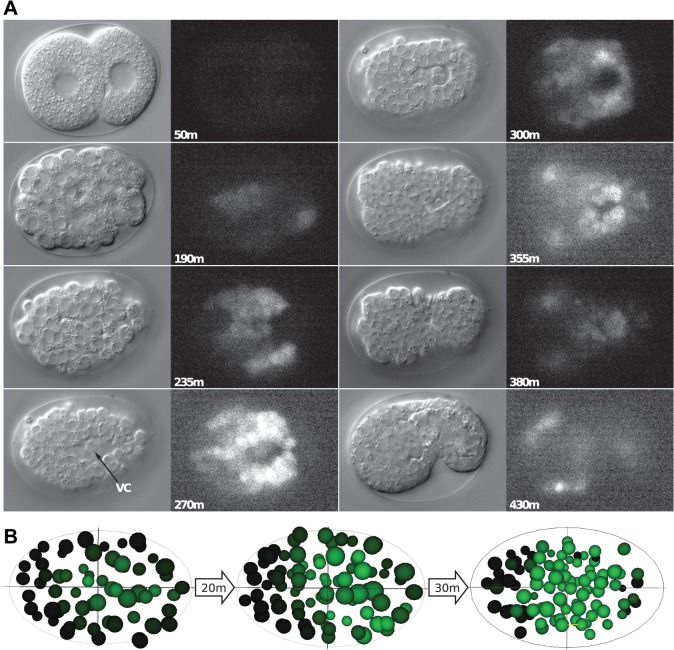
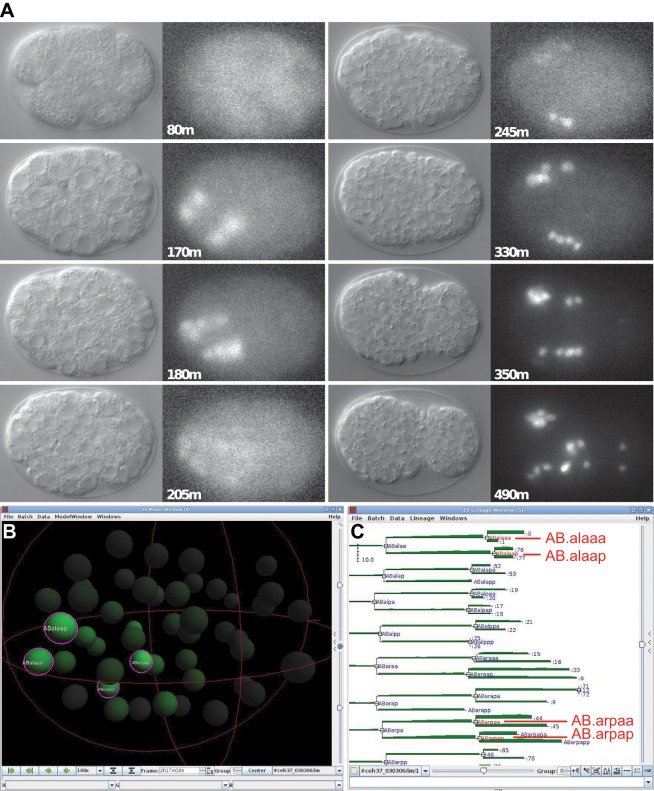
Homeobox genes play crucial roles for the development of multicellular eukaryotes. We have generated a revised list of all homeobox genes for Caenorhabditis elegans and provide a nomenclature for the previously unnamed ones. We show that, out of 103 homeobox genes, 70 are co-orthologous to human homeobox genes. 14 are highly divergent, lacking an obvious ortholog even in other Caenorhabditis species. One of these homeobox genes encodes 12 homeodomains, while three other highly divergent homeobox genes encode a novel type of double homeodomain, termed HOCHOB. To understand how transcription factors regulate cell fate during development, precise spatio-temporal expression data need to be obtained. Using a new imaging framework that we developed, Endrov, we have generated spatio-temporal expression profiles during embryogenesis of over 60 homeobox genes, as well as a number of other developmental control genes using GFP reporters. We used dynamic feedback during recording to automatically adjust the camera exposure time in order to increase the dynamic range beyond the limitations of the camera. We have applied the new framework to examine homeobox gene expression patterns and provide an analysis of these patterns. The methods we developed to analyze and quantify expression data are not only suitable for C. elegans, but can be applied to other model systems or even to tissue culture systems.


Conflict of interest statement

Competing Interests: The authors have declared that no competing interests exist.

Figures

Fig 1
Fig 1. The 4D analysis workflow.
Multiple strategies for profiling expression patterns have been implemented in Endrov. The most basic strategy extracts “fingerprint” profiles over anterior-posterior and time, ignoring cell coordinates. At a higher level, a reference model is superimposed after annotating the first four cells and several reference time points. The pipeline also allows manual lineaging.
Fig 2
Fig 2. List of C. elegans homeobox genes and human orthologs.
Gene names (gene) as well as WormBase sequence names (ORF) are given. At the bottom of the list under the “No HD” heading are genes related to homeobox genes that lack a HD. psa-3 is a TALE homeobox gene with a MEIS domain that secondarily lost its HD. egl-38, pax-1, pax-2 encode a Paired (PRD) domain only (Pax genes in vertebrates encode a PRD domain and may or may not encode a HD), and several npax genes encode only the first half of a PRD domain (PAI) [60]. ocam-1 encodes an OCAM domain (Onecut associated motif) also found in some C. elegans Onecut genes [61]. The class column gives the class or superclass based on previous classifications [2, 31, 35, 36]. In the case of the Antennapedia (ANTP) superclass, the class division into NK-like (NKL) and HOX and related genes (HOXL) is indicated. ANTP genes that cannot be confidently assigned to one or the other family are simply designated as ANTP superclass genes. Family refers to the specific gene families that individual homeobox genes can be assigned to. A family is ideally conserved across the bilaterian divide. In some cases, it was possible to assign a class, but not a family. “Div.” indicates divergent genes that could not be classified confidently at the class or family level. The domain column lists the various domains found within the protein product of a gene as previously defined [2, 31, 35, 36]. The CVC domain is specific to the Vsx/Ceh10 family [62, 63]. The THAP domain is a zinc-binding motif [64], HOCHOB is defined here, and “UCM” is a presently uncharacterized motif with conserved cysteine residues (S4 Fig). Some smaller motifs (e.g., hexapeptide aka pentapeptide, octapeptide aka EH1 aka TN, etc.) are not indicated. Note that several proteins have multiple HDs, the number of each domain is given. In cases where a 0.5 is given, the domain is split, i.e. eyg-1 encodes only the second half of the PRD domain (RED), and ceh-44 incorporates the N-terminal half of CASP through alternative splicing [61]. The human co-orthologs column lists the human orthologs for the C. elegans genes. In many cases, there is no direct one-to-one correspondence, because of gene duplication in the vertebrate lineage, and in some instances also due to gene duplication within the nematode lineage. Hence, vab-7 has two orthologs in humans, i.e. it is co-orthologous to EVX1 and EVX2. A number of homeobox genes lacked obvious human orthologs. In these cases, in order to examine the level of conservation of these divergent (Div.) homeobox genes, we conducted reciprocal blast searches against other Caenorhabditis species. In several instances we found matches in, e.g., C. remanei, C. brenneri, and C. briggsae. The “Caeno. orthologs” column lists selected orthologs that were found, indicating at least conservation to other Caenorhabditis species. Most importantly, a dash indicates that no ortholog was found in any other species, revealing fast evolving genes that must have arisen recently in the C. elegans lineage. The penultimate column lists alternative gene or ORF names. The last column (E) indicates whether a gene is transcribed based on transcript data. E indicates ESTs (WormBase). If no ESTs are present, OSTs (O), or Race (R) are taken as evidence for transcription. P indicates evidence based on RT-PCR [65].
Fig 3
Fig 3. Second part of Fig 2.
Fig 4
Fig 4. Multiple sequence alignment of C. elegans HDs.
The standard numbering of a typical HD with 60 residues is given at the bottom, and the grey bars denote the extent of the three alpha helixes of the HD. Multiple HD within the same protein are denoted with HD1, HD2 etc. Note that a number of sequences have extra residues in loop 1 and/or loop 2 of the HD. UNC-62 has two different isoforms of the HD (suffixed as A1 and A2) due to alternative splicing [66, 67]. Unusually, three extra residues (ITV) in the HD of CEH-36 are inserted just upstream of the conserved WF (S1 Fig) through a shift in the location of a splice site. The three residues conform with residues expected at that position of the HD. Thus, it is likely that the N-terminal region of helix 3 is shifted so that the extra residues are effectively accommodated in the loop region between helix 2 and 3, as shown here, which allows the structure to be maintained. The currently predicted ORF of CEH-85 starts with the methionine residue in the middle of the HD1. Extending the ORF on the genome gives a good match to helix 1 of the HD, but presently no further upstream methionine or splice site can be found, hence the HD may only be partial (we thank John Spieth for the analysis). In a few of the proteins, some of the HDs are tightly packed with no space between the domains, and they can be as short as, e.g., 55 residues instead of the normal 60 in CEH-100_HD7. Overall we find 137 HDs plus 10 HOCHOB HDs (see below). Note that the first HDs of HOCHOB are not presented in this alignment, due to their lack of conservation of the WF motif. This alignment (except UNC-62_A2 and CEH-83_HD2) was used for creating a protein logo (see S1 Fig) and the phylogenetic tree (Fig 6).
Fig 5
Fig 5. Second part of Fig 4.
Fig 6
Fig 6. Phylogenetic tree of the HD sequences.
Neighbor joining was carried out using the sequences from Figs 4 and 5. 100 bootstrap runs were carried out and bootstrap values larger than 30 are shown in the figure. The root was placed between the TALE HDs and the other HDs. The different classes/superclasses are indicated.
Fig 7
Fig 7. The HOCHOB domain.
Multiple sequence alignment of Caenorhabditis HOCHOB domains. Multiple HOCHOB domains in the same protein are indexed with 1, 2, and 3. The matching protein logo above the alignment was generated using LogoBar. Stars denote highly conserved cysteine, histidine and aspartic acid residues. The red bar denotes the HOCHOB domain, and the extent of normal HDs is indicated underneath.
Fig 8
Fig 8. Chromosomal location of homeobox genes and related genes.
The HOX cluster genes are indicated. PRD domain only encoding genes are marked in blue, the TALE gene psa-3 that lost its homeobox is marked in green, and the ocam-1 gene is marked in yellow. Clusters of homeobox genes are described in Table 3. Noteworthy are the grouped genes on the left arm of chromosome II, i.e., ceh-81 to ceh-87 and duxl-1. Most of these genes are all highly divergent, except ceh-81 and ceh-82, which show similarity to each other. Many have multiple homeoboxes, and most do not have an ortholog in other Caenorhabditis species, except ceh-87.
Fig 9
Fig 9. Dendrogram of recordings clustered based on APT profiles and Pearson correlation.
Clustering based on Pearson correlation was carried out using 122 APT expression profiles. Leaves indicate the gene, strain, and recording. Example expression patterns as APT and T profiles are shown on the right. Recordings of the same or similar reporter constructs usually group together. The clades in the upper half of the tree with short branch lengths (approximately between the “ttx-1 TB2901_080329” and “ceh-10 LE332_070602” leaves) is comprised primarily of recordings that have no or late expression. The APT profiles of late expression patterns are subject to substantial variations, due to the moving embryo. This can even mask restricted expression patterns, since the location of the signal can change between individual Z-planes and is therefore subject to an averaging effect over the whole stack.
Fig 10
Fig 10. Comparison of T profiles against microarray data of staged embryos.
Profiles of eight genes are shown, the remainder is available in the online material. The X-axis shows the different staged embryos according [56] and the microarray data are plotted in grey. The T profiles (red) have been cropped to only show the corresponding time points. For the Y-axis a relative scale had to be used, normalized for the maximal signal within the examined time period. Overall, most of the profiles agree qualitatively, but there are exceptions. For example, the recording for ceh-5 shows a continuous increase in signal while microarrays show a temporary dip in transcription. Unless this is an experimental artifact, it could hypothetically mean that the GFP protein remains stable, while transcription turns off and is restarted again. However, we do not have enough data points and samples to prove this statistically. Similarly, GFP protein stability may also explain the persistence of pie-1::GFP expression. Given that all profiles have been rescaled for the Y-axis, this can sometimes give the appearance of a signal due to autofluorescence background that is expanded (e.g., for ceh-10). Overall, when taking special conditions into account (low level, extraneous signal, shift in time, etc.) the data are comparable.
Fig 11
Fig 11. Examples of homeobox::GFP expression patterns.
(A) Spatio-temporal expression of ceh-13::GFP (Recording: FR317_070308). The last panel on the right shows a 3D rendering from the side at the last time point. Time points are given in minutes (B). An example of cell migration revealed by ceh-30::GFP expression (Recording: ceh30_reco2). A group of four cells in the head region is arranged in a rhomboid-shaped pattern. Within a few minutes, the posterior cell moves further posteriorly and centrally so that the cells form now a Y-shape. (C) Expression of ceh-57::GFP in bilateral symmetric cells in the head at two-fold stage (Recording: BC15173_070608). (D) Expression of ceh-81::GFP in the head at the three-fold stage (Recording: BC15188_070614). (E) Diffuse expression of ceh-93::GFP in cells near the embryo surface (maybe hypodermis or body muscle) at the three-fold stage (Recording: TB2146_070811). (F) Expression of ceh-26::GFP (Recording: TB1200_070803), broad expression is seen from gastrulation on. (G) ceh-74::GFP (Recording: BC15162E3_070312) shows a similar expression pattern to ceh-26::GFP and hence clusters together with it. (H) Expression of ceh-45:GFP, early in anterior, expanding to more cells at comma stage (Recording: TB2300_071126). (I) Expression of ceh-88::GFP in numerous cells at the comma stage (Recording: TB2145_070730). (J) Expression of zfh-2::GFP in the head at the three-fold stage (Recording: TB2161_071120).
Fig 12
Fig 12. Expression pattern of ceh-36::GFP.
(A) DIC and GFP channels for different time points during gastrulation (Recording: TB2071_080322). Expression is broad, interestingly there is expression around the ventral cleft. (B) SC expression mapping of ceh-36::GFP derived by superimposing the Ce2008 model [12] to extract approximate single-cell expression levels. The mapping suggests that one of the cells expressing ceh-36::GFP is AB.araap, in the posterior daughter of which ceh-36 was shown to be responsible for neuronal asymmetry [86].
Fig 13
Fig 13. Expression pattern of ceh-37::GFP.
(A) Embryonic expression time points of ceh-37::GFP (Recording: ceh37_030307). DIC and GFP channels are shown. An early phase of expression is seen in four cells AB.alaaa, AB.alaap, AB.arpaa, ABarpap as determined by manual lineaging, and very weakly in their mothers. This expression fades and later expression arises in neuroblasts that give rise to the cells described ([48], Tong et al., in preparation). (B) SC expression mapped onto the Ce2008 model [12]. (C) SC expression mapped onto the lineage tree, green above the lineage line represents the GFP signal levels. The same cells as determined by manual lineaging show strong signal.

Similar articles

Cited by

References

    1. Mukherjee K, Brocchieri L, Bürglin TR. A comprehensive classification and evolutionary analysis of plant homeobox genes. Molecular biology and evolution. 2009;26(12):2775–94 10.1093/molbev/msp201 - DOI - PMC - PubMed
    1. Bürglin TR. Homeodomain subtypes and functional diversity. Subcell Biochem. 2011;52:95–122 10.1007/978-90-481-9069-0_5 - DOI - PubMed
    1. Ruvkun G, Hobert O. The taxonomy of developmental control in Caenorhabditis elegans . Science (New York, NY). 1998;282:2033–41. - PubMed
    1. Reece-Hoyes JS, Deplancke B, Shingles J, Grove CA, Hope IA, Walhout AJ. A compendium of Caenorhabditis elegans regulatory transcription factors: a resource for mapping transcription regulatory networks. Genome biology. 2005;6(13):R110 . - PMC - PubMed
    1. Riddle DL, Blumenthal T, Meyer BJ, Priess JR. C. elegans II Cold Spring Harbor, New York: Cold Spring Harbor Laboratory Press; 1997. 1222 p.

Publication types

MeSH terms

Substances