

Crowding, grouping, and object recognition: A matter of appearance
- PMID: 26024452
- PMCID: PMC4429926
- DOI: 10.1167/15.6.5
Crowding, grouping, and object recognition: A matter of appearance
Abstract
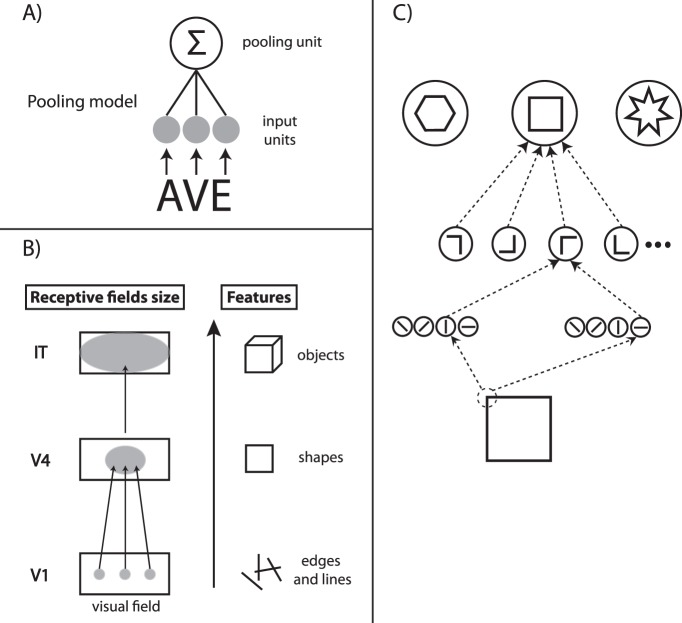
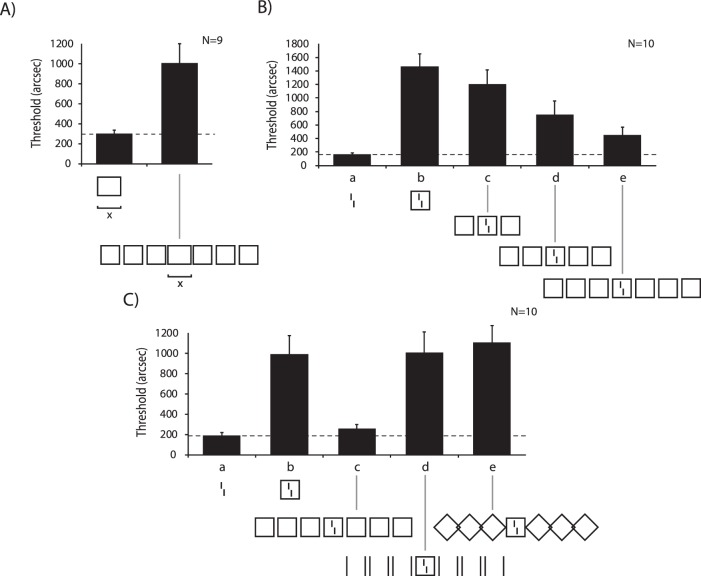
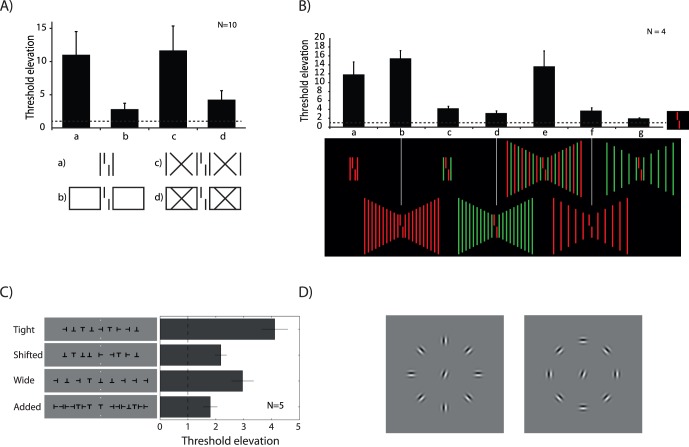
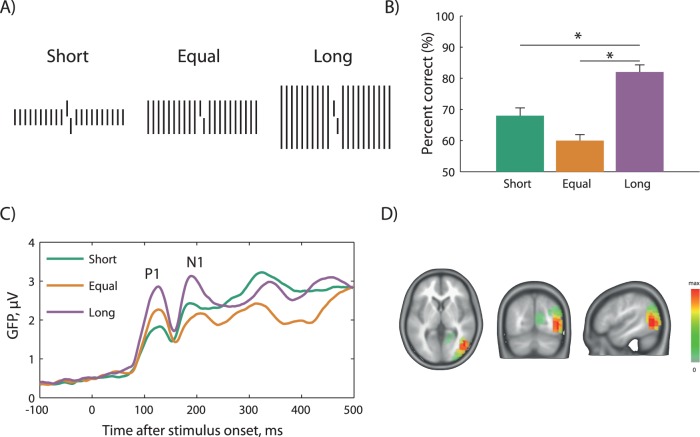
In crowding, the perception of a target strongly deteriorates when neighboring elements are presented. Crowding is usually assumed to have the following characteristics. (a) Crowding is determined only by nearby elements within a restricted region around the target (Bouma's law). (b) Increasing the number of flankers can only deteriorate performance. (c) Target-flanker interference is feature-specific. These characteristics are usually explained by pooling models, which are well in the spirit of classic models of object recognition. In this review, we summarize recent findings showing that crowding is not determined by the above characteristics, thus, challenging most models of crowding. We propose that the spatial configuration across the entire visual field determines crowding. Only when one understands how all elements of a visual scene group with each other, can one determine crowding strength. We put forward the hypothesis that appearance (i.e., how stimuli look) is a good predictor for crowding, because both crowding and appearance reflect the output of recurrent processing rather than interactions during the initial phase of visual processing.
Figures
Similar articles
-
Beyond Bouma's window: How to explain global aspects of crowding?PLoS Comput Biol. 2019 May 10;15(5):e1006580. doi: 10.1371/journal.pcbi.1006580. eCollection 2019 May. PLoS Comput Biol. 2019. PMID: 31075131 Free PMC article.
-
Image content is more important than Bouma's Law for scene metamers.Elife. 2019 Apr 30;8:e42512. doi: 10.7554/eLife.42512. Elife. 2019. PMID: 31038458 Free PMC article.
-
Grouping, pooling, and when bigger is better in visual crowding.J Vis. 2012 Sep 26;12(10):13. doi: 10.1167/12.10.13. Print 2012. J Vis. 2012. PMID: 23019118
-
Crowding and eccentricity determine reading rate.J Vis. 2007 Oct 26;7(2):20.1-36. doi: 10.1167/7.2.20. J Vis. 2007. PMID: 18217835 Review.
-
Visual crowding: a fundamental limit on conscious perception and object recognition.Trends Cogn Sci. 2011 Apr;15(4):160-8. doi: 10.1016/j.tics.2011.02.005. Epub 2011 Mar 21. Trends Cogn Sci. 2011. PMID: 21420894 Free PMC article. Review.
Cited by
-
Broad attention uncovers benefits of stimulus uniformity in visual crowding.Sci Rep. 2021 Dec 14;11(1):23976. doi: 10.1038/s41598-021-03258-z. Sci Rep. 2021. PMID: 34907221 Free PMC article.
-
Contextual Interactions in Grating Plaid Configurations Are Explained by Natural Image Statistics and Neural Modeling.Front Syst Neurosci. 2016 Oct 4;10:78. doi: 10.3389/fnsys.2016.00078. eCollection 2016. Front Syst Neurosci. 2016. PMID: 27757076 Free PMC article.
-
The generality of the critical spacing for crowded optotypes: From Bouma to the 21st century.J Vis. 2021 Oct 5;21(11):18. doi: 10.1167/jov.21.11.18. J Vis. 2021. PMID: 34694326 Free PMC article.
-
Offline transcranial direct current stimulation improves the ability to perceive crowded targets.J Vis. 2021 Feb 3;21(2):1. doi: 10.1167/jov.21.2.1. J Vis. 2021. PMID: 33533878 Free PMC article. Clinical Trial.
-
Empirical Evidence for Intraspecific Multiple Realization?Front Psychol. 2020 Jul 24;11:1676. doi: 10.3389/fpsyg.2020.01676. eCollection 2020. Front Psychol. 2020. PMID: 32793053 Free PMC article.
References
-
- Adelson E. H.(1993). Perceptual organization and the judgment of brightness. Science, 262(5142), 2042–2044. - PubMed
-
- Altmann C. F.,, Bülthoff H. H.,, Kourtzi Z.(2003). Perceptual organization of local elements into global shapes in the human visual cortex. Current Biology, 13(4), 342–349. - PubMed
-
- Anderson E. J.,, Dakin S. C.,, Schwarzkopf D. S.,, Rees G.,, Greenwood J. A.(2012). The neural correlates of crowding-induced changes in appearance. Current Biology, 22(13), 1199–1206, doi:http://dx.doi.org/10.1016/j.cub.2012.04.063. - DOI - PMC - PubMed
-
- Andriessen J.,, Bouma H.(1976). Eccentric vision: Adverse interactions between line segments. Vision Research, 16(1), 71–78, doi:http://dx.doi.org/10.1016/0042-6989(76)90078-X. - DOI - PubMed
-
- Balas B.,, Nakano L.,, Rosenholtz R.(2009). A summary-statistic representation in peripheral vision explains visual crowding. Journal of Vision, 9(12): 51–18, http://www.journalofvision.org/content/9/12/13, doi: 10.1167/9.12.13.[PubMed] [Article] - PMC - PubMed
Publication types
MeSH terms
LinkOut - more resources
Full Text Sources
Other Literature Sources
