Activation of the TOR Signalling Pathway by Glutamine Regulates Insect Fecundity
- PMID: 26024507
- PMCID: PMC4448656
- DOI: 10.1038/srep10694
Activation of the TOR Signalling Pathway by Glutamine Regulates Insect Fecundity
Abstract
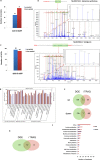
The target of rapamycin (TOR) positively controls cell growth in response to nutrients such as amino acids. However, research on the specific nutrients sensed by TOR is limited. Glutamine (Gln), a particularly important amino acid involved in metabolism in organisms, is synthesised and catalysed exclusively by glutamine synthetase (GS), and our previous studies have shown that Gln may regulate fecundity in vivo levels of the brown planthopper (BPH) Nilaparvata lugens. Until now, it has remained unclear whether Gln activates or inhibits the TOR signalling pathway. Here, we performed the combined analyses of iTRAQ (isobaric tags for relative and absolute quantification) and DGE (tag-based digital gene expression) data in N. lugens at the protein and transcript levels after GS RNAi, and we found that 52 pathways overlap, including the TOR pathway. We further experimentally demonstrate that Gln activates the TOR pathway by promoting the serine/threonine protein kinase AKT and inhibiting the 5'AMP-activated protein kinase AMPK phosphorylation activity in the pest. Furthermore, TOR regulates the fecundity of N. lugens probably by mediating vitellogenin (Vg) expression. This work is the first report that Gln activates the TOR pathway in vivo.
Figures


Similar articles
-
Proteomic and transcriptomic analyses of fecundity in the brown planthopper Nilaparvata lugens (Stål).J Proteome Res. 2013 Nov 1;12(11):5199-212. doi: 10.1021/pr400561c. Epub 2013 Oct 10. J Proteome Res. 2013. PMID: 24083549
-
TOR Pathway-Mediated Juvenile Hormone Synthesis Regulates Nutrient-Dependent Female Reproduction in Nilaparvata lugens (Stål).Int J Mol Sci. 2016 Mar 28;17(4):438. doi: 10.3390/ijms17040438. Int J Mol Sci. 2016. PMID: 27043527 Free PMC article.
-
L-Glutamine enhances enterocyte growth via activation of the mTOR signaling pathway independently of AMPK.Amino Acids. 2015 Jan;47(1):65-78. doi: 10.1007/s00726-014-1842-8. Epub 2014 Oct 4. Amino Acids. 2015. PMID: 25280462
-
AMPK and TOR: The Yin and Yang of Cellular Nutrient Sensing and Growth Control.Cell Metab. 2020 Mar 3;31(3):472-492. doi: 10.1016/j.cmet.2020.01.015. Cell Metab. 2020. PMID: 32130880 Review.
-
Regulation of the proteome by amino acids.Proteomics. 2016 Mar;16(5):831-46. doi: 10.1002/pmic.201500347. Proteomics. 2016. PMID: 26786846 Review.
Cited by
-
The Importance of Time and Place: Nutrient Composition and Utilization of Seasonal Pollens by European Honey Bees (Apis mellifera L.).Insects. 2021 Mar 10;12(3):235. doi: 10.3390/insects12030235. Insects. 2021. PMID: 33801848 Free PMC article.
-
De Novo Transcriptome Assembly and Analysis of Longevity Genes Using Subterranean Termite (Reticulitermes chinensis) Castes.Int J Mol Sci. 2022 Nov 7;23(21):13660. doi: 10.3390/ijms232113660. Int J Mol Sci. 2022. PMID: 36362447 Free PMC article.
-
WNT/β-catenin Pathway: a Possible Link Between Hypertension and Alzheimer's Disease.Curr Hypertens Rep. 2022 Oct;24(10):465-475. doi: 10.1007/s11906-022-01209-1. Epub 2022 Jul 5. Curr Hypertens Rep. 2022. PMID: 35788966 Review.
-
The Influence of Gut Microbiota on the Fecundity of Henosepilachna vigintioctopunctata (Coleoptera: Coccinellidae).J Insect Sci. 2021 Jul 1;21(4):15. doi: 10.1093/jisesa/ieab061. J Insect Sci. 2021. PMID: 34415303 Free PMC article.
-
Molecular Mechanisms Underlying the Circadian Rhythm of Blood Pressure in Normotensive Subjects.Curr Hypertens Rep. 2020 Jul 13;22(7):50. doi: 10.1007/s11906-020-01063-z. Curr Hypertens Rep. 2020. PMID: 32661611 Free PMC article. Review.
References
-
- Heitman J., Movva N. R. & Hall M. N. Targets for cell cycle arrest by the immunesuppressant rapamycin in yeast. Science 253, 905–909 (1991). - PubMed
-
- Soulard A., Cohen A. & Hall M. N. TOR signaling in invertebrates. Curr. Opin. Cell Biol. 21, 825–836 (2009). - PubMed
-
- Wullschleger S., Loewith R. & Hall M. N. TOR signaling in growth and metabolism. Cell 124, 471–484 (2006). - PubMed
-
- Hara K. et al. Amino acid sufficiency and mTOR regulate p70 S6 kinase and eIF-4E BP1 through a common effector mechanism. J. Biol. Chem. 273, 14484–14494 (1998). - PubMed
Publication types
MeSH terms
Substances
LinkOut - more resources
Full Text Sources
Other Literature Sources

