

MINT: software to identify motifs and short-range interactions in trajectories of nucleic acids
- PMID: 26024667
- PMCID: PMC4787793
- DOI: 10.1093/nar/gkv559
MINT: software to identify motifs and short-range interactions in trajectories of nucleic acids
Abstract
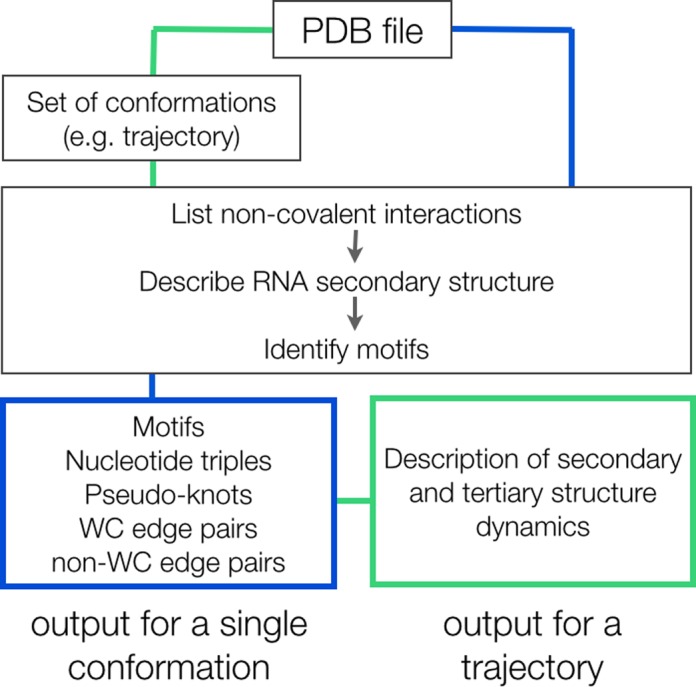
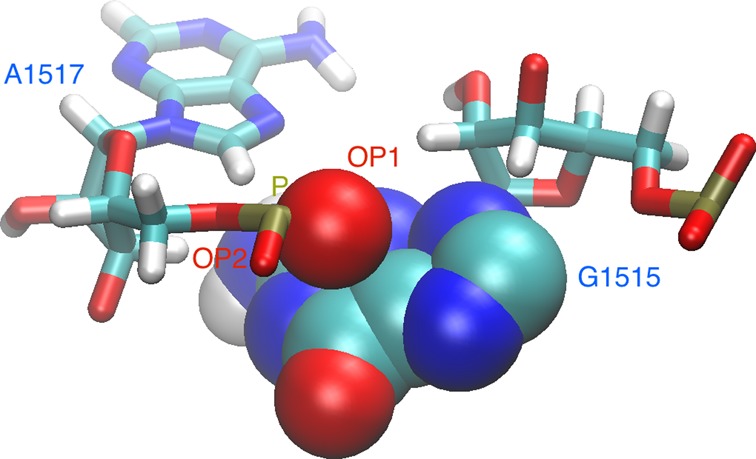
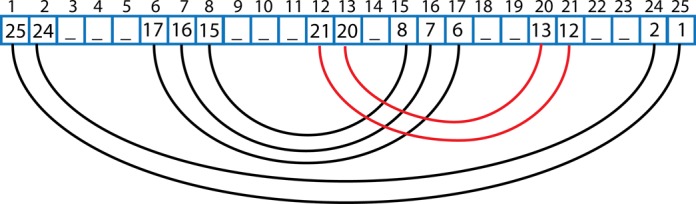
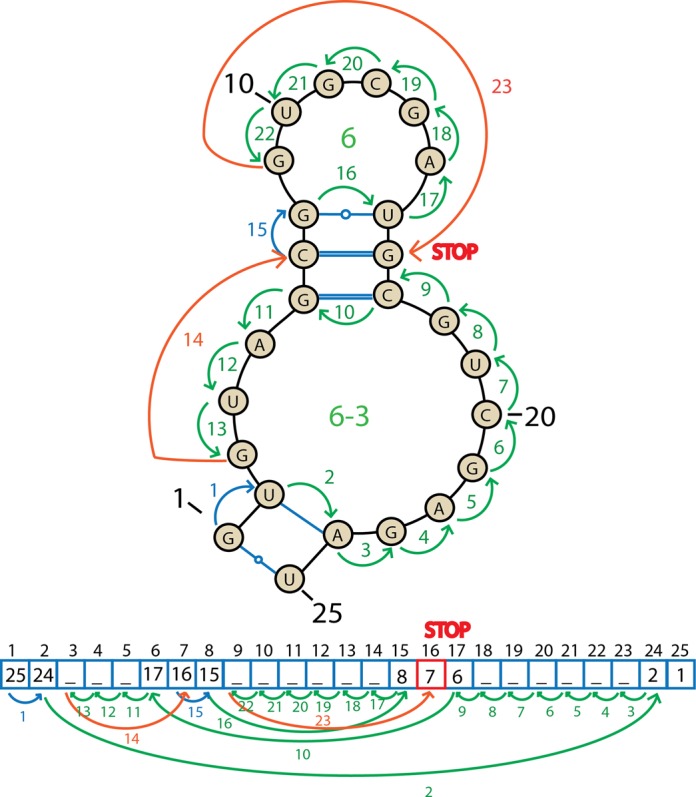
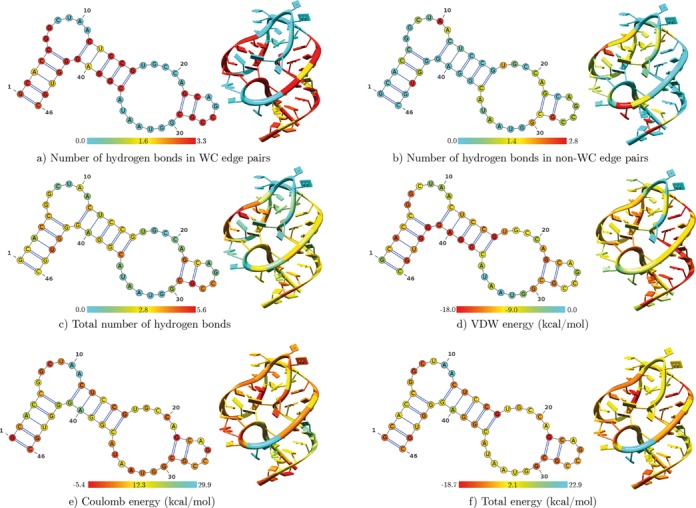
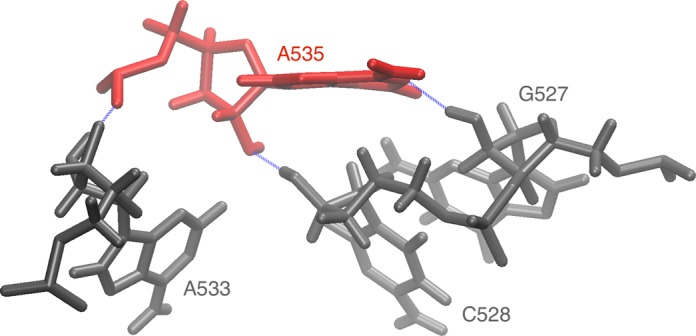
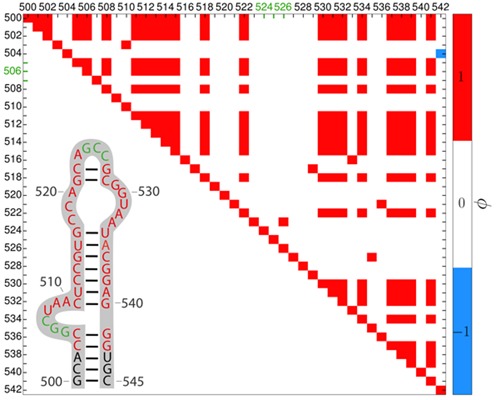
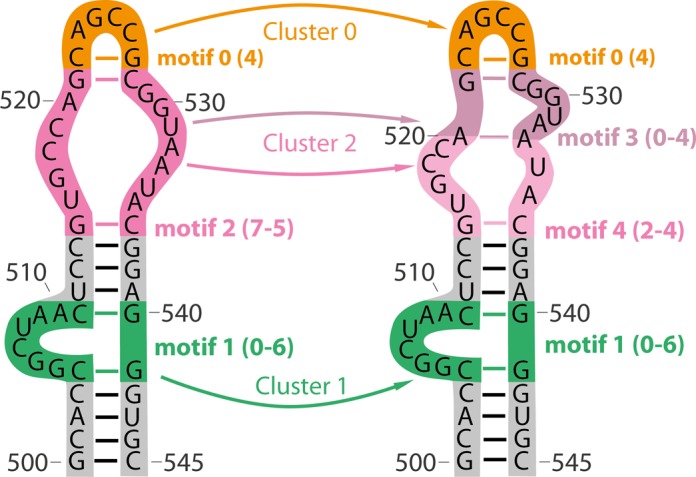
Structural biology experiments and structure prediction tools have provided many high-resolution three-dimensional structures of nucleic acids. Also, molecular dynamics force field parameters have been adapted to simulating charged and flexible nucleic acid structures on microsecond time scales. Therefore, we can generate the dynamics of DNA or RNA molecules, but we still lack adequate tools for the analysis of the resulting huge amounts of data. We present MINT (Motif Identifier for Nucleic acids Trajectory) - an automatic tool for analyzing three-dimensional structures of RNA and DNA, and their full-atom molecular dynamics trajectories or other conformation sets (e.g. X-ray or nuclear magnetic resonance-derived structures). For each RNA or DNA conformation MINT determines the hydrogen bonding network resolving the base pairing patterns, identifies secondary structure motifs (helices, junctions, loops, etc.) and pseudoknots. MINT also estimates the energy of stacking and phosphate anion-base interactions. For many conformations, as in a molecular dynamics trajectory, MINT provides averages of the above structural and energetic features and their evolution. We show MINT functionality based on all-atom explicit solvent molecular dynamics trajectory of the 30S ribosomal subunit.
© The Author(s) 2015. Published by Oxford University Press on behalf of Nucleic Acids Research.
Figures

Similar articles
-
The molecular interactions that stabilize RNA tertiary structure: RNA motifs, patterns, and networks.Acc Chem Res. 2011 Dec 20;44(12):1302-11. doi: 10.1021/ar200098t. Epub 2011 Sep 7. Acc Chem Res. 2011. PMID: 21899297
-
Modeling large RNAs and ribonucleoprotein particles using molecular mechanics techniques.Biophys J. 1994 Jun;66(6):1777-95. doi: 10.1016/S0006-3495(94)80972-5. Biophys J. 1994. PMID: 7521223 Free PMC article.
-
Conformational analysis of single-base bulges in A-form DNA and RNA using a hierarchical approach and energetic evaluation with a continuum solvent model.J Mol Biol. 1999 Jun 4;289(2):261-75. doi: 10.1006/jmbi.1999.2760. J Mol Biol. 1999. PMID: 10366504
-
RNA structure at high resolution.FASEB J. 1995 Aug;9(11):1023-33. doi: 10.1096/fasebj.9.11.7544309. FASEB J. 1995. PMID: 7544309 Review.
-
The RNA 3D Motif Atlas: Computational methods for extraction, organization and evaluation of RNA motifs.Methods. 2016 Jul 1;103:99-119. doi: 10.1016/j.ymeth.2016.04.025. Epub 2016 Apr 25. Methods. 2016. PMID: 27125735 Free PMC article. Review.
Cited by
-
A Hitchhiker's guide to RNA-RNA structure and interaction prediction tools.Brief Bioinform. 2023 Nov 22;25(1):bbad421. doi: 10.1093/bib/bbad421. Brief Bioinform. 2023. PMID: 38040490 Free PMC article. Review.
-
Thermal Stability of Peptide Nucleic Acid Complexes.J Phys Chem B. 2019 Oct 3;123(39):8168-8177. doi: 10.1021/acs.jpcb.9b05168. Epub 2019 Sep 20. J Phys Chem B. 2019. PMID: 31491077 Free PMC article.
-
Structural, Dynamical, and Entropic Differences between SARS-CoV and SARS-CoV-2 s2m Elements Using Molecular Dynamics Simulations.ACS Phys Chem Au. 2022 Oct 4;3(1):30-43. doi: 10.1021/acsphyschemau.2c00032. eCollection 2023 Jan 25. ACS Phys Chem Au. 2022. PMID: 36711027 Free PMC article.
-
Interactions of 2'-O-methyl oligoribonucleotides with the RNA models of the 30S subunit A-site.PLoS One. 2018 Jan 19;13(1):e0191138. doi: 10.1371/journal.pone.0191138. eCollection 2018. PLoS One. 2018. PMID: 29351348 Free PMC article.
-
Molecular mechanisms for dynamic regulation of N1 riboswitch by aminoglycosides.Nucleic Acids Res. 2018 Nov 2;46(19):9960-9970. doi: 10.1093/nar/gky833. Nucleic Acids Res. 2018. PMID: 30239867 Free PMC article.
References
-
- Bloomfield V.A., Crothres D.M., Tinoco I.J. Nucleic acids: structures, properties, and functions. Sausalito, CA: University Science Books; 1999.
-
- Šponer J., Lankas F. Computational studies of RNA and DNA. Dordrecht: Springer; 2006.
-
- Krepl M., Réblová K., Koča J., Šponer J. Bioinformatics and molecular dynamics simulation study of L1 stalk non-canonical rRNA elements: kink-turns, loops, and tetraloops. J. Phys. Chem. B. 2013;117:5540–5555. - PubMed
Publication types
MeSH terms
Substances
LinkOut - more resources
Full Text Sources
Other Literature Sources
