. 2015 Jun 4;161(6):1320-33.
doi: 10.1016/j.cell.2015.04.049. Epub 2015 May 28.

A Corticostriatal Path Targeting Striosomes Controls Decision-Making under Conflict

Affiliations

A Corticostriatal Path Targeting Striosomes Controls Decision-Making under Conflict

Alexander Friedman et al. Cell. .

Abstract

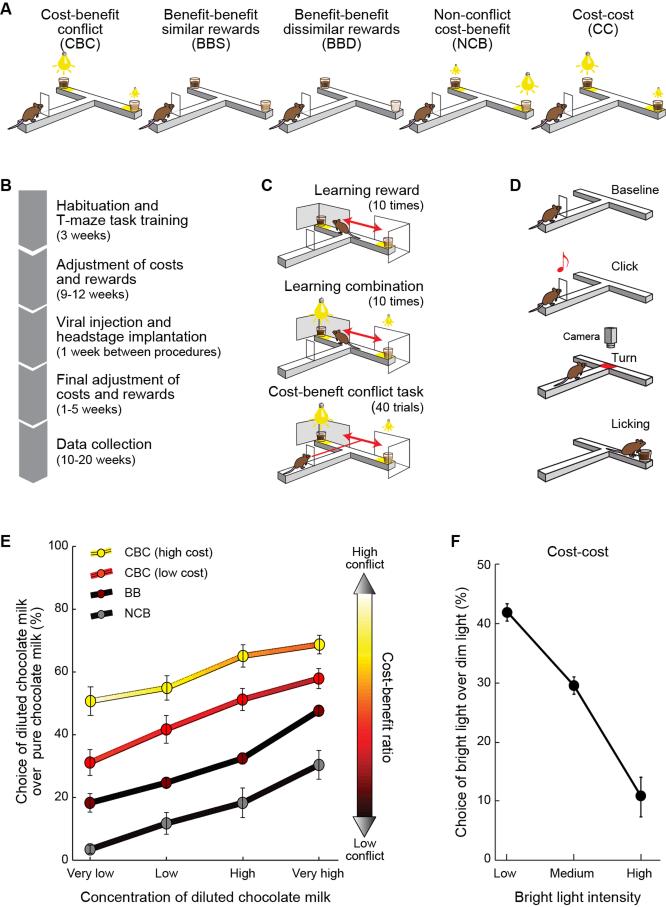
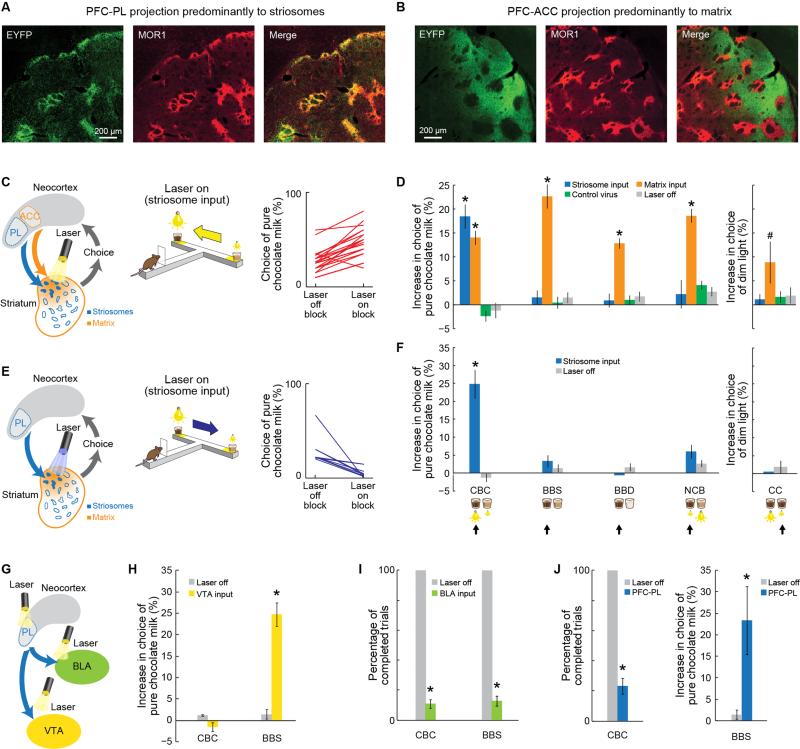
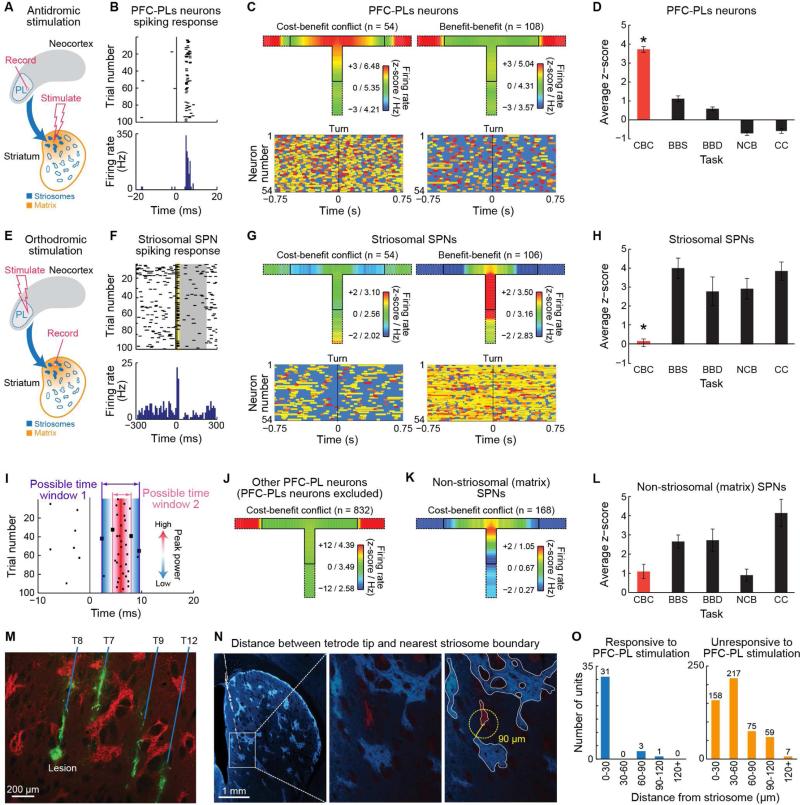
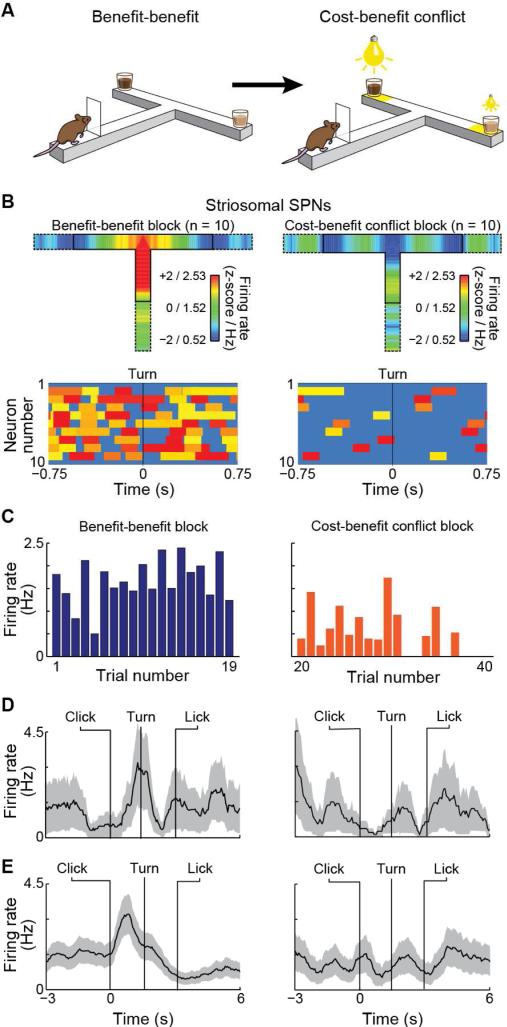
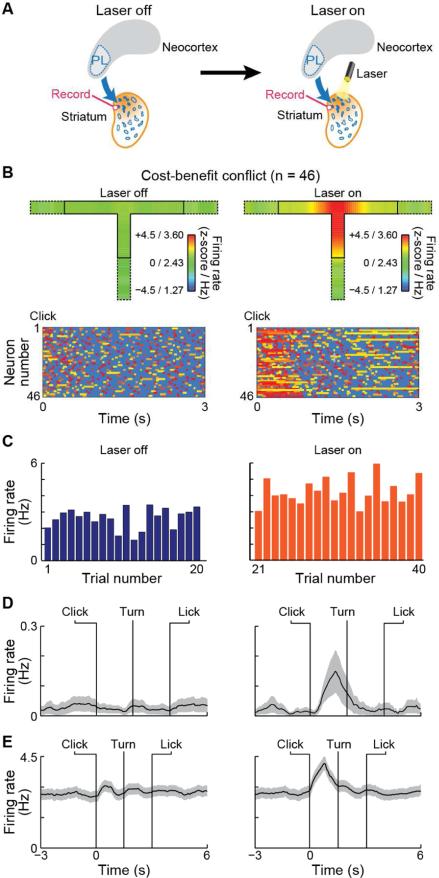
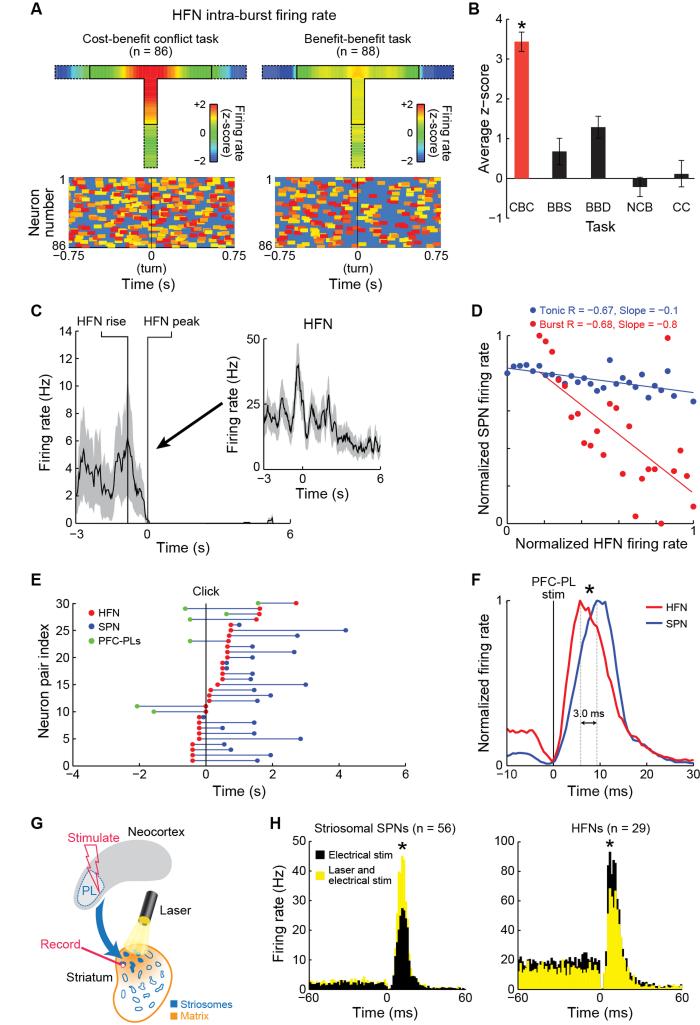
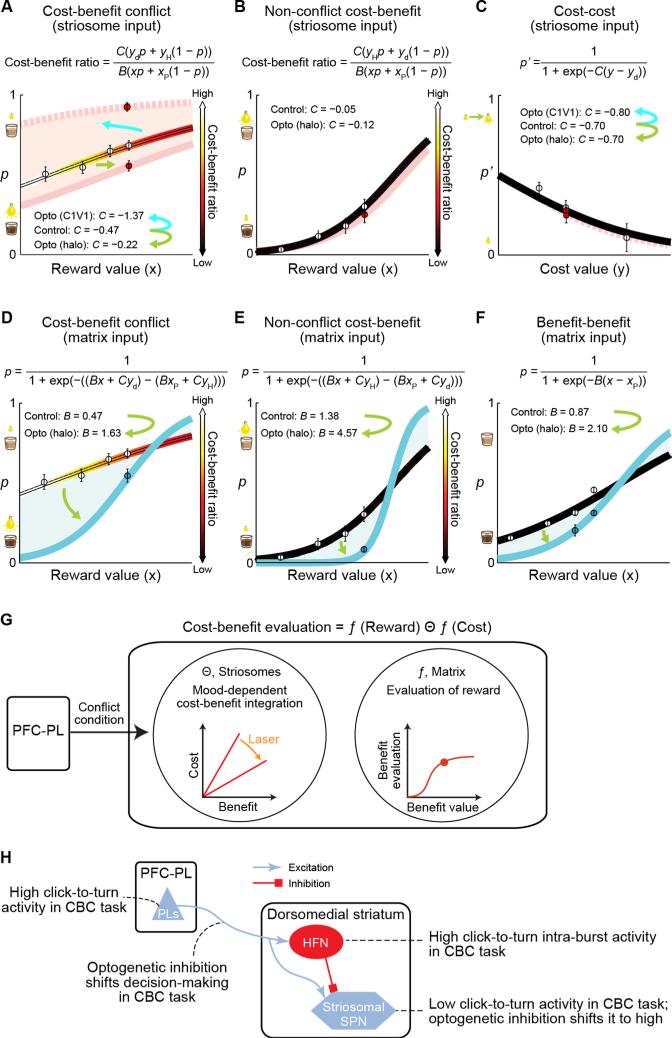
A striking neurochemical form of compartmentalization has been found in the striatum of humans and other species, dividing it into striosomes and matrix. The function of this organization has been unclear, but the anatomical connections of striosomes indicate their relation to emotion-related brain regions, including the medial prefrontal cortex. We capitalized on this fact by combining pathway-specific optogenetics and electrophysiology in behaving rats to search for selective functions of striosomes. We demonstrate that a medial prefronto-striosomal circuit is selectively active in and causally necessary for cost-benefit decision-making under approach-avoidance conflict conditions known to evoke anxiety in humans. We show that this circuit has unique dynamic properties likely reflecting striatal interneuron function. These findings demonstrate that cognitive and emotion-related functions are, like sensory-motor processing, subject to encoding within compartmentally organized representations in the forebrain and suggest that striosome-targeting corticostriatal circuits can underlie neural processing of decisions fundamental for survival.


Figures

Figure 1
Figure 1. Decision-Making Tasks
(A) The five decision-making tasks. (B) Training timeline. (C) Session of cost-benefit conflict task. (D) Schematic of maze run. (E) Choice functions (mean ± SEM) for 9 rats for the four tasks including benefit option. Color indicates degree of motivational conflict estimated by logistic modeling. (F) Choice function (mean ± SEM) for cost-cost task. See also Figure S1.
Figure 2
Figure 2. Optogenetic Manipulation of PFC-PL Cortico-Striosomal Pathway and PFC-ACC Cortico-Matrix Pathway
(A and B) Virally-labeled PFC-PL (A) and PFC-ACC (B) corticostriatal projections (green, EYFP-immunostained) preferentially terminating, respectively, in striosome (red, MOR1-immunostained) and matrix compartments. (C) Intrastriatal inhibition of PFC-PL axons (striosome-predominant input, left) increases choice of high-cost, high-reward option in cost-benefit conflict task (middle). Proportions of choices of such option with and without laser delivery are shown for 25 sessions in 10 rats (right). (D) Behavioral effects of intrastriatal optogenetic inhibition of striosome-predominant PFC-PL inputs (blue) and matrix-predominant PFC-ACC inputs (orange), shown as percentage increase (mean ± SEM) in choice of pure chocolate milk (left) or of dim light (right). #p > 0.07 and *p < 0.001 relative to control groups (green and gray, two-tail t-test). (E) Intrastriatal stimulation of PFC-PL axons decreases choice of high-cost options in cost-benefit conflict task. Data for nine sessions in three rats. (F) Intrastriatal inhibition of contralateral striosome-predominant inputs (mean ± SEM). *p < 0.001, two-tail t-test. (G) Protocol for optogenetic inhibition applied in the PFC-PL, or at PFC-PL terminal zones in ventral tegmental area (VTA) or basolateral amygdala (BLA). (H-J) Behavioral effects (mean ± SEM) of laser delivered in VTA (H), BLA (I), and PFC-PL (J). *p < 0.001, two-tail t-test. See also Figure S2
Figure 3
Figure 3. Contrasting Activity of Putative Cortical PFC-PLs Neurons and Striosomal SPNs during Task Performance
(A) Antidromic stimulation protocol to identify PFC-PLs neurons. (B) Cortical spikes aligned to striatal microstimulation onset. (C) Spike activity of PFC-PLs neurons (top) and bursty spike activity heat maps (bottom) in cost-benefit conflict (left) and benefit-benefit (right) tasks. Inner T-maze outline indicates click to first lick (i.e., in-run time-period); outer outline includes 3 s before and after runs. Activity shown as mean z-scores and firing rates in color scale from blue (low) to red (high). Heat map rectangles show bursts with lengths proportional to burst durations, with min-max normalized intra-burst firing rates from yellow (low) to red (high). (D) PFC-PLs spike activity (mean ± SEM) during click-to-turn period for all tasks (abbreviated as in Figure 1A). *p < 0.001 (two-tail t-test, difference between CBC and each of other tasks). (E) Orthodromic stimulation protocol for identification of putative striosomal neurons. (F) Putative striosomal SPN activity aligned to PFC-PL microstimulation. Yellow and gray shading respectively indicates peak and inhibition time windows. (G) Activity of putative striosomal SPNs (top) and associated burst activity heat maps (bottom). (H) Average click-to-turn activity of putative striosomal SPNs in the 5 tasks. *p < 0.001 (two-tail t-test; difference between CBC and each of other tasks). (I) Method to determine time-window of short-latency orthodromic SPN activation (Extended Experimental Procedures). Larger squares show spike times demarcating start and end of time window. (J and K) Average spike activity of non-PFC-PLs population recorded in PFC-PL (J) and putative matrix SPNs (K) during cost-benefit conflict task. (L) Average click-to-turn activity of putative matrix SPNs. (M) Four tetrode tracks and tip marked with micro-lesion (CD11, green) relative to striosomes (MOR1, red). (N) Sample of tip-striosome measurements (Extended Experimental Procedures). Tetrode tip in matrix (red, middle and right panels) along tetrode track (white, left panel); distance to nearest striosome (light blue) shown (yellow line). (O) Distribution of SPNs that respond to PFC-PL stimulation (left) was significantly different from that of unresponsive SPNs (right; p < 0.001, chi-squared test). See also Figure S3.
Figure 4
Figure 4. Activity of Putative Striosomal Neurons Changes with Switch to Cost-Benefit Conflict Task
(A) Timeline for benefit-benefit task (19 trials) followed by cost-benefit conflict task (21 trials). Reminder trials were given in-between. (B) Average activity of 10 striosomal SPNs held through both blocks (above) and burst activity heat maps (below). (C) Average in-run firing rates in each trial through the two tasks. p < 0.001, paired t-test between blocks. (D and E) Firing rates (mean ± SEM) of 1 (D) and 10 (E) putative striosomal SPNs recorded across the two tasks. p < 0.001, paired t-test between blocks. See also Figure S4.
Figure 5
Figure 5. Optogenetic Inhibition of PFC-PL Terminals in Cost-Benefit Conflict Task Increases Firing Rates of Putative Striosomal Neurons
(A) Consecutive cost-benefit conflict task blocks (20 trials each), without, then with, laser inhibition for 3 s, starting at click. (B) Maze activity plots (above) and burst activity heat maps (below) for 46 putative striosomal SPNs. (C) Trial-by-trial firing rates across the blocks. p < 0.001, paired t- test between blocks. (D and E) Firing rates (mean ± SEM) for 1 (D) and for 46 (E) putative striosomal SPNs recorded across blocks. p < 0.001, paired t-test between blocks. See also Figure S5.
Figure 6
Figure 6. Sequence of Activity during Cost-Benefit Decision-Making Recorded from PFC-PLs Neurons, Striatal HFNs and SPNs
(A) Average intra-burst activity (top) and heat maps (bottom) of HFNs during cost-benefit conflict (left) and benefit-benefit (right) tasks. (B) HFN intra-burst firing rates (mean ± SEM) during click-to-turn periods. *p < 0.001 (two-tail t-test; difference between CBC and other tasks). (C) Activity of single SPN (mean ± SEM), aligned at zero to activity peak of an HFN (inset) recorded simultaneously by single tetrode. Inset zero indicates time of start click. (D) Firing rates of a simultaneously recorded HFN-SPN pair, for phasic (burst, red) and tonic (non-burst, blue) HFN activity, with correlation coefficient (R) and slope for each. Dots show SPN activity averaged across all 240 ms bins sorted for HFN firing rates in 5-Hz steps. (E) Sequence of peak excitation of PFC-PLs neurons (green) and HFNs (red) and peak inhibition of SPNs (blue) recorded in pairs as shown. Plots aligned to start click (zero). (F) HFN (n = 29, red) and simultaneously recorded SPN (n = 56, blue) responses to PFC-PL stimulation. HFNs lead SPNs by ~3 ms. *p = 0.001 (Wilcoxon and two-sample Kolmogorov-Smirnov tests). (G) Stimulation-inhibition protocol with SPN recordings in consecutive blocks of PFC-PL electrical stimulation then combined PFC-PL electrical stimulation and intrastriatal optogenetic inhibition of PFC-PL input. (H) Putative striosomal SPN and HFN population firing rates aligned to PFC-PL stimulation during the stimulation-only block (black) and stimulation-laser block (yellow). Laser illumination increased SPN firing by 34% but decreased HFN firing by 32%. *p < 0.001 (two-tail t-test). See also Figure S6.
Figure 7
Figure 7. Computational Models to Characterize the Effects of Optogenetic Manipulations
(A-F) Choice probability (p: probability of choosing diluted chocolate milk; p’: probability of choosing bright light) derived from the logistic regression plotted against reward (x) or cost (y) value. For cost-benefit conflict (A and D) and non-conflict cost-benefit (B and E) tasks, lines graded by color indicate cost-benefit ratio (i.e., estimates of motivational conflict). Circles indicate empirically obtained means (filled: optogenetic manipulation, open: control) with SEM. Results of optogenetic manipulations of PFC-PL pathway targeting striosomes (A-C) could be accounted for by change in the sensitivity to cost (“C”) under motivational conflict. Solid and dotted pink lines indicate, respectively, the modeled behaviors for optogenetic inhibition (halo) and excitation (C1V1) of the striosome-targeting pathway. Changes in sensitivity to cost were specifically induced in cost-benefit conflict task (A), but not in non-conflict cost-benefit (B) or cost-cost (C) task. Optogenetic inhibition (halo) of PFC-ACC pathway targeting matrix (D-F) could be accounted for by increase in the sensitivity to reward (“B”) in the cost-benefit conflict (D), non-conflict cost-benefit (E) and benefit-benefit (F) tasks (blue lines: modeled behaviors for optogenetic inhibition). (G) Phenomenological model of PFC-PL striosomal circuit function. PFC-PL provides context information about conflict, engages intrastriatal network inhibiting striosomal SPNs in high-conflict context. Matrix evaluates benefits, whereas striosomes integrate cost and benefit when both values are high. (H) Schematic circuit diagram and summary of major findings. See also Extended Experimental Procedures.

Comment in

References

    1. Amemori K, Graybiel AM. Localized microstimulation of primate pregenual cingulate cortex induces negative decision-making. Nat Neurosci. 2012;15:776–785. - PMC - PubMed
    1. Aupperle RL, Melrose AJ, Francisco A, Paulus MP, Stein MB. Neural substrates of approach-avoidance conflict decision-making. Hum Brain Mapp. 2015;36:449–462. - PMC - PubMed
    1. Aupperle RL, Paulus MP. Neural systems underlying approach and avoidance in anxiety disorders. Dialogues Clin Neurosci. 2010;12:517–531. - PMC - PubMed
    1. Aupperle RL, Sullivan S, Melrose AJ, Paulus MP, Stein MB. A reverse translational approach to quantify approach-avoidance conflict in humans. Behavioural brain research. 2011;225:455–463. - PMC - PubMed
    1. Berke JD. Functional properties of striatal fast-spiking interneurons. Front Syst Neurosci. 2011;5:45. - PMC - PubMed

Publication types

LinkOut - more resources