. 2015 Jun 4;161(6):1306-19.
doi: 10.1016/j.cell.2015.05.009. Epub 2015 May 28.

A TRP Channel Senses Lysosome Neutralization by Pathogens to Trigger Their Expulsion

Affiliations

A TRP Channel Senses Lysosome Neutralization by Pathogens to Trigger Their Expulsion

Yuxuan Miao et al. Cell. .

Abstract

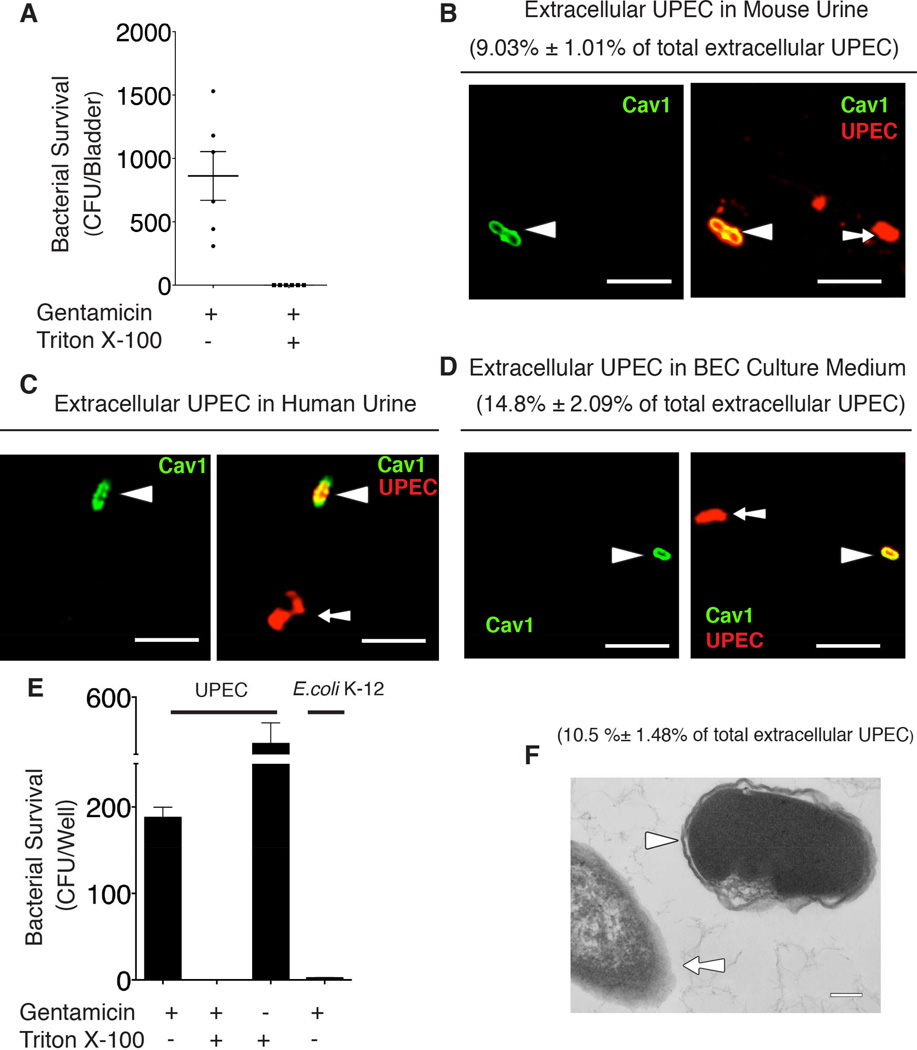
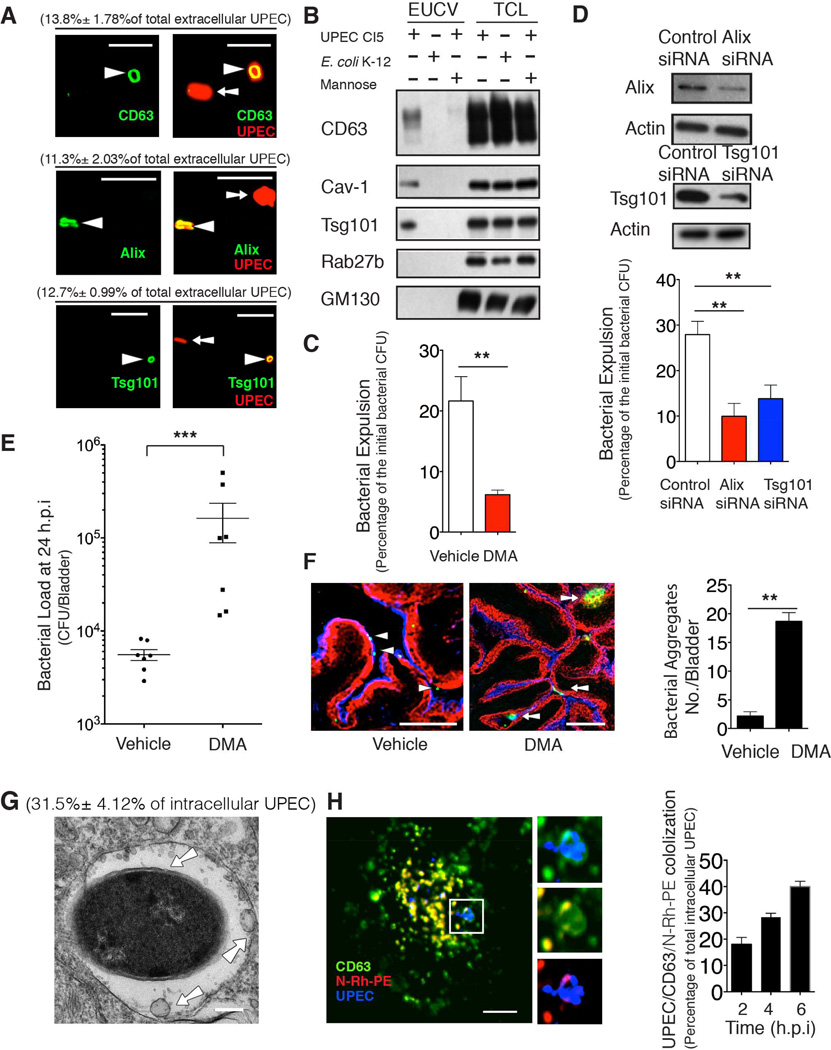
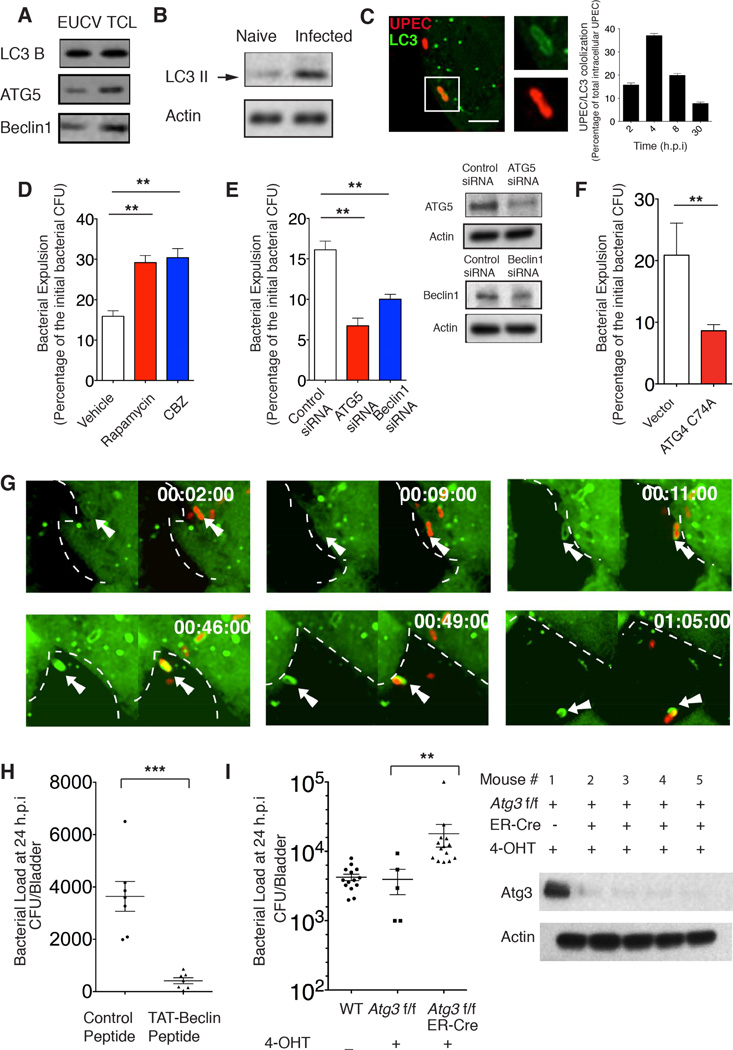
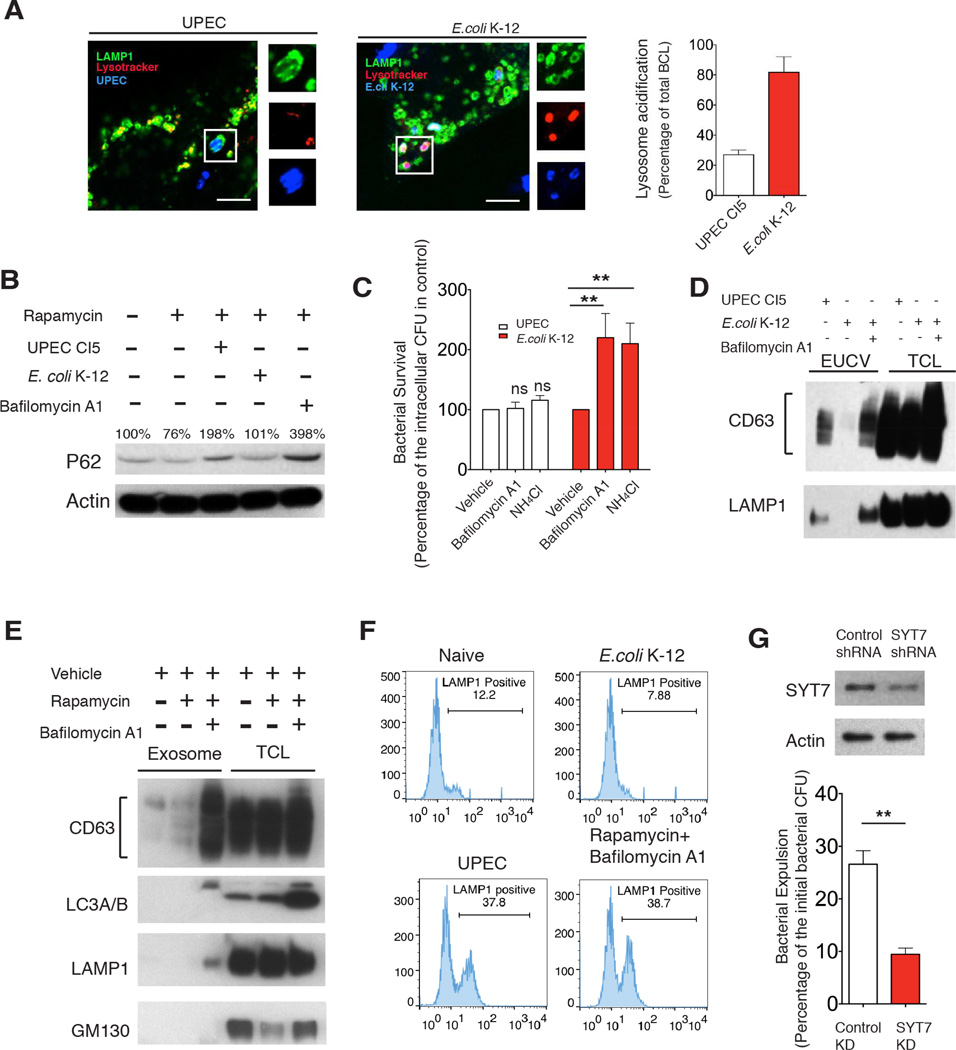
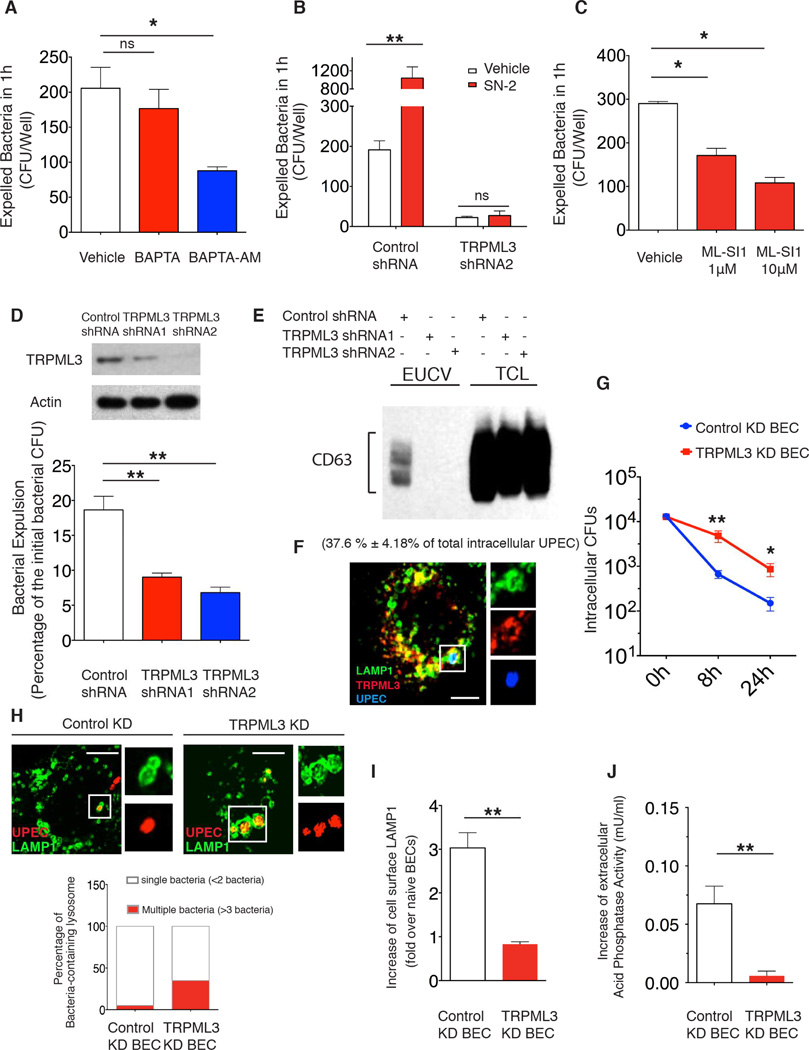
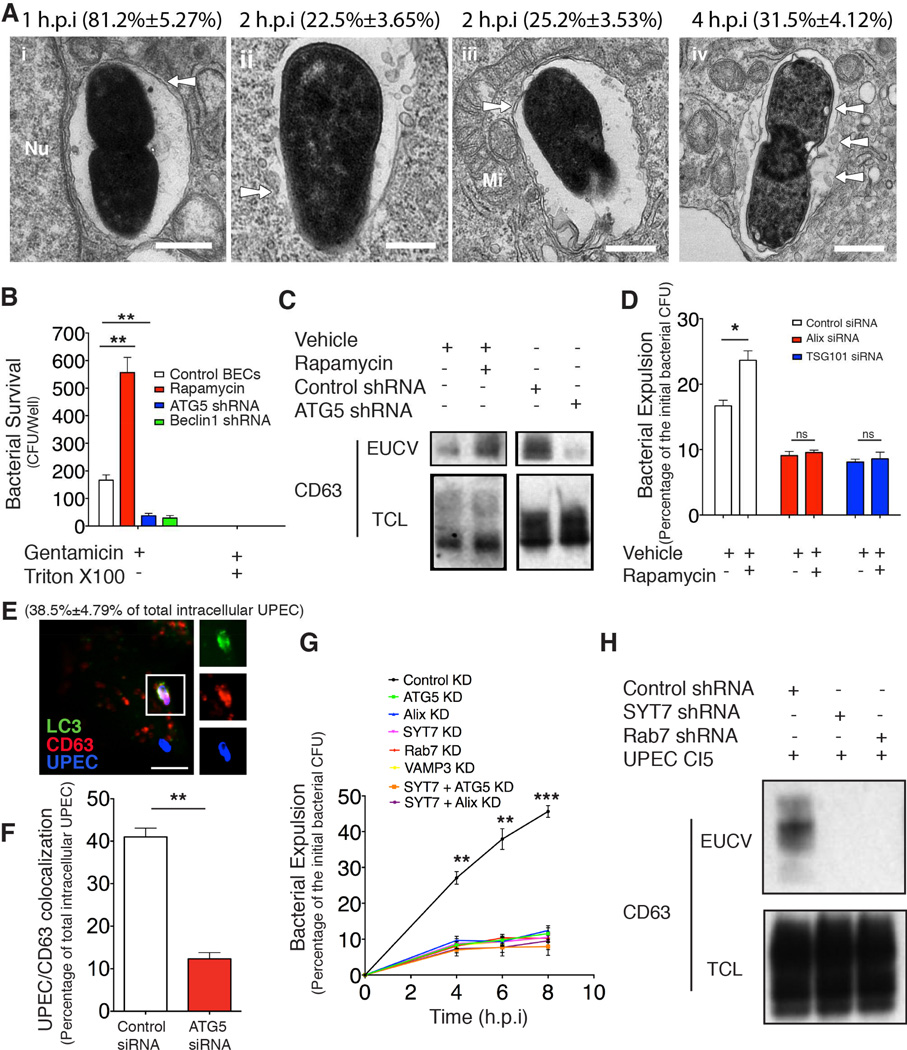
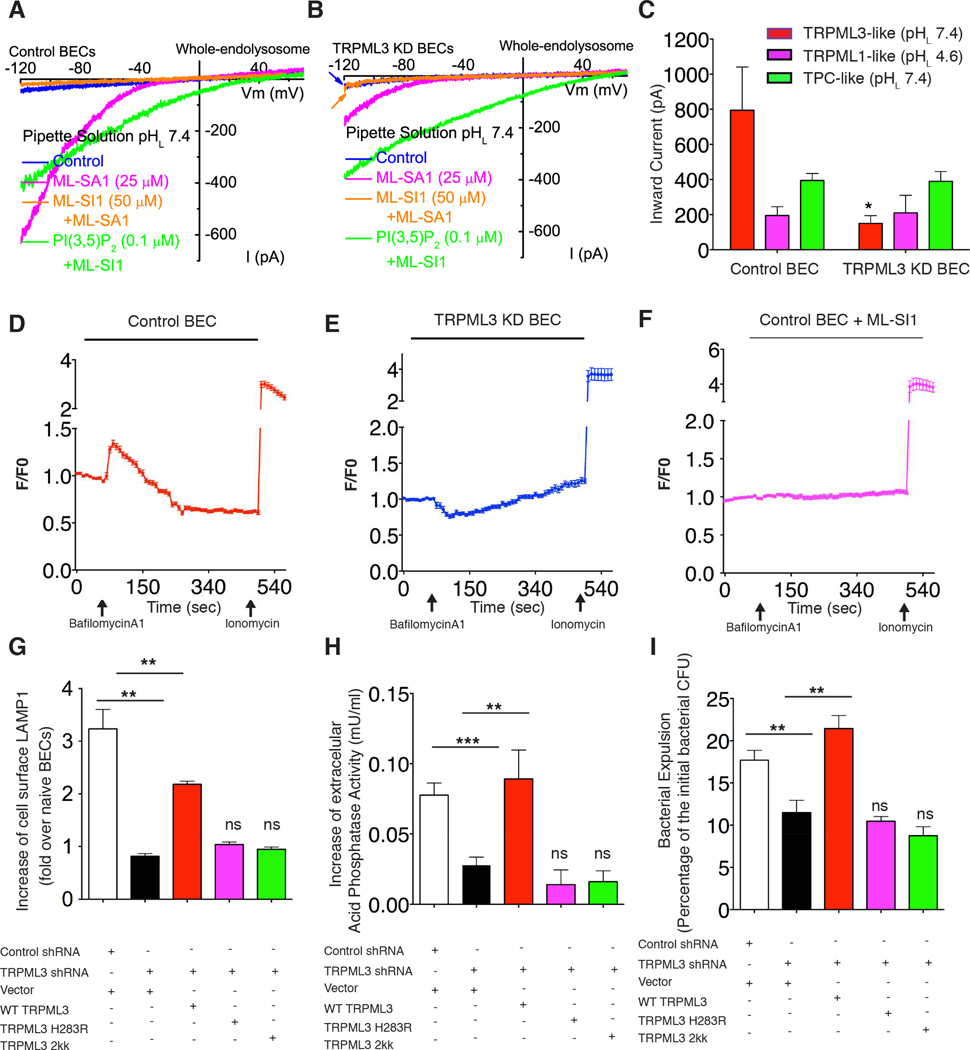
Vertebrate cells have evolved elaborate cell-autonomous defense programs to monitor subcellular compartments for infection and to evoke counter-responses. These programs are activated by pathogen-associated pattern molecules and by various strategies intracellular pathogens employ to alter cellular microenvironments. Here, we show that, when uropathogenic E. coli (UPEC) infect bladder epithelial cells (BECs), they are targeted by autophagy but avoid degradation because of their capacity to neutralize lysosomal pH. This change is detected by mucolipin TRP channel 3 (TRPML3), a transient receptor potential cation channel localized to lysosomes. TRPML3 activation then spontaneously initiates lysosome exocytosis, resulting in expulsion of exosome-encased bacteria. These studies reveal a cellular default system for lysosome homeostasis that has been co-opted by the autonomous defense program to clear recalcitrant pathogens.


Figures

Figure 1
Figure 1. Expelled UPEC are encased in membrane-bound vesicles
(A) Cell-free urine from infected C57BL/6 mice was collected at 6 hours post infection (h.p.i.), and treated with gentamicin with/without 0.1% Triton X-100 for 1hr. The surviving CFU were quantified. Error bars, SEM. n=9. (B – D) Immunofluorescence staining for Caveolin-1 (green) and UPEC (red) in cell-free urine collected from infected mouse at 6 h.p.i (B), UTI patients (C), or culture medium collected from infected BEC line at 8 h.p.i. (D). Arrow depicts naked bacteria and arrowhead depicts vesicle-encased UPEC. The membrane-encased UPEC were quantified and expressed as the percentage of total examined UPEC shown in the parenthesis. Scale bar: 5 µm. n=3 slides. (E) Bacterial viability assay performed on cell-free medium collected from BECs infected with UPEC strain CI5 or E.coli K-12 strain MG1655 at 8 h.p.i., and treated with gentamicin or 0.1% Triton X-100 alone, or gentamicin plus 0.1% Triton X-100 for 1 hour. Error bars, SEM. n=18. (F) TEM image of extracellular bacteria collected from the culture medium of infected BECs. Arrowhead depicts vesicle-encased bacterium and arrow depicts a naked bacterium. The membrane-encased ECU were quantified and expressed as the percentage of total examined UPEC shown in the parenthesis. Scale bar: 0.2 µm. n=3 grids
Figure 2
Figure 2. Vesicles encasing expelled bacteria are exosomes
(A) Immunofluorescence staining of colocalization between exosome markers (green) and extracellular bacteria (red) collected from infected 5637 BEC line at 8 h.p.i.. The vesicle-encased UPEC were quantified and expressed as the percentage of total examined UPEC shown in the parenthesis. Scale bar: 5 µm. n=3 slides. (B) Immunoblot analysis of lysates of EUCV purified at 12 h.p.i. from BECs infected with either UPEC, E. coli K12 strain, or UPEC with mannose in the medium. Total cell lysates (TCLs) were used to show similar number of cells were treated. (C and D) Bacterial expulsion at 6 h.p.i. in infected BECs treated with DMSO (vehicle) or 15 nM dimethyl amiloride (DMA) (C), or transfected with control siRNA or Alix/Tsg101 siRNA. Knockdown efficiency is indicated by the western blot alongside. Error bar, SEM. n=18. (E) Bacterial load at 24 h.p.i in infected bladder treated with either vehicle (DMSO) or 15 nM DMA. Error bar, SEM. n=9. (F) Immunofluorescence staining of infected bladder treated with either vehicle or DMA for 24 hours. Collapsed bladder: superficial epithelium (blue), intermediate epithelium (red), UPEC (green). Arrowhead depicts single bacteria, and arrow depicts bacterial aggregates. The bacterial aggregates (> 10 µm) were quantified. Scale bar: 100 µm. n=3 mice. (G) TEM image shows intracellular UPEC encased in MVBs at 4 h.p.i. The arrow depicts ILVs-encased in MVBs. Bacteria encased in MVBs were quantified and expressed as a percentage of total examined UPEC, shown in the parenthesis. Scale bar: 0.2 µm. n=3 grids (H) Immunofluorescence staining of UPEC (blue) and MVB markers CD63 (green) and flourescent N-Rh-PE (red) at 4 h.p.i.. Scale bar: 5 µm. The CD63+ compartmenr-encased UPEC was quantified at 2, 4, 6 hours, expressed as the percentage of total examined UPEC, Scale bar: 5 µm. n=3 slides.
Figure 3
Figure 3. Bacterial expulsion involves autophagy components
(A) Immunoblot analysis of autophagy components in EUCVs collected from infected BECs at 12 h.p.i. . (B) Immunoblot of naive BECs (lane1) and infected BECs (lane2) showing increase in LCII upon UPEC infection for 15 minutes. (C) Immunofluorescence staining revealing co-association of autophagosome marker LC3 (green) with UPEC (red) in infected BECs at 2 h.p.i.. The number of the LC3-encased UPEC was quantified at 2, 4, 8, 30 h.p.i. and expressed as the percentage of total examined UPEC, Scale bar: 5 µm. n=3 slides. (D to F) Bacterial expulsion levels at 6 h.p.i. in infected BECs treated with (D) DMSO (vehicle), 200nm Rapamycin or 30 µM CBZ, or (E) transfected with control siRNA, ATG5 siRNA or Beclin1 siRNA, or (F) transfected with empty vector or plasmid overexpressing ATG4 C74A. Knockdown efficiency in (E) is indicated by the western blot alongside. Error bars, SEM. (n=18). (G) Still shots from a movie showing intracellular UPEC encapsulation in autophagosomes followed by export. Green, LC3; Red, UPEC. For each time point: left, LC3 only; right: LC3 & UPEC overlay. Dashed lines indicate the cell border assessed from background fluorescence, and the white arrows point to expelled-bacteria. (H) Bacterial load at 24 h.p.i in infected bladder treated with either control or 30 µg TAT-Beclin peptide. Error bars, SEM. n=9. (I) Bacterial load at 24 h.p.i in infected bladder of the wild type (WT), 4-OHT treated Control Atg3flox/flox or 4-OHT induced Atg3 KO in Atg3flox/flox ER-Cre mice. Western blot probing Atg3 in exfoliated superficial epithelium extract shows efficient knockout of Atg3 in the superficial epithelial cells of the bladder. Error bars, SEM. n=9.
Figure 4
Figure 4. Neutralization of bacteria-bearing lysosomes triggers lysosome exocytosis
(A) Immunofluorescence staining of UPEC (blue) or E.coli K-12 (blue)-containing lysosomes (green) and lysotracker (red) at 6 h.p.i.. Lysotracker+ populations of bacteria-containing lysosomes were quantified, and expressed as the percentage of total examined lysosome-enclosed bacteria. Scale bar: 5 µm. n=3 slides. (B) P62 level dynamics in naïve BECs (lane1), BECs treated with 200 nM rapamycin alone (lane 2) or rapamycin combined with UPEC (lane 3), E. coli K-12 (lane 4) or 1 µM bafilomycin A1 (lane 5). (C) Intracellular bacteria CFU at 8 h.p.i in BECs infected with either UPEC or E.coli K-12 and treated with either vehicle, 1 µM bafilomycinA1 or 50 mM NH4 Cl. Error bars, SEM. n=18. (D) Immunoblot quantification of CD63 or LAMP1 present in the EUCV purified from UPEC, or E.coli K-12 infected BECs, or E.coli K-12 infected BECs treated with bafilomycin A1. Comparable CD63 or LAMP1 in total cell lysate (TCL) suggest similar numbers of cells were used. (E) Immunoblot quantification of CD63 in exosomes purified from naïve BECs, BECs treated with 200 nM rapamycin alone, or with 200 nM rapamycin for 4 hours followed by 1 µM bafilomycinA1 treatment for12 hours. Comparable CD63 level in total cell lysate suggest that similar number of cells were used. (F) FACS analysis of cell surface LAMP1+ populations in naïve BECs, or BECs treated with rapamycin for 4 hours followed by bafilomycin A1 treatment for 12 hours, or infected with UPEC CI5 or E.coli K-12 for 12 hours. (G) Bacterial expulsion levels at 6 h.p.i. in infected BECs expressing control shRNA, or SYT7 shRNA. Knockdown efficiency is indicated by the western blot alongside. Error bars, SEM. n=18.
Figure 5
Figure 5. Sequential trafficking of intracellular UPEC before expulsion
(A) TEM showing intracellular UPEC (i) encased in a single membrane (arrow) vacuole (ii) break their initial vacuole (arrow) or (iii) completely encased in an autophagosome with double-layered membrane (arrow) (iv) encased in a single membrane compartment containing membrane-bound bacteria (arrow) and ILVs (arrow), resembling a MVB. The bacteria associated with each structure is quantified and expressed as the percentage of total examined UPEC, provided in parenthesis. Scale bar: 0.2 µm. n=3 grids (B) Extracellular UPEC surviving from gentamycin with/without 0.1% Triton X-100 treatment were quantified from BECs treated with rapamycin or ATG5 or Beclin1 shRNA. Error bars, SEM. n=18. (C) Immunoblot quantification of CD63 associated with EUCV isolated at 12 h.p.i. from infected BECs treated with DMSO vehicle (lane1), 200 nM of rapamycin (lane2) or transfected with control shRNA (lane3) or ATG5 shRNA (lane4). The CD63 detected in the total cell lysate (TCL) was used to suggest similar number of cells were used. (D) Bacterial expulsion levels at 6 h.p.i. in control or Alix/Tsg101 knockdown BECs, with/without 200 nM rapamycin treatment. Error bars, SEM. n=18. (E) Immunofluorescence staining of colocalization between autophagosome marker LC3 (green) and MVB marker CD63 (red) when housing UPEC (blue) in infected BECs at 4 h.p.i.. The number of LC3+ and CD63+ compartment-encased UPEC was quantified and expressed as percentage of total ICU examined, shown in the parenthesis. Scale bar: 5 µm. n=3 slides. (F) The number of CD63+ compartment-encased UPEC was quantified in control KD or ATG5 KD BECs and expressed as percentage of total ICU, n=3 slides. (G) Bacterial expulsion level from infected control KD, or ATG5KD, Alix KD, VAMP3 KD, Rab7 KD, SYT7 KD BECs, or SYT7 & ATG5 double KD, or SYT7 & Alix double KD were quantified at 4, 6, and 8 h.p.i.. The time point immediately after 1h gentamycin treatment was considered as 0h. Error bars, SEM. n=12. (H) Immunoblot quantification of CD63 associated with EUCV isolated at 12 h.p.i. from BECs transfected with control shRNA (lane1), SYT7 shRNA (lane2), or Rab7 shRNA (lane 3). CD63 detected in the total cell lysate (TCL) (lane 4, 5, 6) was used to suggest similar number of cells were used.
Figure 6
Figure 6. TRPML3 is critical for neutralization-induced lysosome exocytosis
(A to C) Quantification of expelled bacteria within 1h in infected BECs treated with DMSO vehicle, (A) 10 µM BAPTA or BAPTA-AM; (B) 25 µM SN-2; or (C) 1 µM or 10 µM ML-SI1. The drugs were applied at 6 h.p.i. Error bars, SEM. n=18. (D) Bacterial expulsion levels at 6 h.p.i. in BECs expressing control shRNA or shRNA targeting two different regions of TRPML3. Knockdown efficiency is indicated by the western blot alongside. Error bars, SEM. n=18. (E) Immunoblot quantification of CD63 in the purified EUCV from control or TRPML3 KD BECs at 12 h.p.i.. CD63 in the total cell lysate (TCL) was used to show similar number of cells were used. (F) Immunofluorescence staining of the colocalization of UPEC (blue) containing lysosome (green) and TRPML3 (red) at 6 h.p.i.. The number of LAMP1+ TRPML3+ compartment-encased UPEC was quantified and expressed as percentage of total UPEC examined, shown in the parenthesis. Scale bar: 5 µm. n=3 slides (G) Intracellular bacterial CFU quantified at 0h, 8h, and 24h.p. i. in control KD and TRPML3KD BECs. The time point immediately after 1h gentamycin treatment was considered as 0h. Error bars, SEM. n=12. (H) Immunofluorescence staining of UPEC (red) in the lysosome (green) from control or TRPML3 KD BECs at 8 h.p.i.. The lysosomes containing either less than 2 or more than 3 bacteria were quantified and expressed as the percentage of total UPEC-containing lysosomes examined. n=3 slides. (I) FACS analysis of the cell surface LAMP1+ population in naïve or 200nM rapamycin and 1 µM bafilymycinA1 treated controls or TRPML3 KD BECs. The fold increase of the cell surface LAMP1 over naïve BECs is shown. n=5. (J) The increase of extracellular acid phosphatase activity in naïve or rapamycin and bafilomycinA1 treated control or TRPML3 KD BECs was compared. Error bars, SEM. n=15.
Figure 7
Figure 7. TRPML3 senses lysosomal neutralization and triggers lysosome exocytosis
(A to C) TRPML3 currents recorded from a whole endolysosome of (A) control BECs and (B) that of TRPML3 KD BECs, which is activated at pH 7.4 by TRPML agonist, ML-SA1 (magenta) and inhibited by TRPML antagonist, ML-SI1 (orange). (C) The quantification of the current. Error bar, SEM. n=5. (D to F) Calcium efflux (measured as change of fluorescence F over basal fluorescence F0: F/F0) from lysosome upon bafilomycinA1 treatment in the (D) control BEC, (E) TRPML3 KD BECs, or (F) control BECs treated with 10 µM TRPML antagonist ML-SI 1; Error bars, SEM. (n=15). (G to I) Increases in cell surface LAMP1 positive populations (G), acid phosphatase release (H), or bacterial expulsion (I) in either control BECs transfected with empty vector, or in TRPML3 KD BECs transfected with knockdown resistant form of WT, H283R, or a D458KD459K mutant. Error bars, SEM.

Comment in

References

    1. Abraham SN, Sun D, Dale JB, Beachey EH. Conservation of the D-mannose-adhesion protein among type 1 fimbriated members of the family Enterobacteriaceae. Nature. 1988;336:682–684. - PubMed
    1. Akira S, Uematsu S, Takeuchi O. Pathogen recognition and innate immunity. Cell. 2006;124:783–801. - PubMed
    1. Baietti MF, Zhang Z, Mortier E, Melchior A, Degeest G, Geeraerts A, Ivarsson Y, Depoortere F, Coomans C, Vermeiren E, et al. Syndecan-syntenin-ALIX regulates the biogenesis of exosomes. Nat Cell Biol. 2012;14:677–685. - PubMed
    1. Bishop BL, Duncan MJ, Song J, Li G, Zaas D, Abraham SN. Cyclic AMP-regulated exocytosis of Escherichia coli from infected bladder epithelial cells. Nat Med. 2007;13:625–630. - PubMed
    1. Clapham DE. TRP channels as cellular sensors. Nature. 2003;426:517–524. - PubMed

Publication types

MeSH terms

Substances