Review
doi: 10.5152/dir.2015.14505.
Imaging patterns of fatty liver in pediatric patients
Affiliations
- PMID: 26027765
- PMCID: PMC4498433
- DOI: 10.5152/dir.2015.14505
Item in Clipboard
Review
Imaging patterns of fatty liver in pediatric patients
Diagn Interv Radiol.
2015 Jul-Aug.
Abstract
Fatty liver can present as focal, diffuse, heterogeneous, and multinodular forms. Being familiar with various patterns of steatosis can enable correct diagnosis. In patients with equivocal findings on ultrasonography, magnetic resonance imaging can be used as a problem solving tool. New techniques are promising for diagnosis and follow-up. We review imaging patterns of steatosis and new quantitative methods such as proton density fat fraction and magnetic resonance elastography for diagnosis of nonalcoholic fatty liver disease in children.
Figures
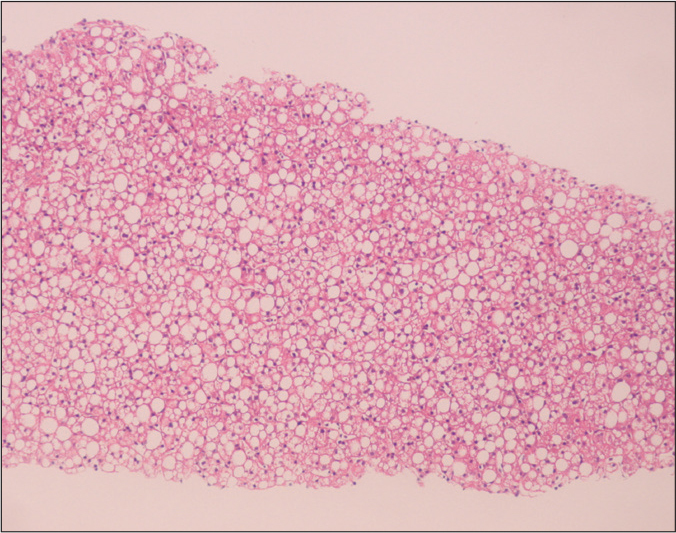
An 11-month-old girl liver biopsy shows type 2 nonalcoholic steatohepatitis with macrovesicular steatosis (hematoxylin-eosin staining, original magnification ×40).
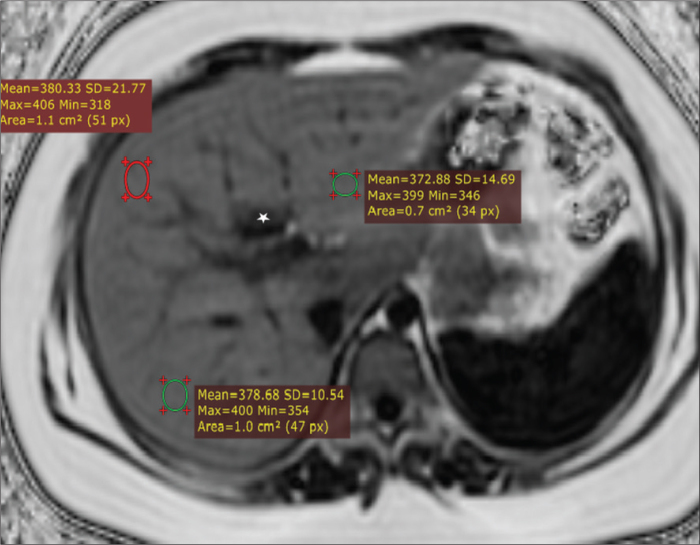
A 13-year-old boy with nonalcoholic fatty liver disease. Axial proton density fat fraction (PDFF) map obtained by IDEAL-IQ sequence shows fat fraction of 38%. IDEAL-IQ is a three-dimensional volumetric imaging sequence used to create T2* and triglyceride fat fraction maps from a single breath-hold acquisition. The technique was used to estimate R2* (1/T2*) and PDFF (water-triglyceride fat separation) in the liver in a single simultaneous sequence. Note that fat fraction can be measured in any part of the liver (three different regions of interest with similar results). Fat spared area at the posterior aspect of segment 4 appears dark due to absence of fat (asterisk).
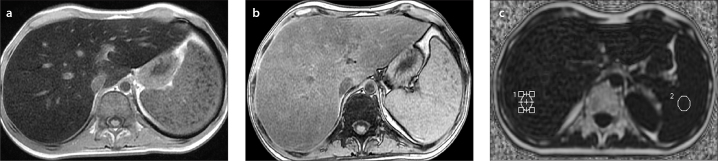
a–c. A 17-year-old boy with non-Hodgkin lymphoma who presented with elevated liver enzymes and echogenic liver on US. In-phase (a) and out-of-phase (b) T1-weighted images show signal loss on in-phase images consistent with iron overload. Proton density fat fraction was calculated as 7% and T2* was 2 ms by IDEAL-IQ sequence (c), confirming coexisting mild steatosis and severe iron overload, which was not perceptible on in-phase and out-of-phase images.
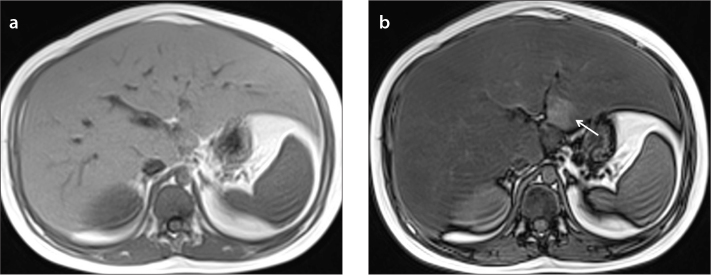
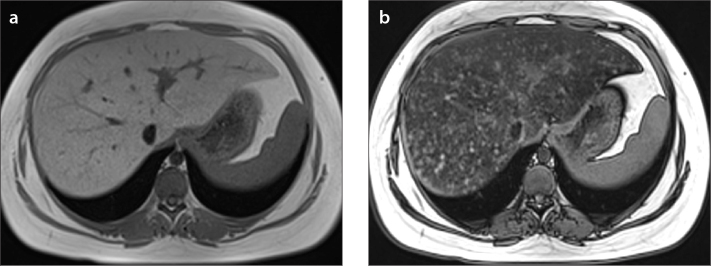
a, b. An 11-year-old boy with diffuse liver steatosis. In-phase (a) and out-of-phase (b) images show diffuse heterogeneous signal drop is seen on out-of-phase image, consistent with steatosis. Note the focal sparing area in segments 2–3 within the diffuse steatosis (arrow in b), which is usually due to presence of aberrant left gastric vein.
a, b. A 15-year-old girl with diffuse heterogeneous liver and subtle hypoechoic areas on US. In-phase (a) and out-of-phase (b) images show diffuse heterogeneous liver steatosis. Diffuse heterogeneous signal drop is seen on out-of-phase image consistent with steatosis. Note the submillimeter focal sparing areas within the heterogeneous steatosis consistent with multifocal fat sparing.
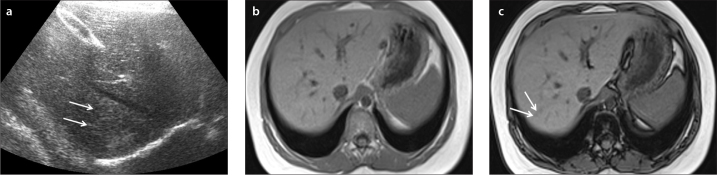
a–c. US image (a) shows focal hyperechogenic areas in segments 7–8 of a 10-year-old boy (arrows). In-phase (b) and out-of-phase (c) images show mild heterogeneous liver steatosis. Out-of-phase image shows subtle signal drop compared with in-phase image confirming mild heterogeneous steatosis (arrows in c).
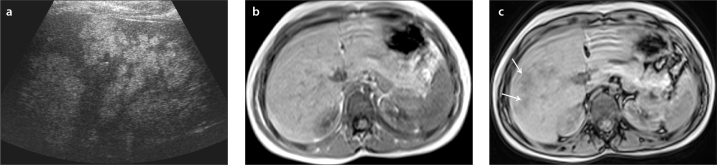
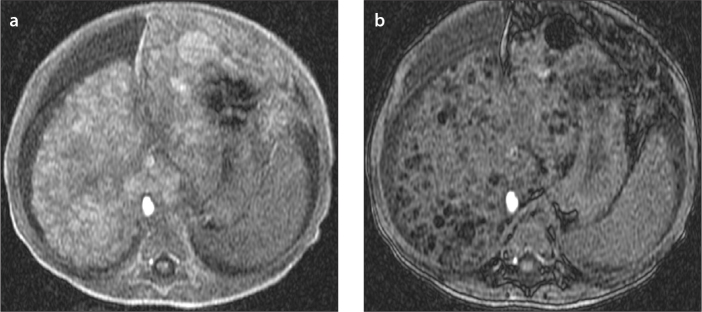
a–c. US image (a) shows multiple hyperechoic lesions in the right liver lobe of a six-year-old boy. In-phase (b) and out-of-phase (c) images show severe heterogeneous liver steatosis. Out-of-phase image shows multiple lesions with signal drop compared with in-phase image consistent with severe heterogeneous steatosis (arrows in c).
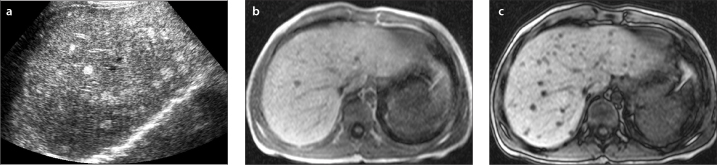
a–c. US image (a) shows multiple hyperechoic lesions in the liver of a nine-year-old boy. In-phase (b) and out-of-phase (c) images show multifocal liver steatosis. Out-of-phase image shows multiple lesions with signal drop compared with in-phase image consistent with multifocal steatosis.
a, b. A one-year-old girl with tyrosinemia type 1. In-phase (a) and out-of-phase (b) images show multifocal fat containing lesions. Out-of-phase image shows multiple lesions with signal drop compared with in-phase image consistent with multifocal fat containing lesions diagnosed as multiple regenerative nodules, which were stable in size during the follow-up.
References
-
- Schwimmer JB, Deutsch R, Kahen T, Lavine JE, Stanley C, Behling C. Prevalence of fatty liver in children and adolescents. Pediatrics. 2006;118:1388–1393. http://dx.doi.org/10.1542/peds.2006-1212. - DOI - PubMed
-
- Moran JR, Ghishan FK, Halter SA, Greene HL. Steatohepatitis in obese children: a cause of chronic liver dysfunction. Am J Gastroenterol. 1983;78:374–377. - PubMed
-
- Barshop NJ, Sırlin CB, Schwimmer JB, Lavine JE. Review article: epidemiology, pathogenesis and potential treatments of paediatric non-alcoholic fatty liver disease. Aliment Pharmacol Ther. 2008;28:13–24. http://dx.doi.org/10.1111/j.1365-2036.2008.03703.x. - DOI - PubMed
-
- Widhalm K, Ghods E. Nonalcoholic fatty liver disease: a challenge for pediatricians. Int J Obes. 2010;34:1451–1467. http://dx.doi.org/10.1038/ijo.2010.185. - DOI - PubMed
-
- Schwimmer HB, Behling C, Newbury R, et al. Histopathology of pediatric nonalcoholic fatty liver disease. Hepatology. 2005;42:641–649. http://dx.doi.org/10.1002/hep.20842. - DOI - PubMed
Publication types
MeSH terms
LinkOut - more resources
Full Text Sources
Other Literature Sources
Medical