

Coronary artery bypass grafting in diabetics: A growing health care cost crisis
- PMID: 26027913
- PMCID: PMC5120545
- DOI: 10.1016/j.jtcvs.2015.03.041
Coronary artery bypass grafting in diabetics: A growing health care cost crisis
Abstract
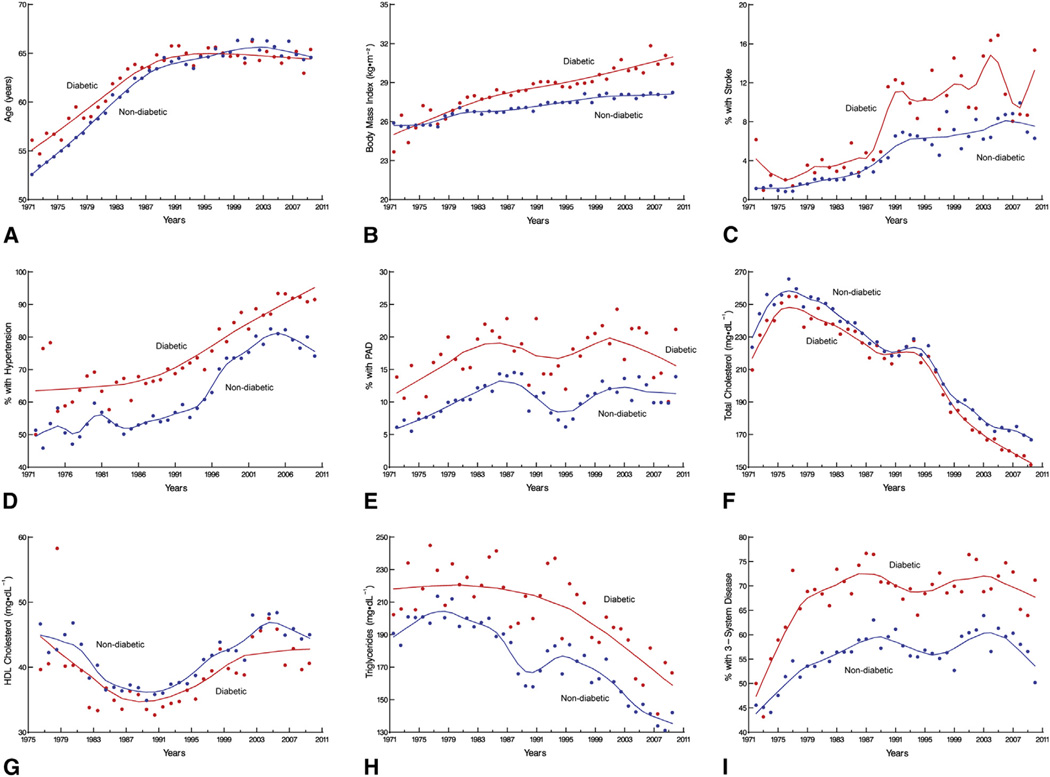
Objectives: To determine 4-decade temporal trends in the prevalence of diabetes and cardiovascular risk factors among patients undergoing coronary artery bypass grafting (CABG) and to compare in-hospital outcomes, resource utilization, and long-term survival after CABG in diabetics versus nondiabetics.
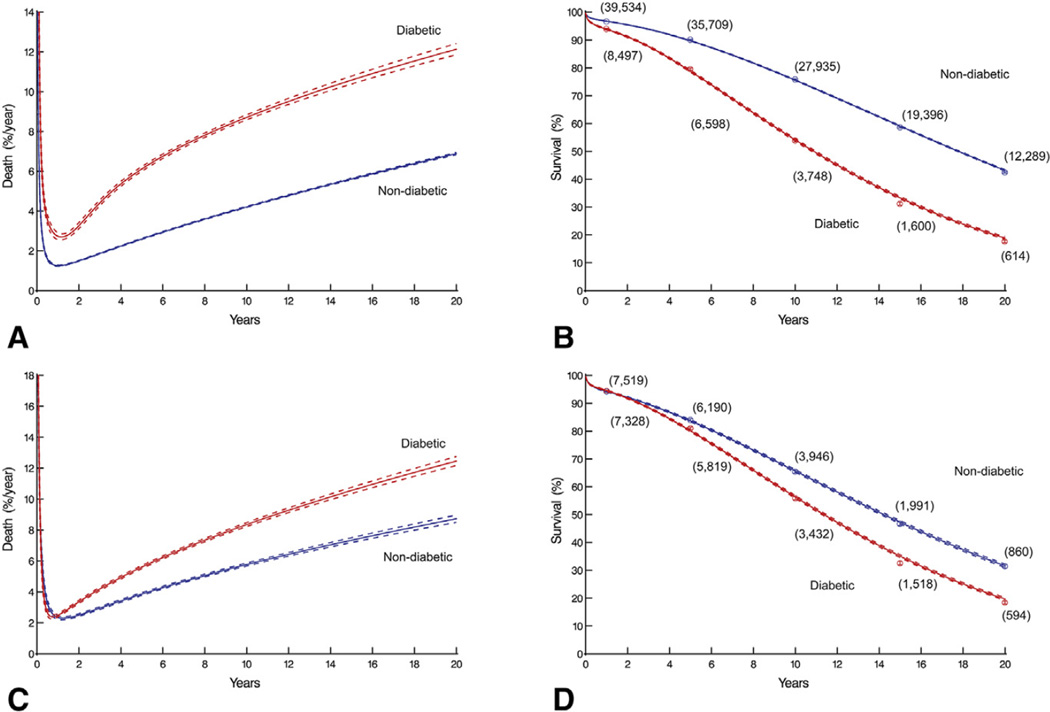
Methods: From January 1972 to January 2011, 10,362 pharmacologically treated diabetics and 45,139 nondiabetics underwent first-time CABG. Median follow-up was 12 years. Direct technical cost data were available from 2003 onward (n = 4679). Propensity matching by diabetes status was used for outcome comparisons. Endpoints were in-hospital adverse events, resource utilization, and long-term survival.
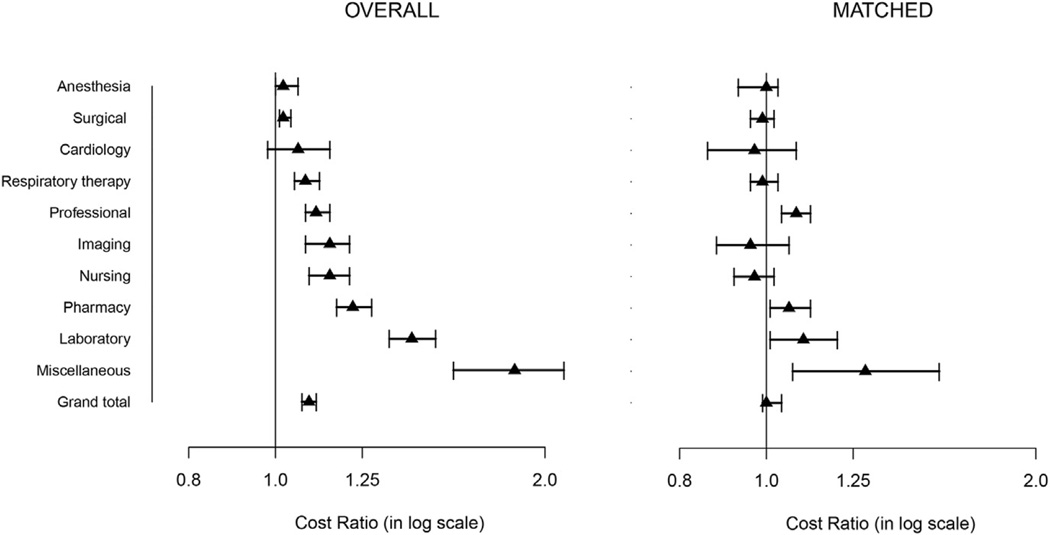
Results: Diabetics undergoing CABG increased from 7% in the 1970s to 37% in the 2000s. Their outcomes were worse, with more (P < .05) in-hospital deaths (2.0% vs 1.3%), deep sternal wound infections (2.3% vs 1.2%), strokes (2.2% vs 1.4%), renal failure (4.0% vs 1.3%), and prolonged postoperative hospital stay (9.6% vs 6.0%); and their hospital costs were 9% greater (95% confidence interval 7%-11%). Survival after CABG among diabetics versus nondiabetics at 1, 5, 10, and 20 years was also worse: 94% versus 94%, 80% versus 84%, 56% versus 66%, and 20% versus 32%, respectively. Propensity-matched patients incurred similar costs, but the prevalence of postoperative deep sternal wound infections and stroke, as well as long-term survival, remained worse in diabetics.
Conclusions: Diabetes is both a marker for high-risk, resource-intensive, and expensive care after CABG and an independent risk factor for reduced long-term survival. These issues, coupled with the increasing proportion of patients needing CABG who have diabetes, are a growing challenge in reining in health care costs.
Keywords: Coronary artery bypass grafting; diabetes; health care costs.
Copyright © 2015 The American Association for Thoracic Surgery. Published by Elsevier Inc. All rights reserved.
Conflict of interest statement
Statement Dr Sabik is the North American principal investigator for the Abbott Laboratories–sponsored left main coronary disease randomized trial (EXCEL), is on the Society of Thoracic Surgeons Board of Directors, and is on the scientific advisory board of Medtronic. All other authors have nothing to disclose with regard to commercial support.
Figures
Comment in
-
Diabetes: To graft or not to graft is no longer the question.J Thorac Cardiovasc Surg. 2015 Aug;150(2):313-4. doi: 10.1016/j.jtcvs.2015.05.051. Epub 2015 May 21. J Thorac Cardiovasc Surg. 2015. PMID: 26077002 No abstract available.
-
Coronary artery bypass grafting in patients with diabetes: The weight is on us.J Thorac Cardiovasc Surg. 2015 Aug;150(2):284-5. doi: 10.1016/j.jtcvs.2015.05.046. Epub 2015 May 21. J Thorac Cardiovasc Surg. 2015. PMID: 26095623 No abstract available.
References
-
- International Diabetes Federation. IDF diabetes atlas. Available at: http://www.idf.org/diabetesatlas.
-
- Centers for Disease Control and Prevention. National diabetes fact sheet: national estimates and general information on diabetes and prediabetes in the United States. Atlanta: US Department of Health and Human Services; 2011.
-
- Beckman JA, Creager MA, Libby P. Diabetes and atherosclerosis: epidemiology, pathophysiology, and management. JAMA. 2002;287:2570–2581. - PubMed
-
- Fox CS, Coady S, Sorlie PD, D’Agostino RB, Sr, Pencina MJ, Vasan RS, et al. Increasing cardiovascular disease burden due to diabetes mellitus: the Framingham Heart Study. Circulation. 2007;115:1544–1550. - PubMed
Publication types
MeSH terms
Grants and funding
LinkOut - more resources
Full Text Sources
Other Literature Sources
Medical
