. 2015 Jun 9;11(9):1400-1413.
doi: 10.1016/j.celrep.2015.04.064. Epub 2015 May 28.

Autism-like Deficits in Shank3-Deficient Mice Are Rescued by Targeting Actin Regulators

Affiliations

Autism-like Deficits in Shank3-Deficient Mice Are Rescued by Targeting Actin Regulators

Lara J Duffney et al. Cell Rep. .

Abstract

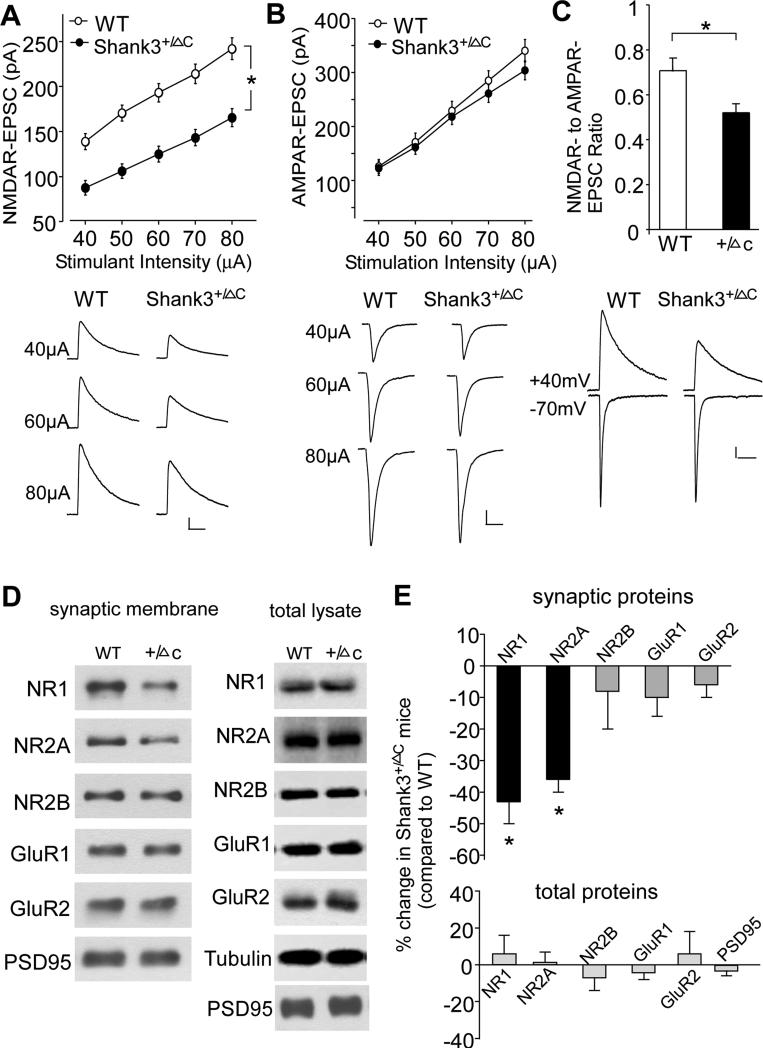
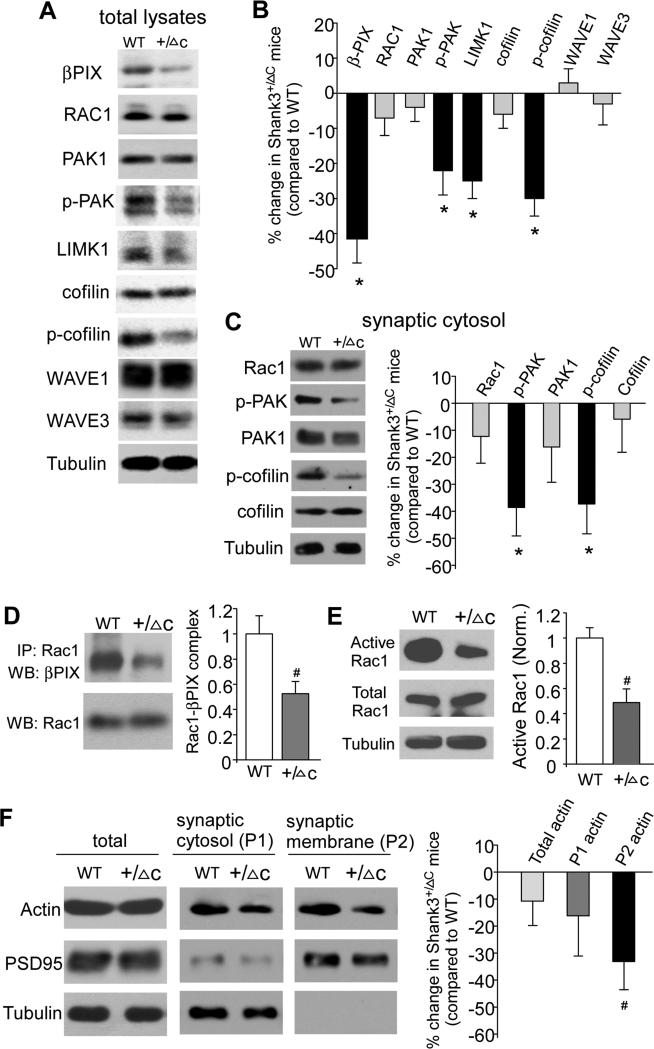
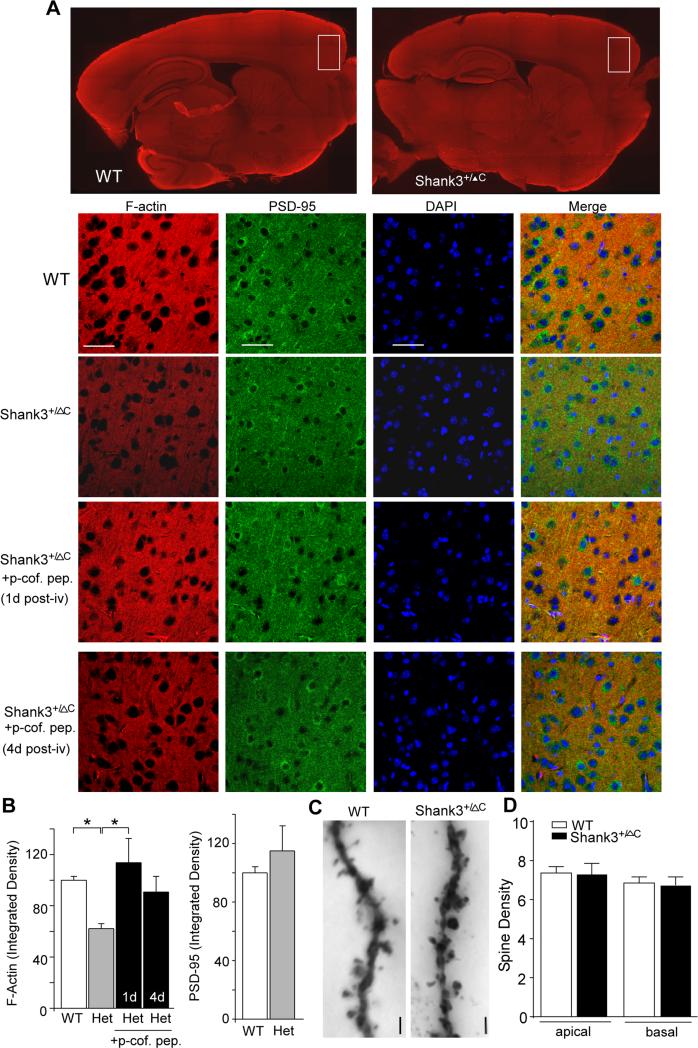
Haploinsufficiency of the Shank3 gene, which encodes a scaffolding protein at glutamatergic synapses, is a highly prevalent and penetrant risk factor for autism. Using combined behavioral, electrophysiological, biochemical, imaging, and molecular approaches, we find that Shank3-deficient mice exhibit autism-like social deficits and repetitive behaviors, as well as the significantly diminished NMDA receptor (NMDAR) synaptic function and synaptic distribution in prefrontal cortex. Concomitantly, Shank3-deficient mice have a marked loss of cortical actin filaments, which is associated with the reduced Rac1/PAK activity and increased activity of cofilin, the major actin depolymerizing factor. The social deficits and NMDAR hypofunction are rescued by inhibiting cofilin or activating Rac1 in Shank3-deficient mice and are induced by inhibiting PAK or Rac1 in wild-type mice. These results indicate that the aberrant regulation of synaptic actin filaments and loss of synaptic NMDARs contribute to the manifestation of autism-like phenotypes. Thus, targeting actin regulators provides a strategy for autism treatment.


Figures

Figure 1
Figure 1. Shank3-deficient mice exhibit social deficits and repetitive behaviors
A Western blots and bar graphs (mean ± SEM) showing the loss of endogenous full-length Shank3 (FL-Shank3) isoforms in the total cortical lysates and postsynaptic density (PSD) fraction of frontal cortex from heterozygous mice expressing C-terminal deleted Shank3, Shank3+/ΔC. Antibodies against Shank3 SH3 domain, PDZ domain or C-term were used. *: p<0.001, T-test. B, Bar graphs (mean ± SEM) showing the time spent investigating either the social (Soc1) or nonsocial (NS1) stimulus in sociability testing (phase 2) in male wild-type (WT) vs. Shank3+/ΔC mice. *: p<0.001, WT vs. Shank3+/ΔC; #: p<0.001, ##: p<0.01, Soc1 vs. NS1, two-way ANOVA. C, Bar graphs (mean ± SEM) showing the preference index for investigating different stimuli at 3 phases of sociability testing in WT vs. Shank3+/ΔC mice. *: p<0.001, T-test. D, Bar graphs (mean ± SEM) showing the number of midline crossing in locomotion tests, the time spent in the center during open-field tests, the latency to fall during rotarod tests, and the time spent self-grooming in WT vs. Shank3+/ΔC mice. *: p<0.01, T-test. E, Bar graphs (mean ± SEM) showing the time spent investigating either the Soc1 or NS1 stimulus in sociability testing (phase 2) in WT mice receiving a PFC injection of either saline or APV (1 mM, 1 μL each side). *: p<0.001, saline vs. APV; #: p<0.001, ##: p<0.01, Soc1 vs. NS1, two-way ANOVA. F, Bar graphs (mean ± SEM) showing the preference index for investigating different stimuli at 3 phases of sociability testing in WT mice receiving a PFC injection of either saline or APV. *: p<0.01, T-test. See also Figure S1, Movies S1-S3.
Figure 2
Figure 2. Shank3-deficient mice show the diminished NMDAR synaptic function and synaptic distribution in prefrontal cortex
A, B, Input-output curves (mean ± SEM) of NMDAR-EPSC (A) and AMPAR-EPSC (B) in response to a series of stimulation intensities in PFC pyramidal neurons from male WT vs. Shank3+/ΔC mice. *: p<0.01, ANOVA. Inset: representative EPSC traces at different stimuli. Scale bars: 40 pA, 100 ms (NMDA); 50 pA, 25 ms (AMPA). C, Bar graphs (mean ± SEM) of the NMDAR- to AMPAR-EPSC ratio in WT vs. Shank3+/ΔC mice. *: p<0.01, T-test. Inset: Representative traces of NMDAR-EPSC and AMPAR-EPSC recorded in the same PFC pyramidal neurons from WT vs. Shank3+/ΔC mice. Scale bar: 20 pA, 100 ms. D, Immunoblots showing the expression of NMDAR and AMPAR subunits in the Triton-insoluable synaptosomal fraction or the total lysate of frontal cortical slices from WT vs. Shank3+/ΔC mice. E, Quantification (mean ± SEM) of the alteration of synaptosomal (normalized to PSD-95) and total (normalized to Tubulin) glutamate receptors in Shank3+/ΔC mice, compared to WT mice. *: p<0.01, WT vs. Shank3+/ΔC, T-test. See also Figure S2 and S3.
Figure 3
Figure 3. Shank3-deficient mice exhibit decreased Rac1/PAK signaling, increased cofilin activity, and reduced synaptic F-actin in prefrontal cortex
A, Immunoblots showing the expression of actin regulators, such as βPIX (the GEF involved in Rac1 activation), Rac1, PAK1, p-PAK (active PAK1/2/3), LIMK1, cofilin, pcofilin (inactive cofilin), WAVE1 and WAVE3 in total lysates from PFC of WT vs. Shank3+/ΔC mice. B, Quantification (mean ± SEM) of the alteration of actin regulators in Shank3+/ΔC mice. *: p<0.01, WT vs. Shank3+/ΔC, T-test. C, Immunoblots and quantification (mean ± SEM) showing the alteration of actin regulators in the cytosolic fraction of synapses from PFC of Shank3+/ΔC mice. *: p<0.01, WT vs. Shank3+/ΔC, T-test. D, E, Representative blots and quantification (mean ± SEM) showing the active Rac1 (D: βPIX-bound, E: GST-PBD pulldown) and total Rac1 in WT vs. Shank3+/ΔC mice. PBD: PAK1 protein-binding domain. #: p<0.05, T-test. F, Immunoblots and quantification (mean ± SEM) showing actin in the Triton-soluable synaptic cytosolic fraction (G-actin) vs. Triton-insoluable synaptic membrane fraction (F-actin) from PFC of WT vs. Shank3+/ΔC mice. #: p<0.05, T-test. See also Figure S4.
Figure 4
Figure 4. Shank3-deficient mice have the reduced F-actin level in prefrontal cortex, which is restored by inhibition of cofilin
A, High magnification confocal images (40x) of F-actin staining with phalloidin (co-stained with PSD-95 and DAPI) in PFC slices of WT vs. Shank3+/ΔC mice without or with an i.v. injection of the brain-permeable cofilin inhibitory peptide, TAT-p-cofilin peptide (15 pmol/g). Scale bars: 50 μm. Shown at the top are low magnification (5×) images of F-actin staining in semi-sagittal slices of WT vs. Shank3+/ΔC mice. B, Quantification (mean ± SEM) of F-actin and PSD-95 levels (integrated densities) in PFC slices of different animal groups. *: p<0.01, one-way ANOVA. C, Representative images of Golgi-stained apical dendrites in PFC pyramidal neurons from WT and Shank3+/ΔC mice. Scale bar, 2 μm. D, Quantification (mean ± SEM) of apical and basal dendritic spine densities in PFC neurons from WT vs. Shank3+/ΔC mice. See also Figure S2 and S3.
Figure 5
Figure 5. Inhibition of cofilin rescues ASD-like behaviors and restores NMDAR function in Shank3-deficient mice
A, Bar graphs (mean ± SEM) showing the time spent investigating either the social (Soc1) or nonsocial (NS1) stimulus during phase 2 of sociability testing in Shank3+/ΔC mice with an i.v. injection of TAT-p-cofilin peptide or TAT control peptide (15 pmol/g). *: p<0.01, control vs. p-cofilin peptide; #: p<0.001, ##: p<0.01, Soc1 vs. NS1, two-way ANOVA. B, Plots (mean ± SEM) of social preference index (phase 2) in Shank3+/ΔC mice with an i.v. injection of TAT-p-cofilin peptide or TAT control peptide at different time points. *: p<0.001, control vs. p-cofilin peptide; #: p<0.001, pre- vs. post-injection, two-way rmANOVA. C, Plots (mean ± SEM) of the time engaged in self-grooming behavior in Shank3+/ΔC mice with an i.v. injection of TAT-p-cofilin peptide or TAT control peptide at different time points. *: p<0.05, control vs. p-cofilin peptide; #: p<0.001, pre- vs. post-injection, two-way rmANOVA. D, Bar graphs (mean ± SEM) showing the preference index for investigating different stimuli at 3 phases of sociability testing in Shank3+/ΔC mice with a local (PFC) injection of TAT-p-cofilin eptide (5 μM, 1 μL per side) or TAT control peptide. *: p<0.01, T-test.E, F, Bar graphs (mean ± SEM) of the NMDAR- to AMPAR-EPSC ratio (E) and input-output curves (mean ± SEM) of NMDAR-EPSC (F) in PFC pyramidal neurons from WT vs Shank3+/ΔC mice receiving a systemic injection of TAT-p-cofilin peptide or TAT control peptide (15 pmol/g, i.v.). Recordings were performed at 1-day or 5-day post-injection. *: p<0.01, one-way ANOVA (E). *: p<0.05, two-way ANOVA (F). G, Input-output curves (mean ± SEM) of NMDAR-EPSC in PFC pyramidal neurons from WT vs Shank3+/ΔC mice with a local injection of TAT-p-cofilin peptide or TAT control peptide to PFC. *: p<0.01, ANOVA. H, I, Immunoblots and quantification (mean ± SEM) of the expression of NR1 and NR2A in the Triton-insoluable synaptosomal fraction of frontal cortical tissues from WT vs. Shank3+/ΔC mice injected with TAT-p-cofilin peptide or TAT control peptide (15 pmol/g, i.v.). Western blots were performed at 1-day or 4-day post-injection. #: p<0.05, *: p<0.01, ANOVA. See also Figure S5, S6, and Movies S4-S7.
Figure 6
Figure 6. Inhibition of PAK induces social deficits and NMDAR hypofunction in wild-type mice
A, B, Immunoblots and quantification (mean ± SEM) of p-PAK, PAK1, p-cofilin, and cofilin in PFC slices from WT mice injected with TAT-PAK18 inhibitory peptide (15 pmol/g, i.v.) or TAT control peptide. *: p<0.05, **: p<0.01, T-test. C, D, Bar graphs (mean ± SEM) showing the time spent investigating either the social or nonsocial stimulus during phase 2 of sociability testing (C) and the preference index at 3 phases of sociability testing (D) in WT mice injected with TAT-PAK18 or TAT control peptide. *: p<0.001, control vs. PAK18 peptide; #: p<0.001, ##: p<0.01, Soc1 vs. NS1, two-way ANOVA (C). *: p<0.01, T-test (D). E, Input-output curves (mean ± SEM) of NMDAR-EPSC in WT mice injected with TAT-PAK18 or TAT control peptide. #: p<0.05, ANOVA. Inset: representative NMDAR-EPSC traces. Scale bars: 40 pA, 200 ms.
Figure 7
Figure 7. Social deficits and NMDAR hypofunction are induced by suppressing Rac1 activity in wild-type mice, and rescued by elevating Rac1 activity in Shank3-deficient mice
A, A low magnification (5×) image of a coronal slice showing the GFP HSV-infected medial PFC region. Inset: a confocal image (40×) of HSV-infected PFC neurons. B, C, Bar graphs (mean ± SEM) showing the preference index for 3 phases of sociability testing in WT mice with PFC injection of dominant-negative Rac1 (DN-Rac1) HSV (B), or in Shank3+/ΔC mice with PFC injection of constitutively active Rac1 (CA-Rac1) HSV (C). GFP HSV was used as a control. *: p<0.01, T-test. D, E, Input-output curves (mean ± SEM) of NMDAR-EPSC in WT mice with PFC injection of DN-Rac1 HSV (D) or in Shank3+/ΔC mice with PFC injection of CA-Rac1 HSV (E). *: p<0.01, ANOVA.

References

    1. Aarts M, Liu Y, Liu L, Besshoh S, Arundine M, et al. Treatment of ischemic brain damage by perturbing NMDA receptor-PSD-95 protein interactions. Science. 2002;298:846–850. - PubMed
    1. Allen KM, Gleeson JG, Bagrodia S, Partington MW, MacMillan JC, et al. PAK3 mutation in nonsyndromic X-linked mental retardation. Nat Genet. 1998;20:25–30. - PubMed
    1. Allison DW, Gelfand VI, Spector I, Craig AM. Role of actin in anchoring postsynaptic receptors in cultured hippocampal neurons: differential attachment of NMDA versus AMPA receptors. J Neurosci. 1998;18:2423–36. - PMC - PubMed
    1. Anderson SW, Bechara A, Damasio H, Tranel D, Damasio AR. Impairment of social and moral behavior related to early damage in human prefrontal cortex. Nat Neurosci. 1999;2:1032–1037. - PubMed
    1. Arber S, Barbayannis FA, Hanser H, Schneider C, Stanyon CA, Bernard O, Caroni P. Regulation of actin dynamics through phosphorylation of cofilin by LIM-kinase. Nature. 1998;393:805–809. - PubMed

Publication types

MeSH terms