. 2015 Jun 1:6:7254.
doi: 10.1038/ncomms8254.

Platelet actin nodules are podosome-like structures dependent on Wiskott-Aldrich syndrome protein and ARP2/3 complex

Affiliations

Platelet actin nodules are podosome-like structures dependent on Wiskott-Aldrich syndrome protein and ARP2/3 complex

Natalie S Poulter et al. Nat Commun. .

Abstract

The actin nodule is a novel F-actin structure present in platelets during early spreading. However, only limited detail is known regarding nodule organization and function. Here we use electron microscopy, SIM and dSTORM super-resolution, and live-cell TIRF microscopy to characterize the structural organization and signalling pathways associated with nodule formation. Nodules are composed of up to four actin-rich structures linked together by actin bundles. They are enriched in the adhesion-related proteins talin and vinculin, have a central core of tyrosine phosphorylated proteins and are depleted of integrins at the plasma membrane. Nodule formation is dependent on Wiskott-Aldrich syndrome protein (WASp) and the ARP2/3 complex. WASp(-/-) mouse blood displays impaired platelet aggregate formation at arteriolar shear rates. We propose actin nodules are platelet podosome-related structures required for platelet-platelet interaction and their absence contributes to the bleeding diathesis of Wiskott-Aldrich syndrome.


Figures
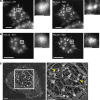
Figure 1
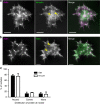
Figure 1. Comparison of SIM and epifluorescent imaging of platelet actin nodules.
Epi-fluorescent images (left hand panel) of (a) human and (b) mouse platelets spreading on fibrinogen and stained for F-actin with Alexa488-phalloidin. The actin nodules in the boxed regions are shown enlarged in the zoomed image. The right hand panel shows SIM images of the same platelets with increased detail seen in the boxed actin nodule shown in the zoomed picture. Arrows indicate the actin fibres radiating from and connecting different actin nodules together. (c) Scanning electron micrograph of a representative human platelet displaying actin nodules. The right panel shows an enlargement of the boxed region in the left panel. Regions that could be multiple bright foci of actin are indicated by the arrowheads and interconnecting fibres by the arrows. Scale bars, 2 μm main image, boxed region: 0.5 μm.
Figure 2
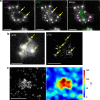
Figure 2. Organization of integrin at actin nodules using SIM.
(a) Z-projections of a 3D SIM image of a human platelet stained for F-actin with Alexa568-phalloidin (left panel), FITC-anti-αIIb (middle panel) and the merged image (right panel, actin=magenta, integrin=green). Arrowheads in middle panel indicate integrin depleted zones corresponding with the position of actin nodules. (b) Line scans showing the intensity of actin (magenta) and integrin (green) fluorescence signal at an area where there is no actin nodule (dotted line), at an actin nodule showing integrin depleted region (dashed line) and at an actin nodule showing integrin depleted region and edge enrichment (solid line). Scale bars, 2 μm.
Figure 3
Figure 3. Quantitative analysis of integrin at actin nodules using dSTORM.
(a) Human platelet stained with Alexa488-phalloidin and imaged for F-actin using diffraction limited TIRF to identify the nodules (left panel) and Alexa647-anti-αIIb and imaged using super-resolution dSTORM TIRF (right panel). Actin nodules and the corresponding integrin depleted zones are indicated by arrows. (b) Quantitative cluster mapping analysis of integrin localization on the platelet surface (different cells to that shown in part (a)). One micrometre square regions of interest were taken around regions without (top row) and with (middle and bottom rows) actin nodules. For each sample, the left hand panel shows the dSTORM picture, the middle panel shows the cluster heat map and the right hand panel shows the thresholded image showing the integrin depleted zones detected in the distribution of integrin on the platelet surface. The dotted yellow line indicates the position of the F-actin dense core. The actin nodule in the middle row shows no clustering of the integrin around the nodule whereas the one seen in the bottom row appears to show integrin clustering (arrows). Scale bar, a: 2 μm, b: 0.5 μm.
Figure 4
Figure 4. Organization of talin and vinculin at actin nodules using SIM.
SIM images of human platelets stained with Alexa488-phalloidin (left panel) and (a) Alexa568-anti-vinculin (middle panel) or (b) Alexa568-anti-talin. The merged images are shown in the right hand panel (actin=magenta, vinculin/talin=green) showing localization of vinculin and talin at actin nodules. In (a) and (b), arrows indicate the actin-rich nodule core and arrows head the ring of vinculin or talin around this core. (c) Quantification of the pattern of localization of talin and vinculin at the actin nodules by line scan intensity profiles. The line scan profile was scored as either enriched around the nodule; enriched at the centre of the actin nodule core; or no obvious enrichment at the nodule and the percentage of nodules displaying each pattern was plotted. Bars represent mean±s.d. from three independent experiments. In total 738 nodules were measured for talin and 667 nodules were measured for vinculin. Scale bars, 2 μm.
Figure 5
Figure 5. SIM and dSTORM imaging of protein phosphorylation at actin nodules.
(a) SIM images of a human platelet stained with Alexa488-phalloidin (left panel) and Alexa568-anti-pTyr (middle panel) and the merged image (right panel, actin=magenta, pTyr=green). The presence of tyrosine phosphorylated proteins can be seen as punctate staining across the platelet with a greater intensity and larger foci observed at actin nodules (two examples indicated by arrows). (b) TIRF image of Alexa488-phalloidin labelled human platelet (left panel) with arrows indicating the actin nodules and a dSTORM image of the same cell labelled with Alex647-anti-pTyr (right panel). This confirms the results seen with SIM in that tyrosine phosphorylated proteins are more concentrated at actin nodules (arrows). The asterisk indicates an actin nodule that resolves as two separate foci of pTyr labelling in the super-resolution image. (c) Enlargement of the boxed region from (b) of the pTyr signal at a single actin nodule (left panel). Quantitative cluster mapping of the image (right panel) confirms that phosphorylated proteins are highly clustered at the actin nodule as indicated by the high L(r) value (according to the pseudocolour scale shown to the right of the cluster map). Scale bars, ab: 2 μm, c: 0.5 μm.
Figure 6
Figure 6. Characterization of actin nodule dynamics by live cell TIRF imaging.
(a) Frames taken from time-lapse TIRF movies of three representative Lifeact-GFP mouse platelets spreading on fibrinogen (See Supplementary Movie 1) showing the dynamic nature of actin nodule formation and turnover. Arrows indicate turnover of three individual actin nodules. Time stamp=min:s. Scale bar, 5 μm. (b) Quantification of the mean number of actin nodules per platelet over time (solid line). Dashed and dotted lines represent±s.d. (c) Frequency histogram of the lifetime of individual actin nodules. (d) Mean surface area of individual actin nodules normalized for lifetime. Bars represent the mean surface area of the nodule at initial appearance (0% of lifetime), disappearance (100% of lifetime) and at 25, 50 and 75% of their lifetime. Error bars indicate the s.d. For (bd) data are means of 20 platelets from two independent experiments. (e) Representative mean fluorescence intensity plot of a single actin nodule imaged over time in both TIRF (dashed line) and epifluorescence (solid line). Intensity increases are larger in TIRF than in epifluorescence indicating movement of the nodule in the z axis towards the coverslip. This Z movement has been calculated in nm and is shown for this nodule in (f). Appearance of the nodule at T0 is set at 0 nm and movement towards the coverslip is indicated by negative nm values. (g) Frequency distribution of movement in Z (in nm) of 118 nodules from three independent experiments.
Figure 7
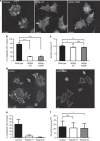
Figure 7. WASp is required for the formation of actin nodules in mouse and human platelets.
(a) SIM images of Alexa488-phalloidin labelled platelets from wild type (left panel), WASp KO (middle panel) and WASp Y293F (right panel) mouse platelets. Platelets from both the WASp KO and WASp Y293F did not form conventional actin nodules as seen in wild-type platelets. (b) Quantification of the number of platelets displaying actin nodules. Data are means±s.d. (n=3). ***P<0.001 from one way ANOVA. (c) Quantification of the surface area of spread platelets from wild type, WASp-KO and WASp-Y293F mice. Data are means±s.d. (n=3), *P<0.05 from one way ANOVA. Approximately 400 platelets were analysed for each genotype. (d) SIM images of Alexa488-phalloidin labelled human platelets from control (left panel) and Wiskott–Aldrich syndrome patient (WAS patient#2—right panel). Platelets from the patient samples did not form actin nodules as could be seen in the control samples. (e) Quantification of the percentage of platelets per field of view displaying actin nodules. Data are means±s.d. (f) Quantification of the surface area of spread platelets from control and WAS patients. Data are means±s.d. *P=0.02 from ANOVA and Tukey's multiple comparisons. More than 125 platelets were analysed for each control and patient sample. Scale bars, 2 μm.
Figure 8
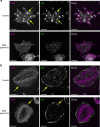
Figure 8. Comparison of Arp2/3 localization in control and WAS patient platelets.
(a) SIM images of human platelets stained with Alexa488-phalloidin (left panel) and Alexa568-anti-p34 (middle panel) and the merged image (right panel, actin=magenta, p34=green). The localization of ARP2/3 complex at actin nodules can be observed in control platelets (top row, arrows indicate two examples); however, in WASp platelets no actin nodules and therefore no bright foci of ARP2/3 complex were observed. (b) The localization of ARP2/3 complex at lamellipodia in fully spread platelets is the same in both control and WAS patient samples indicating that ARP2/3 complex activity downstream of other NPFs is unaffected by the loss of WASp. Scale bars, 2 μm.
Figure 9
Figure 9. Effect of WASp KO on platelet adhesion and aggregation under flow conditions.
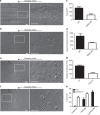
Differential interference contrast (DIC) microscopy images of a representative field of view (FOV) from (a) WT and (b) WASp-KO mouse blood flowed over collagen-coated capillaries at a shear rate of 3,000 s−1 (left panel) with an enlargement of the boxed region (right panel). The failure of WASp-KO platelets to form aggregates can clearly be seen. Quantification of the aggregates in terms of their (c) size and (d) volume. DIC images of (e) WT and (f) WASp-KO mouse blood flowed over fibrinogen coated capillaries at a shear rate of 600 s−1 (left panel) with an enlargement of the boxed region (right panel). The reduction in both the number of platelets adhered and the extent of their spreading is clearly observed and is quantified in (g) and (h). Scale bars, 10 μm. Bars in (c,d,g and h) represent mean±s.e.m. of 10 FOV per experiment from three independent experiments.
Figure 10
Figure 10. Schematic showing structural organization of the actin nodule.
Actin nodules are an interconnected array of structures that consist of (i) a central WASp—ARP2/3 dependent actin core, which is rich in tyrosine phosphorylated proteins, (ii) a region under the core which is depleted of αIIbβ3 integrin, (iii) a ring structure containing talin and vinculin and (iv) actin filaments which radiate out to other nodules. We hypothesize that the actin polymerization-driven downward movement of the membrane (red arrow) causes the physical exclusion of integrin from the centre of the nodule. This generates tension in the actin filaments linking adjacent actin nodules (purple arrows) and so plays a mechano-sensory role important for maintaining platelet adhesion in blood flow.

References

    1. Boyles J., Fox J. E., Phillips D. R. & Stenberg P. E. Organization of the cytoskeleton in resting, discoid platelets: preservation of actin filaments by a modified fixation that prevents osmium damage. J. Cell Biol. 101, 1463–1472 (1985). - PMC - PubMed
    1. Hartwig J. H. & DeSisto M. The cytoskeleton of the resting human blood platelet: structure of the membrane skeleton and its attachment to actin filaments. J. Cell Biol. 112, 407–425 (1991). - PMC - PubMed
    1. Falet H. et al. A novel interaction between FlnA and Syk regulates platelet ITAM-mediated receptor signaling and function. J. Exp. Med. 207, 1967–1979 (2010). - PMC - PubMed
    1. McCarty O. J. et al. Rac1 is essential for platelet lamellipodia formation and aggregate stability under flow. J. Biol. Chem. 280, 39474–39484 (2005). - PMC - PubMed
    1. Pollitt A. Y. et al. Phosphorylation of CLEC-2 is dependent on lipid rafts, actin polymerization, secondary mediators, and Rac. Blood 115, 2938–2946 (2010). - PubMed

Publication types

MeSH terms