. 2015 Jun 8;33(5):507-21.
doi: 10.1016/j.devcel.2015.04.021. Epub 2015 May 28.

HIF1α Represses Cell Stress Pathways to Allow Proliferation of Hypoxic Fetal Cardiomyocytes

Affiliations

HIF1α Represses Cell Stress Pathways to Allow Proliferation of Hypoxic Fetal Cardiomyocytes

Nuno Guimarães-Camboa et al. Dev Cell. .

Abstract

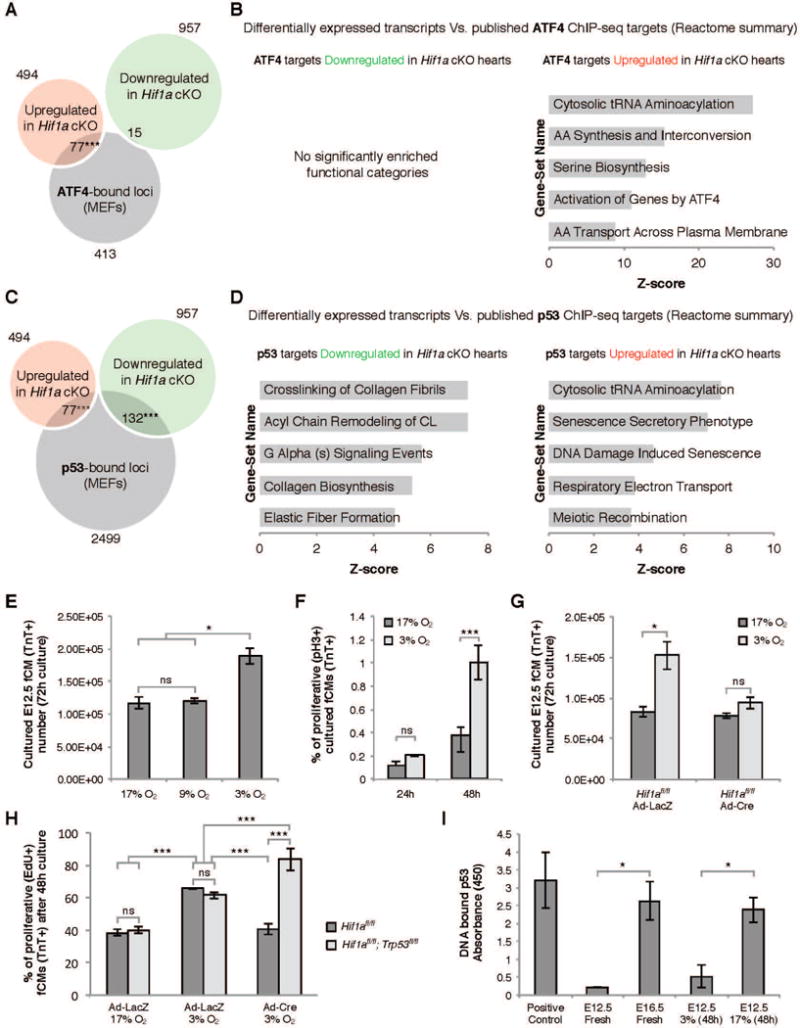
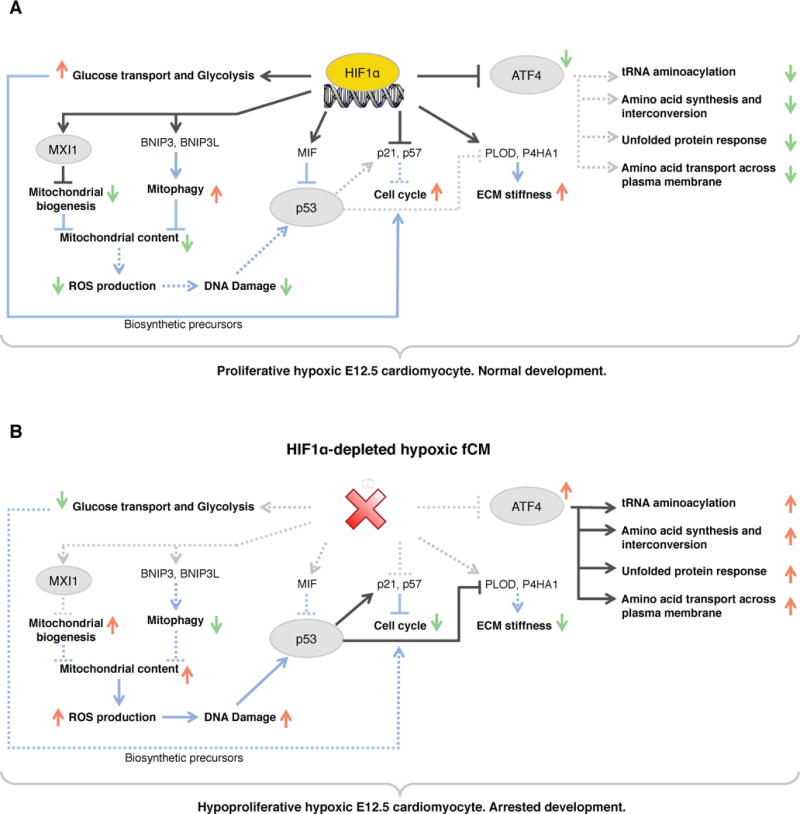
Transcriptional mediators of cell stress pathways, including HIF1α, ATF4, and p53, are key to normal development and play critical roles in disease, including ischemia and cancer. Despite their importance, mechanisms by which pathways mediated by these transcription factors interact with one another are not fully understood. In addressing the controversial role of HIF1α in cardiomyocytes (CMs) during heart development, we discovered a mid-gestational requirement for HIF1α for proliferation of hypoxic CMs, involving metabolic switching and a complex interplay among HIF1α, ATF4, and p53. Loss of HIF1α resulted in activation of ATF4 and p53, the latter inhibiting CM proliferation. Bioinformatic and biochemical analyses revealed unexpected mechanisms by which HIF1α intersects with ATF4 and p53 pathways. Our results highlight previously undescribed roles of HIF1α and interactions among major cell stress pathways that could be targeted to enhance proliferation of CMs in ischemia and may have relevance to other diseases, including cancer.


Figures

Figure 1
Figure 1. Bioinformatics prediction of transcription factors that regulate fetal cardiomyocyte proliferation
A) Based on common expression trends, transcripts differentially expressed in cardiac development or adult remodeling (physiological and/or pathological) were grouped into 9 distinct clusters. Enriched Gene Ontology (GO) terms revealed biological processes associated with each cluster. Cluster 1 contained genes associated with cell cycle, strongly expressed in development and attenuated perinatally. B) Analysis for enrichment of evolutionarily conserved TF binding sites within the proximal promoters of all Cluster 1 genes, revealing candidate TF regulators of fCM proliferation. See also Table S1.
Figure 2
Figure 2. Spatiotemporal dynamics of HIF1α protein during cardiogenesis
A–C) In E9.5 fCMs, HIF1α was retained in extra-nuclear aggregates (arrow in C). D–F) At E12.5, HIF1α accumulated in nuclei of fCMs located in non-vascularized areas of the myocardium, including fCMs of the inner core of the interventricular septum (IVS), and outermost layers of the compact wall (arrowheads) G–I) At E14.5, the coronary vascular system has colonized most of the ventricular free walls. At this stage, most fCMs displayed cytoplasmic HIF1α (arrow in I) and only a small fraction of fCMs located between the endocardium and the leading edge of the progressing coronary vasculature exhibited significant levels of nuclear HIF1α (boxed area in H and arrowheads in I). J–L) At E17.5, the coronary vascular system has colonized the entire heart and HIF1α was no longer detectable in the nucleus of fCMs, being present only in cytoplasmic aggregates (arrows in L). To allow better visualization of the location of HIF1α relative to the coronary endothelium, all 40× images are shown in two distinct panels: a four-color merge and a red and green only merge. Boxed areas are imaged in higher magnifications. Bars represent 500μm in the 10× montages and 20 μm in all other panels. See also Figure S1.
Figure 3
Figure 3. Efficient ablation of HIF1α in fCMs results in hypoplasia and arrested cardiac development
A) At E12.5, efficient depletion of HIF1α mediated by Nkx2-5-Cre resulted in shortened interventricular septa (IVS) (arrow in middle panels). At E14.5, (bottom panels), mutant hearts exhibited ventricular septal defects (asterisk) and hypoplastic ventricles. B) Quantification of septal length in medial sections of control and cKO hearts. C) Quantification of left ventricular wall thickness in E14.5 hearts. D) E11.5 was the first stage at which a clear decrease in HIF1α protein levels was identified in Hif1 cKO hearts (top panels). At E12.5, lack of HIF1α resulted in markedly lower numbers of EdU positive nuclei (two hour pulse) in the IVS (middle panel) and compact ventricular myocardium (lower panel). E) Quantification of proliferative defects in distinct compartments of E12.5 hearts as a ratio of EdU positive fCMs/Total fCMs. F) Apoptotic mesenchymal cells were equally abundant in the atrioventricular (A–V) cushions of control and mutant hearts, but no evidence of apoptotic fCMs was detected in the compact wall of either genotype. Bars represent 500μm in A and 50 μm in all other panels. LV=left ventricle. B, C and E: data represented as mean ± SD; ***P<0.001; **P<0.01. See also Figure S2.
Figure 4
Figure 4. Identification of direct HIF1α targets in E12.5 fCMs
A) Comparison of control and Hif1α cKO E12.5 cardiac transcriptomes (n=3 for each genotype) unveiled a total of 1451 genes modulated in mutant hearts. B) REACTOME database functional clustering of genes down- and up-regulated in cKOs, highlighting cellular processes most significantly affected in mutant hearts. C) Overlay of RNA-seq and ChIP-seq results revealed 166 likely direct targets of HIF1α. D) REACTOME functional clustering of these genes allowed for identification of cellular functions directly regulated by HIF1α. *category containing the G1/S transition inhibitor p21. E) Immunostaining validation of RNA-seq results in the left ventricular free wall or IVS (MIF) of E12.5 hearts. Bars represent 20 μm. AA=amino acid; ECM=extracellular matrix; GPVI=glycoprotein VI. See also Figure S3 and Tables S2, S3 and S4.
Figure 5
Figure 5. Intersections between HIF1α, ATF4 and p53
A) Overlap between genes modulated in Hif1a cKO hearts and ATF4 ChIP-seq data revealed a significant enrichment in ATF4 targets amongst upregulated genes. B) REACTOME functional clustering of ATF4 targets modulated in Hif1a cKO hearts. C) Overlap between genes modulated in Hif1a cKO hearts and p53 ChIP-seq data revealed a significant enrichment in p53 targets amongst both down and upregulated genes. D) REACTOME functional clustering of p53 targets modulated in Hif1a cKO hearts. E) Ex vivo culture of primary E12.5 ventricular cells in different oxygen concentrations revealed that hypoxia (3% O2) promoted an increase in fCM number. This effect was associated with increased proliferation of TroponinT-positive fCMs (F) and was dependent on HIF1α (G). H) Blunted proliferation resulting from absence of HIF1α was further demonstrated by quantification of EdU-positive fCMs and could be rescued by the simultaneous ablation of HIF1α and p53. I) Elisa quantification of p53-DNA binding revealed that during cardiogenesis p53 and HIF1α activity inversely correlated. E–I: data represented as mean ± SD; *P<0.05; ***P<0.05. See also Figure S4 and Table S5.
Figure 6
Figure 6. Model for interactions between HIF1α, ATF4 and p53 in the response to hypoxic stress
A) In hypoxic wild-type fCMs, HIF1α potentiates proliferation by regulating a myriad of cellular functions: carbohydrate metabolism, ECM deposition, OXPHOS, cell cycle, p53 and ATF4 signaling. B) In the absence of HIF1α, hypoxic fCMs failed to adapt their metabolism to low oxygen, ectopically activated ATF4 and p53 pathways and upregulated expression of inhibitors of cell cycle. As consequence, these cells adopted a quiescent phenotype that lead to arrested cardiac development. Red arrows represent upregulation and green arrows represent downregulation. TFs are circled and cellular processes are bold. Black lines represent transcriptional regulation and blue lines represent post-translational interactions or effects. Dashed lines represent inactive interactions. See Figure S5 for a detailed list of all genes involved in the cellular processes highlighted in this diagram.

References

    1. Denko NC. Hypoxia, HIF1 and glucose metabolism in the solid tumour. Nat Rev Cancer. 2008;8:705–713. - PubMed
    1. Dubchak I, Munoz M, Poliakov A, Salomonis N, Minovitsky S, Bodmer R, Zambon AC. Whole-Genome rVISTA: a tool to determine enrichment of transcription factor binding sites in gene promoters from transcriptomic data. Bioinformatics. 2013;29:2059–2061. - PMC - PubMed
    1. Dunwoodie SL. The Role of Hypoxia in Development of the Mammalian Embryo. Dev Cell. 2009;17:755–773. - PubMed
    1. Fels DR, Koumenis C. The PERK/eIF2alpha/ATF4 module of the UPR in hypoxia resistance and tumor growth. Cancer Bio & Ther. 2006;5:723–728. - PubMed
    1. Fingerle-Rowson G, Petrenko O, Metz CN, Forsthuber TG, Mitchell R, Huss R, Moll U, Muller W, Bucala R. The p53-dependent effects of macrophage migration inhibitory factor revealed by gene targeting. Proc Natl Acad Sci USA. 2003;100:9354–9359. - PMC - PubMed

Publication types

MeSH terms

Associated data