. 2015 Jun 18;58(6):1101-12.
doi: 10.1016/j.molcel.2015.04.006. Epub 2015 May 28.

Bidirectional Transcription Arises from Two Distinct Hubs of Transcription Factor Binding and Active Chromatin

Affiliations

Bidirectional Transcription Arises from Two Distinct Hubs of Transcription Factor Binding and Active Chromatin

Benjamin S Scruggs et al. Mol Cell. .

Abstract

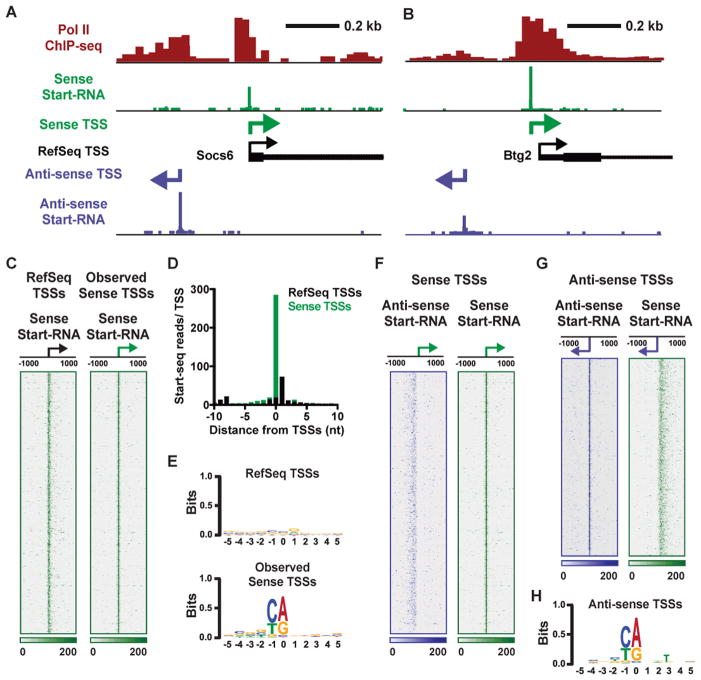
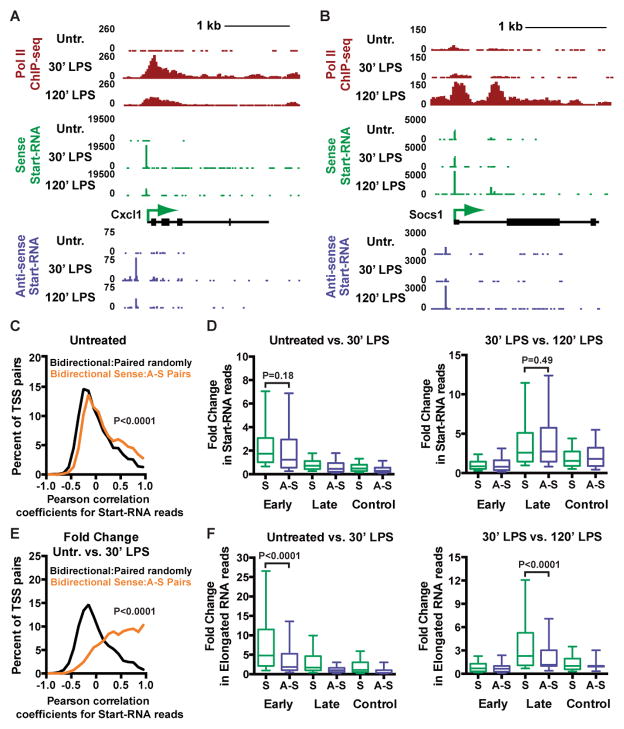
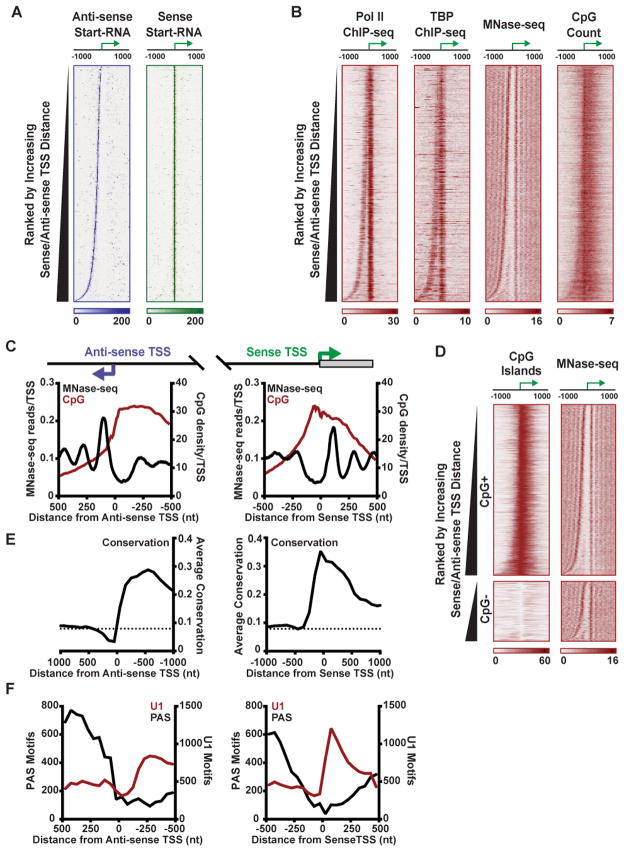
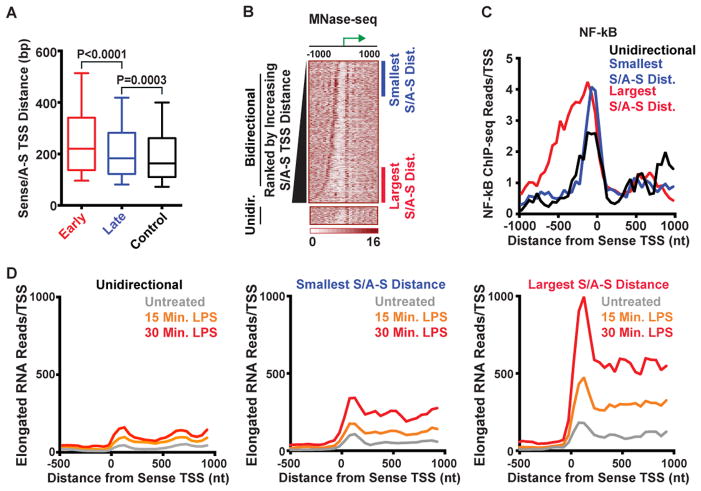
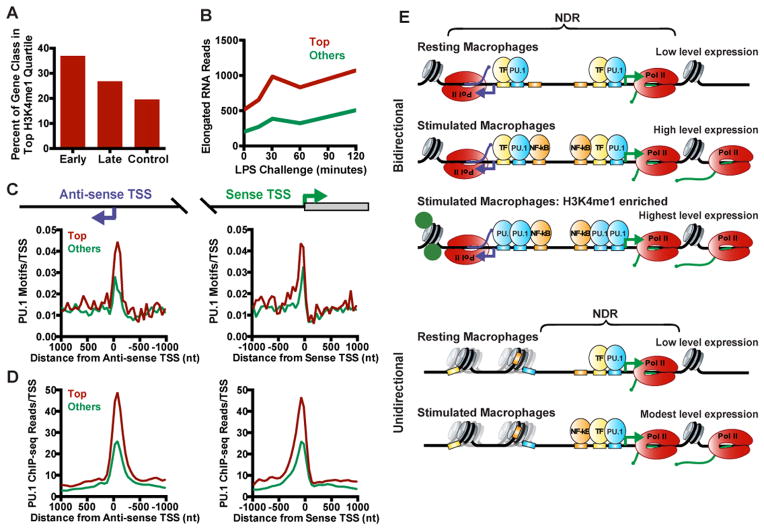
Anti-sense transcription originating upstream of mammalian protein-coding genes is a well-documented phenomenon, but remarkably little is known about the regulation or function of anti-sense promoters and the non-coding RNAs they generate. Here we define at nucleotide resolution the divergent transcription start sites (TSSs) near mouse mRNA genes. We find that coupled sense and anti-sense TSSs precisely define the boundaries of a nucleosome-depleted region (NDR) that is highly enriched in transcription factor (TF) motifs. Notably, as the distance between sense and anti-sense TSSs increases, so does the size of the NDR, the level of signal-dependent TF binding, and gene activation. We further discover a group of anti-sense TSSs in macrophages with an enhancer-like chromatin signature. Interestingly, this signature identifies divergent promoters that are activated during immune challenge. We propose that anti-sense promoters serve as platforms for TF binding and establishment of active chromatin to further regulate or enhance sense-strand mRNA expression.


Figures

Figure 1
Figure 1. High-Resolution Mapping of TSSs Reveals Focused Transcription Initiation in Sense and Anti-sense Directions
(A and B) Pol II ChIP-seq data (red) shows peaks of Pol II at the sense (green arrow) and anti-sense (purple arrow) TSSs. Start-seq data is shown for the Sense strand (green) and Anti-sense strand (purple). RefSeq gene models are shown in black with TSS depicted by arrows. In (A) the RefSeq TSS for Socs6 (black arrow) is aligned exactly with the observed, sense-strand TSS identified by Start-seq data. In (B) the observed sense-strand TSS is slightly offset (38 nt) from RefSeq annotation for the Btg2 gene. (C) Distribution of Start-seq data on the sense strand, aligned around RefSeq annotated TSSs (left, black arrow) or the peak of sense-strand Start-RNA data in this region (right, green arrow), which we term the observed sense TSSs. Color bar at bottom indicates read depth. N=12,228 genes defined as active in mouse macrophages. (D) Average distribution of Start-seq reads at single nucleotide resolution in a 21 nt window centered on either RefSeq (black) or sense TSSs (red). Data are for genes shown in (C). (E) Information content in a ± 5 nt window around RefSeq and sense TSSs determined by WebLogo. Position 0 indicates the RefSeq (top) or sense TSS (bottom). (F) Sense (green) and Anti-sense (purple) strand Start-RNA reads centered around sense TSSs. Note focused initiation around sense TSSs (right) with dispersed anti-sense signal (left). (G) Sense (green) and Anti-sense (purple) strand Start-RNA reads centered around Anti-sense TSSs (purple arrows) reveal generally focused anti-sense initiation from the 9,219 promoters possessing sufficient Start-seq data for identification of sense and anti-sense TSSs. (H) Information content around anti-sense TSSs as in (E). See also Figure S1.
Figure 2
Figure 2. Gene Activation Leads to Coupled Bidirectional Transcription Initiation, but Pol II only Elongates Effectively in the Sense Direction
(A and B) Pol II ChIP-seq (red), sense Start-RNA (green), and anti-sense Start-RNA (purple) data are shown at representative Early (A) and Late (B) response genes in untreated macrophages or following 30′ or 120′ LPS challenge. Gene models are shown in black with observed sense TSSs depicted by arrows. (C) Distribution of Pearson correlation coefficients for Start-RNAs levels at sense TSSs paired with adjacent anti-sense TSSs (orange) is significantly higher than when paired randomly with other anti-sense TSSs. (D) Fold change in Start-RNA levels in the sense (S) or anti-sense (A–S) TSS region (TSS ±100 bp) was calculated for Early, Late, and Control genes. Fold-changes were calculated between untreated and 30′ LPS-treated macrophages (left), and 30′ and 120′ LPS-treated samples (right). (E) Distribution of Pearson correlation coefficients for fold change in Start-RNA levels between untreated and 30′ LPS-treated macrophages. Bidirectional sense TSSs were paired as in (C). (F) Fold change in elongated nascent RNA levels in the sense (S) or anti-sense (A–S) TSS region (TSS to +250 bp downstream) was calculated for Early, Late, and Control genes, and shown as in (D). See also Figure S2.
Figure 3
Figure 3. Transcription Machinery and Nucleosomes Are Highly Organized around Both Sense and Anti-sense TSSs
(A) Start-RNA reads obtained from macrophages are shown in the anti-sense (purple) and sense (green) direction, both aligned with respect to sense TSSs. Genes are rank ordered by the distance between the sense and anti-sense TSSs. Data shown throughout this figure are for 8,730 Pol II-bound promoters with sufficient Start-seq reads for identification of sense and anti-sense TSSs in resting macrophages. (B) Pol II and TBP ChIP-seq, MNase-seq and CpG dinucleotide count are shown, centered on sense TSSs, with genes rank ordered as in (A). (C) Average distribution of nucleosomes (from MNase-seq, black) and CpG dinucleotide count (red) centered on either the anti-sense (left) or sense (right) TSSs. (D) CpG island distribution and MNase-seq are shown for bidirectional genes categorized as CpG+ (N=6,464) or CpG− (N=2,266), ranked by increasing distance between sense and anti-sense TSSs. (E) Conservation score across placental mammals (phyloP) is shown in 2 kb windows centered on anti-sense or sense TSSs as shown in (C). Dashed line indicates average conservation score across the mouse genome. (F) Number of poly-A sequences (PAS; black) or motifs recognized by U1 snRNP (U1; red) in 50-mer bins centered upon either the anti-sense TSS (left) or sense TSS (right). See also Figure S3.
Figure 4
Figure 4. TF Motifs and Binding are Focused within NDR Between Bidirectional TSSs
(A) Heat maps depict MNase-seq, locations of a consolidated panel of vertebrate TF binding motifs and PU.1 ChIP-seq in a 2 kb window centered on sense TSSs (green arrow). Active CpG+ genes are categorized as bidirectional (N=6,464) or unidirectional (N=1,585). (B) Composite distribution of a consolidated panel of 131 non-redundant vertebrate TF binding motifs (black) and PU.1 motifs (red) in 50-mer bins for bidirectional genes, centered on either the anti-sense (left) or sense (right) TSS. (C) Composite metagene distribution of PU.1 motifs centered on either the anti-sense (left) or sense (right) TSSs at all unidirectional (black) or bidirectional (orange) genes. (D) Average distribution of PU.1 ChIP-seq reads in 50-mer bins is shown in 2 kb windows centered on anti-sense or sense TSSs as shown in (B). (E) Number of PU.1 motifs at CpG+ genes that are unidirectional, or bidirectional with the smallest (blue) or largest (red) sense/anti-sense distances. Motifs were summed in promoter-proximal and promoter-distal windows as described in the text. N=1,585 genes in each group. (F) PU.1 ChIP-seq reads within each window were summed and normalized to the number of PU.1 motifs present. See also Figure S4.
Figure 5
Figure 5. Increased NF-κB binding and Gene Output at Promoters with Distant Anti-sense TSSs
(A) Sense/anti-sense TSS distances for Early response, Late response, and Control gene groups. Median width of Early promoters (220 bp) is significantly greater than that of Late and Control promoters. (B) MNase-seq data shown at Early genes categorized as bidirectional or unidirectional (N=113). Bidirectional genes are ranked by increasing distance between sense/anti-sense TSSs. Genes quartiles with smallest and largest sense and anti-sense distances are indicated at right (N=236 for each). (C) Average NF-κB (left) ChIP-seq signal in stimulated macrophages. Data is shown for Early unidirectional genes as well as bidirectional genes with the smallest vs. largest inter-TSS distances as defined in (B). (D) Elongated nascent RNA reads (Bhatt et al., 2012) are shown for Early response genes in untreated macrophages and macrophages challenged for 15 or 30 minutes with LPS. Data is shown for gene groups defined in (B). See also Figure S5.
Figure 6
Figure 6. Enhancer-like Chromatin Signature Around Anti-sense TSSs
(A and B) Average distribution of H3K4me3 (A) and H3K4me1 (B) ChIP-seq signal for Pol II-bound unidirectional promoters (black; N=2,240) and bidirectional promoters (red; N=8,730) in 50 bp bins centered on sense TSSs. (C) Shown are H3K27Ac and p300 ChIP-seq reads in the region from the sense TSS to −1 kb at unidirectional (black) and bidirectional (orange) genes. Asterisks signify P<0.0001. (D) H3K4me1 ChIP-seq signal at bidirectional promoters in a 2 kb window centered on anti-sense TSSs. Bidirectional promoters are ranked by decreasing H3K4me1 signal in the region from −1 kb to the observed anti-sense TSS, and divided into the top quartile of H3K4me1 (red) and all other quartiles of H3K4me1 signal (green), as shown at right. (E) H3K27ac, p300 and H3K4me3 ChIP-seq reads in the region from the sense TSS to −1 kb at genes from the top quartile of upstream H3K4me1 signal (red) and all other quartiles (green), as shown in (D). Asterisks signify P<0.0001. (F) Elongated nascent RNA (sense TSS to +250 bp) and Start-RNA reads (±100 bp around sense TSS) at H3K4me1 quartiles as shown in (E). Asterisks signify P<0.0001. (G) Enriched GO biological processes among bidirectional promoters with highest levels of H3K4me1 (top quartile). See also Figure S6.
Figure 7
Figure 7. PU.1 Enrichment at Bidirectional TSSs Marks Active and Inducible Genes
(A) Percentage of Early, Late, and Control genes that fall in the top quartile of H3K4me1 signal around anti-sense TSSs. (B) Average elongated RNA reads (sense TSS to +250 bp) for genes in the top quartile of H3K4me1 signal, vs. all other bidirectional genes, across a two hour time course of LPS challenge. (C and D) Average distribution of PU.1 motifs (C) and PU.1 occupancy (D) in 50-mer bins for genes in the top quartile of H3K4me1 vs. all other bidirectional genes, centered on either the anti-sense (left) or sense (right) TSS. (E) Model for transcriptional activity at bidirectional (top) vs. unidirectional (bottom) promoters. At bidirectional promoters, a lineage-specifying factor such as PU.1 (blue) collaborates with other TFs (yellow) to bind the focused region of TF motifs at coupled sense (green) and anti-sense (purple) TSSs. Through the activity of TFs and the transcription machinery, an NDR is established at both TSSs and spreads between the coupled promoters. This process renders additional transcription factor binding motifs accessible (orange boxes). Following stimulation, signal-dependent transcription factors like NF-κB (orange) preferentially bind motifs in the pre-established NDR enabling high transcriptional output. At unidirectional promoters, a limited NDR size and absence of well-positioned upstream nucleosome is observed, such that promoter-distal TF motifs are often occluded by chromatin and unavailable for binding. See also Figure S7.

References

    1. Almada AE, Wu X, Kriz AJ, Burge CB, Sharp PA. Promoter directionality is controlled by U1 snRNP and polyadenylation signals. Nature. 2013;499:360–363. - PMC - PubMed
    1. Amit I, Garber M, Chevrier N, Leite AP, Donner Y, Eisenhaure T, Guttman M, Grenier JK, Li W, Zuk O, et al. Unbiased reconstruction of a mammalian transcriptional network mediating pathogen responses. Science. 2009;326:257–263. - PMC - PubMed
    1. Andersen PK, Lykke-Andersen S, Jensen TH. Promoter-proximal polyadenylation sites reduce transcription activity. Genes Dev. 2012;26:2169–2179. - PMC - PubMed
    1. Berg MG, Singh LN, Younis I, Liu Q, Pinto AM, Kaida D, Zhang Z, Cho S, Sherrill-Mix S, Wan L, Dreyfuss G. U1 snRNP determines mRNA length and regulates isoform expression. Cell. 2012;150:53–64. - PMC - PubMed
    1. Bhatt DM, Pandya-Jones A, Tong AJ, Barozzi I, Lissner MM, Natoli G, Black DL, Smale ST. Transcript dynamics of proinflammatory genes revealed by sequence analysis of subcellular RNA fractions. Cell. 2012;150:279–290. - PMC - PubMed

Publication types

MeSH terms

Associated data