. 2015 Apr;28(2):79-87.
doi: 10.1293/tox.2014-0047. Epub 2015 Feb 9.

Expression and activation of EGFR and STAT3 during the multistage carcinogenesis of intrahepatic cholangiocarcinoma induced by 3'-methyl-4 dimethylaminoazobenzene in rats

Affiliations

Expression and activation of EGFR and STAT3 during the multistage carcinogenesis of intrahepatic cholangiocarcinoma induced by 3'-methyl-4 dimethylaminoazobenzene in rats

Fan Zhang et al. J Toxicol Pathol. 2015 Apr.

Erratum in

  • Errata (Printer's correction).
    [No authors listed] [No authors listed] J Toxicol Pathol. 2016 Jan;29(1):74. Epub 2016 Feb 17. J Toxicol Pathol. 2016. PMID: 26989306 Free PMC article.

Abstract

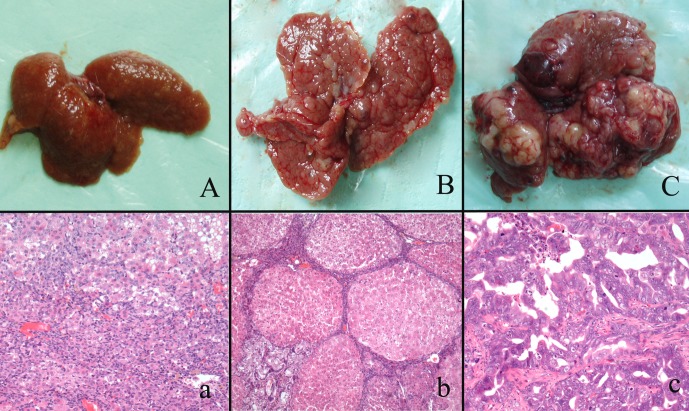
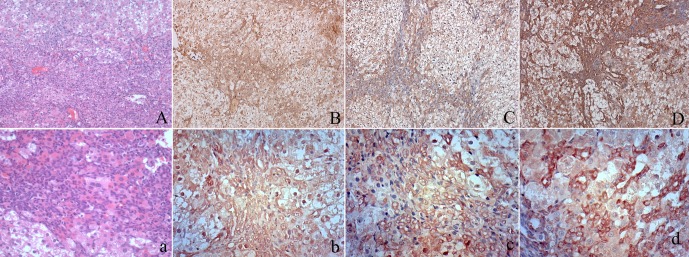
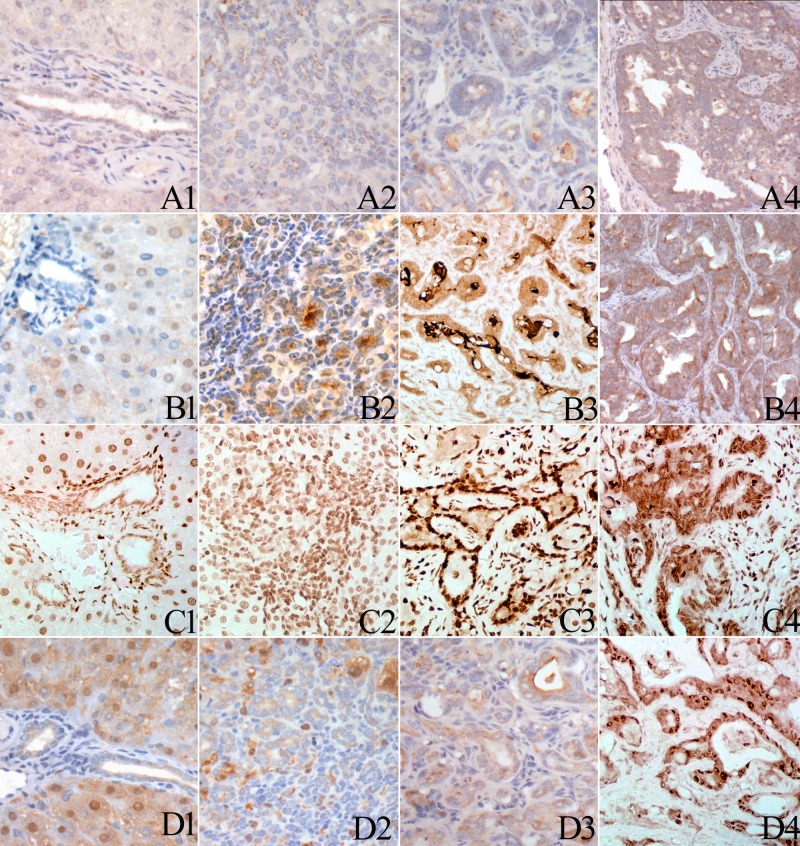
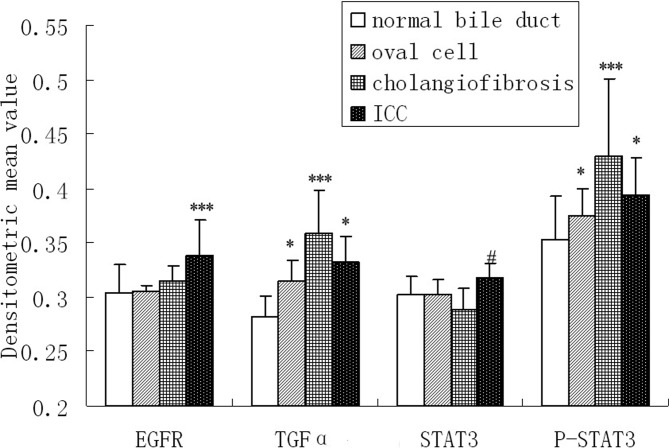
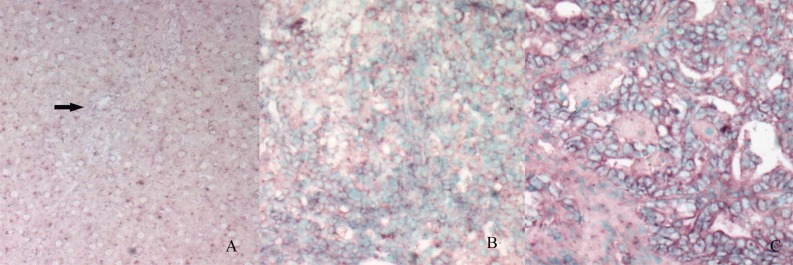
The purpose of this study was to investigate whether the epidermal growth factor receptor (EGFR) and signal transducer and activator of transcription-3 (STAT3) signal pathway contributes to the carcinogenesis of intrahepatic cholangiocarcinoma (ICC) induced by 3'-methyl-4 dimethylaminoazobenzene (3'Me-DAB) in rats. EGFR, TGFα, STAT3 and p-STAT3 in different stages of carcinogenesis were detected by immunohistochemistry (IHC). In situ hybridization (ISH) was applied to investigate the expression of STAT3 mRNA. Oval cells were verified by the immunohistochemical staining of alpha-fetoprotein (AFP), CD133 and epithelial cell adhesion molecules (EpCAM). Sequential development of necrosis, oval cell proliferation, cholangiofibrosis (CF) and ICC was observed in the liver of rats administered 3'Me-DAB. Oval cells showed positive expression of AFP, CD133 and EpCAM. The expression of EGFR was significantly higher in the ICC than in oval cells, CF or normal bile ducts (p<0.05), but there was no difference in EGFR expression between the other groups. The highest expression of p-STAT3 and TGFα was observed in CF. The expression of these two molecules in the ICC and oval cells was significantly higher than in normal bile ducts (p<0.05). Elevation of STAT3 mRNA was detected during carcinogenesis as shown by ISH, strong intensity was observed in the ICC and moderate intensity was observed in oval cells and CF. These observations suggest that the EGFR and STAT3 signal pathway contributes to the carcinogenesis of ICC. High activity of STAT3 during the carcinogenesis of ICC may be the result of high activity of EGFR triggered by TGFα.

Keywords: 3’-methyl-4 dimethylaminoazobenzene; carcinogenesis; epidermal growth factor receptor; intrahepatic cholangiocarcinoma; oval cell; signal transducer and activator of transcription-3.


Figures

Fig. 1.
Fig. 1.
Gross appearances and histological changes at different stages of cholangiocarcinogenesis in the rats. A/a shows massive necrosis of the liver and oval cell proliferation. B/b shows liver cirrhosis and CF in the middle stage of carcinogenesis. C/c shows that malignant nodules arose in the liver.
Fig. 2.
Fig. 2.
Immunohistochemical staining of AFP, CD133 and EpCAM in oval cells. At low magnification, oval cell hyperplasia appears as increased cellularity in portal areas (A). Higher magnification reveals that centrilobular hepatocyte hypertrophy is also present. Some oval cells form glandular structures resembling bile ducts (a). Oval cell proliferations can be seen bridging between adjacent portal areas. Oval cells showed cytoplasmic expression of AFP (B, b) and clear membrane expression of CD133 (C, c) and EpCAM (D, d)
Fig. 3.
Fig. 3.
Immunohistochemical staining of EGFR, TGFα, STAT3 and p-STAT3 in normal bile ducts, oval cells, CF and ICC. Normal bile ducts showed weak membrane or cytoplasmic staining of EGFR (A1). Oval cells (A2) and bile ducts (A3) in CF show membrane aggregation of EGFR expression. Malignant glands in the ICC exhibited strong membrane staining of EGFR (A4). Normal bile ducts showed weak cytoplasmic staining of TGFα (B1). Elevated TGFα expression was detected in oval cells (B2). Strong cytoplastic staining of TGFα was detected in the bile ducts in CF (B3) as well as in the malignant glands in the ICC (B4). Normal bile ducts showed weak nuclear p-STAT3 expression (C1). Elevated p-STAT3 expression was detected in oval cell (C2). Strong nuclear staining of p-STAT3 was detected in the bile ducts in CF (C3) as well as in the malignant glands in the ICC (C4). Normal bile ducts (D1), oval cells (D2) and bile ducts in CF (D3) showed weak cytoplastic staining of STAT3. some hepatocellular nuclei seem positive for STAT3. Some cases of ICC showed strong cytoplastic and nuclear staining of STAT3 (D4).
Fig. 4.
Fig. 4.
IHC results of EGFR, TGFα, STAT3 and p-STAT3 expression in multistage of cholangiocarcinogenesis were semiquantified with an Image-Pro Plus image analysis system. Six different 200× views in each of the 19 cases of ICC, oval cells proliferation area in the livers of rats sacrificed in weeks 5 to 9 after administration of 3’Me-DAB, CF in the livers of rats sacrificed in weeks 12 and 15 after administration of 3’Me-DAB and bile ducts in 10 normal liver tissue specimens of the control group were included in the image analysis. The mean densitometric value was used to represent the staining intensity. Data are expressed as the mean ± standard error (SE). Differences were analyzed using analysis of variance or an independent sample t-test.*** The expression is significantly higher than in other three groups. * The expression in the ICC or oval cell is significantly higher than in normal bile ducts. # The expression of STAT3 in ICC is significantly higher than in CF.
Fig. 5.
Fig. 5.
In situ hybridization analysis of STAT3 mRNA expression in the normal liver and bile duct (A, arrow), oval cells (B) and ICC (C).The purple signals are confined to the cytoplasm. Intense signals are seen in the oval cells area and ICC. (The control section hybridized with prehybridization solution without a probe shows no staining [result not shown]).

References

    1. Wise C, Pilanthananond M, Perry BF, Alpini G, McNeal M, and Glaser SS. Mechanisms of biliary carcinogenesis and growth. World J Gastroenterol. 14: 2986–2989. 2008. - PMC - PubMed
    1. Morise Z, Sugioka A, Tokoro T, Tanahashi Y, Okabe Y, Kagawa T, and Takeura C. Surgery and chemotherapy for intrahepatic cholangiocarcinoma. World J Hepatol. 2: 58–64. 2010. - PMC - PubMed
    1. Yamamoto M, and Ariizumi S. Surgical outcomes of intrahepatic cholangiocarcinoma. Surg Today. 41: 896–902. 2011. - PubMed
    1. Werneburg NW, Yoon JH, Higuchi H, and Gores GJ. Bile acids activate EGF receptor via a TGF-alpha-dependent mechanism in human cholangiocyte cell lines. Am J Physiol Gastrointest Liver Physiol. 285: G31–G36. 2003. - PubMed
    1. Oishi N, and Wang XW. Novel therapeutic strategies for targeting liver cancer stem cells. Int J Biol Sci. 7: 517–535. 2011. - PMC - PubMed