. 2015 May 15:6:105.
doi: 10.3389/fneur.2015.00105. eCollection 2015.

Audiometric characteristics of hyperacusis patients

Affiliations

Audiometric characteristics of hyperacusis patients

Jacqueline Sheldrake et al. Front Neurol. .

Abstract

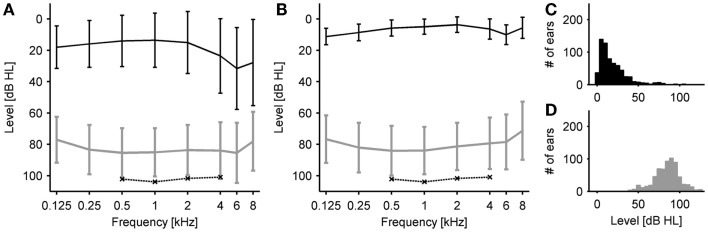
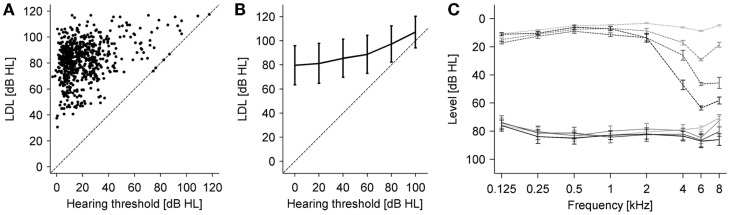
Hyperacusis is a frequent auditory disorder where sounds of normal volume are perceived as too loud or even painfully loud. There is a high degree of co-morbidity between hyperacusis and tinnitus, most hyperacusis patients also have tinnitus, but only about 30-40% of tinnitus patients also show symptoms of hyperacusis. In order to elucidate the mechanisms of hyperacusis, detailed measurements of loudness discomfort levels (LDLs) across the hearing range would be desirable. However, previous studies have only reported LDLs for a restricted frequency range, e.g., from 0.5 to 4 kHz or from 1 to 8 kHz. We have measured audiograms and LDLs in 381 patients with a primary complaint of hyperacusis for the full standard audiometric frequency range from 0.125 to 8 kHz. On average, patients had mild high-frequency hearing loss, but more than a third of the tested ears had normal hearing thresholds (HTs), i.e., ≤20 dB HL. LDLs were found to be significantly decreased compared to a normal-hearing reference group, with average values around 85 dB HL across the frequency range. However, receiver operating characteristic analysis showed that LDL measurements are neither sensitive nor specific enough to serve as a single test for hyperacusis. There was a moderate positive correlation between HTs and LDLs (r = 0.36), i.e., LDLs tended to be higher at frequencies where hearing loss was present, suggesting that hyperacusis is unlikely to be caused by HT increase, in contrast to tinnitus for which hearing loss is a main trigger. Moreover, our finding that LDLs are decreased across the full range of audiometric frequencies, regardless of the pattern or degree of hearing loss, indicates that hyperacusis might be due to a generalized increase in auditory gain. Tinnitus on the other hand is thought to be caused by neuroplastic changes in a restricted frequency range, suggesting that tinnitus and hyperacusis might not share a common mechanism.

Keywords: audiogram; hearing loss; hyperacusis; loudness discomfort levels; tinnitus.


Figures

Figure 1
Figure 1
Hearing thresholds and loudness discomfort levels (LDLs). (A) Average hearing thresholds (black) and LDLs (gray) of all patients. Error bars denote ± 1 SD. Error bars denote ±1 SD. The dashed line indicates LDLs of a reference group with normal hearing thresholds from Sherlock and Formby (12). (B) Average hearing thresholds (black) and LDLs (gray) of a subgroup of patients with clinically normal hearing thresholds. Error bars denote ±1 SD. (C) Distribution of hearing thresholds. For each ear, the average hearing threshold was calculated for the frequency range of 0.5–6 kHz. (D) Distribution of LDLs. For each ear, the average LDL was calculated for the frequency range of 0.5–6 kHz.
Figure 2
Figure 2
Distribution of LDLs for individual frequencies. LDL distributions are depicted by gray bars, results where the LDL could not be reached until the intensity limit of the audiometer are separated by dashed black lines. The solid black line denotes the mean LDL.
Figure 3
Figure 3
Comparison of patient LDLs to a normal-hearing reference group (12). Top panels: Cumulative LDL distributions. Black solid lines – all patients; gray solid lines – patients with normal hearing thresholds; black dashed lines – reference group. Dotted lines indicate 10 and 90% level. Bottom panels: Receiver operating characteristic curves (see Materials and Methods). Black solid lines – all patients compared to reference group; gray solid lines – patients with normal hearing thresholds compared to reference group. Dotted lines indicate 90% true positives and 10% false positives. Panels (AD) show the data for 500, 1000, 2000, and 4000 Hz, respectively.
Figure 4
Figure 4
Relation between LDLs and hearing thresholds. (A) Average LDLs (0.5–6 kHz) vs. average hearing thresholds (0.5–6 kHz) for all participants. There was a significant positive correlation between average hearing thresholds and average LDL (r = 0.36, p < 0.001). (B) Average LDLs for different hearing threshold categories. Hearing thresholds (all patients and all frequencies) were binned using 20 dB bins starting at −10 dB HL, and the average LDL computed for each bin. The dashed line denotes identity. Error bars are ±1 SD. The same relation between hearing thresholds and LDLs was observed in this analysis. Error bars denote ±1 SD. (C) Average hearing thresholds (dashed lines) and LDLs (solid lines) of patient groups selected for having different degrees of high-frequency hearing loss (see text). The three hearing loss groups had almost identical LDLs in the hearing loss region, which were slightly elevated compared to the group without hearing loss. Error bars denote ± SEM.

References

    1. Vernon JA. Pathophysiology of tinnitus: a special case – hyperacusis and a proposed treatment. Am J Otol (1987) 8:201–2. - PubMed
    1. Baguley D, Andersson G. Hyperacusis: Mechanisms, Diagnosis, and Therapies. San Diego, CA: Plural Pub; (2007).
    1. Jastreboff PJ, Hazell JWP. Tinnitus Retraining Therapy: Implementing the Neurophysiological Model. Cambridge: Cambridge University Press; (2004).
    1. Anari M, Axelsson A, Eliasson A, Magnusson L. Hypersensitivity to sound – questionnaire data, audiometry and classification. Scand Audiol (1999) 28:219–30.10.1080/010503999424653 - DOI - PubMed
    1. Sammeth C, Preves D, Brandy W. Hyperacusis: case studies and evaluation of electronic loudness suppression devices as a treatment approach. Scand Audiol (2000) 29(1):28–36.10.1080/010503900424570 - DOI - PubMed

LinkOut - more resources