. 2015 Jun 1;10(6):e0128218.
doi: 10.1371/journal.pone.0128218. eCollection 2015.

Additive regulation of adiponectin expression by the mediterranean diet olive oil components oleic Acid and hydroxytyrosol in human adipocytes

Affiliations

Additive regulation of adiponectin expression by the mediterranean diet olive oil components oleic Acid and hydroxytyrosol in human adipocytes

Egeria Scoditti et al. PLoS One. .

Abstract

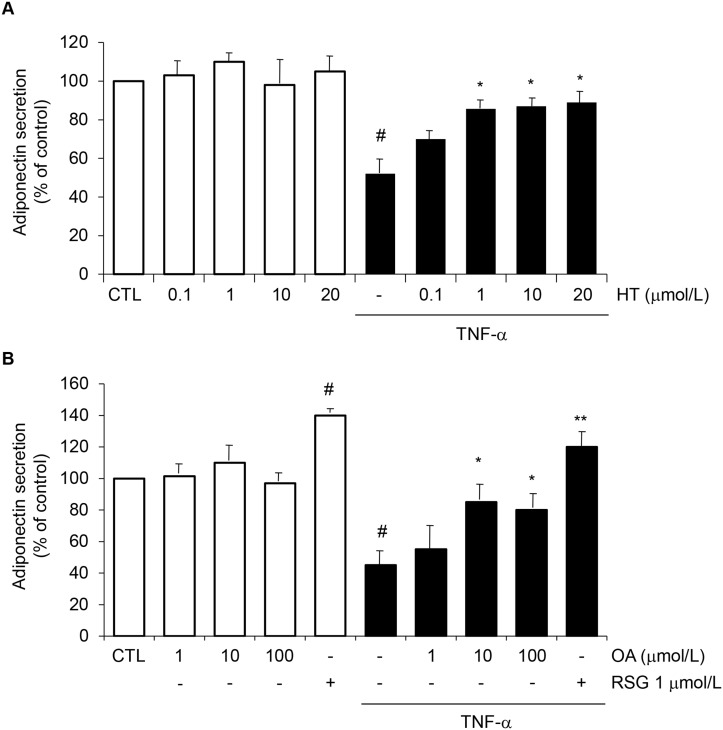
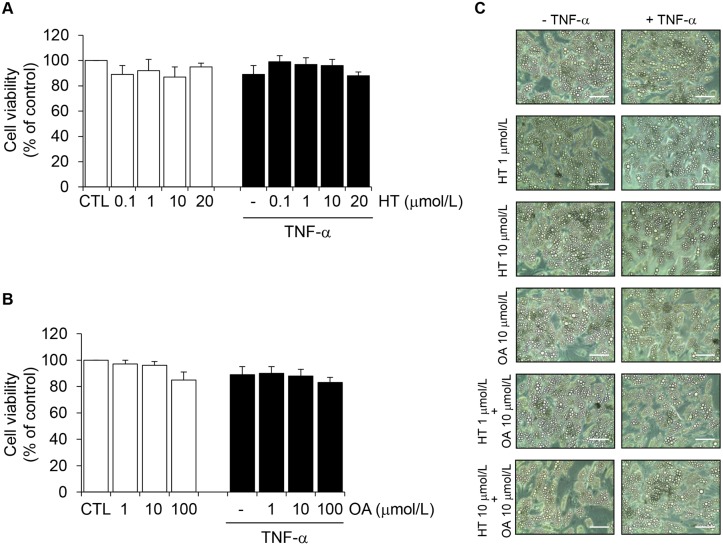
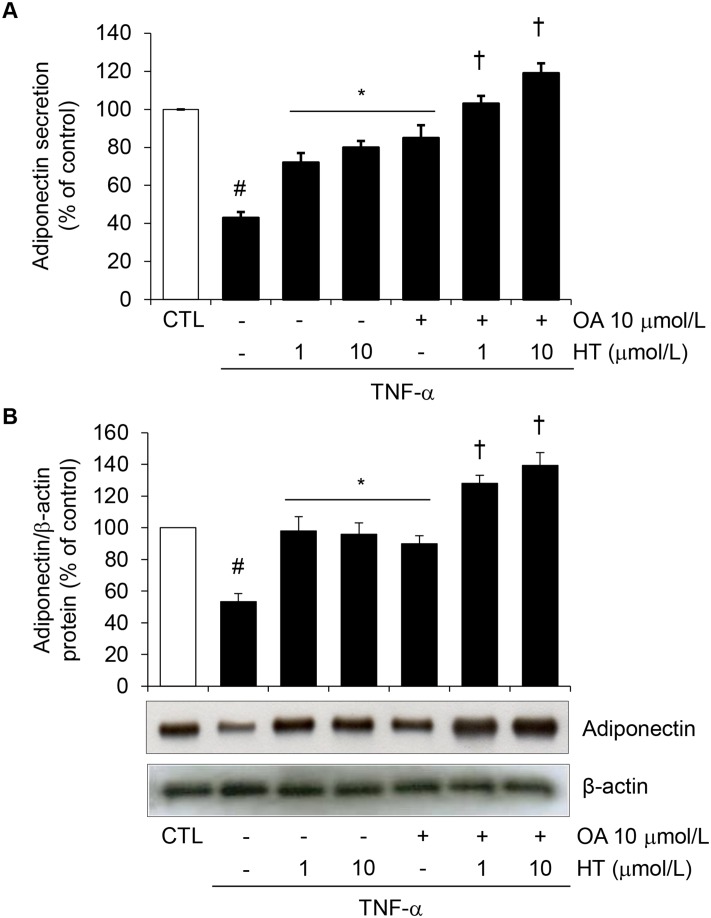
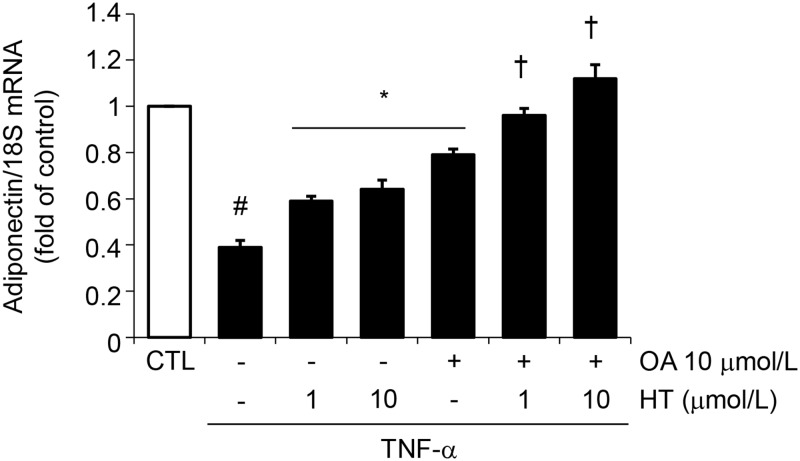
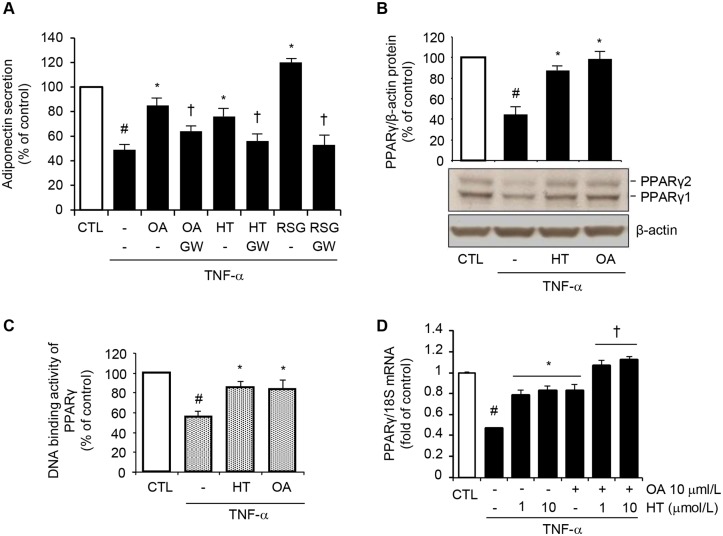
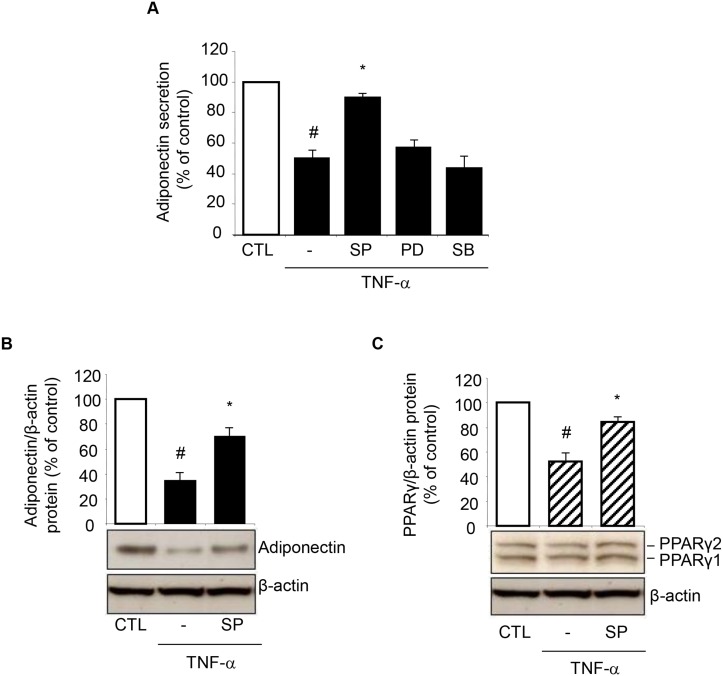
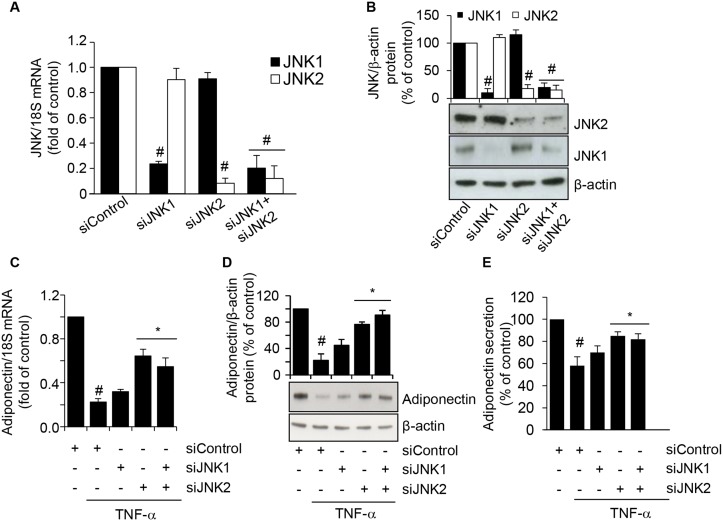
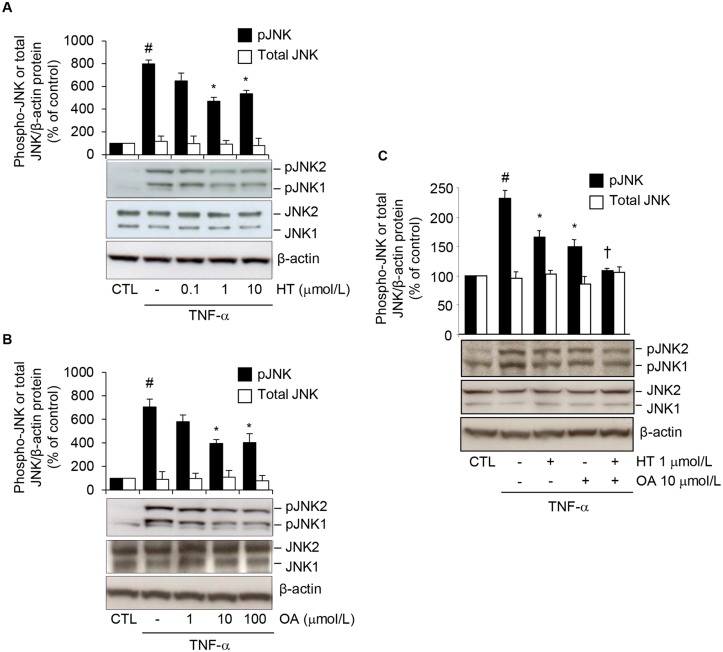
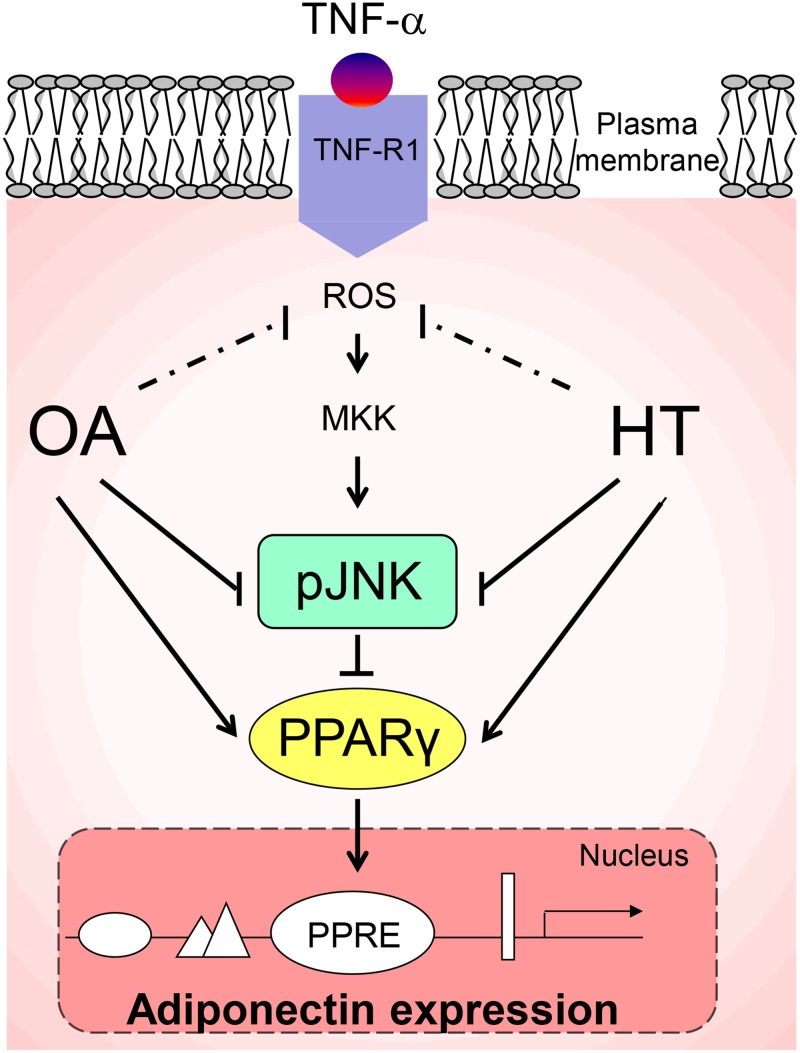
Adiponectin, an adipocyte-derived insulin-sensitizing and anti-inflammatory hormone, is suppressed in obesity through mechanisms involving chronic inflammation and oxidative stress. Olive oil consumption is associated with beneficial cardiometabolic actions, with possible contributions from the antioxidant phenol hydroxytyrosol (HT) and the monounsaturated fatty acid oleic acid (OA, 18:1n-9 cis), both possessing anti-inflammatory and vasculo-protective properties. We determined the effects of HT and OA, alone and in combination, on adiponectin expression in human and murine adipocytes under pro-inflammatory conditions induced by the cytokine tumor necrosis factor(TNF)-α. We used human Simpson-Golabi-Behmel syndrome (SGBS) adipocytes and murine 3T3-L1 adipocytes as cell model systems, and pretreated them with 1-100 μmol/L OA, 0.1-20 μmol/L HT or OA plus HT combination before stimulation with 10 ng/mL TNF-α. OA or HT significantly (P<0.05) prevented TNF-α-induced suppression of total adiponectin secretion (by 42% compared with TNF-α alone) as well as mRNA levels (by 30% compared with TNF-α alone). HT and OA also prevented-by 35%-TNF-α-induced downregulation of peroxisome proliferator-activated receptor PPARγ. Co-treatment with HT and OA restored adiponectin and PPARγ expression in an additive manner compared with single treatments. Exploring the activation of JNK, which is crucial for both adiponectin and PPARγ suppression by TNF-α, we found that HT and OA additively attenuated TNF-α-stimulated JNK phosphorylation (up to 55% inhibition). In conclusion, the virgin olive oil components OA and HT, at nutritionally relevant concentrations, have additive effects in preventing adiponectin downregulation in inflamed adipocytes through an attenuation of JNK-mediated PPARγ suppression.


Conflict of interest statement

Competing Interests: The authors declare that no competing interests exist.

Figures

Fig 1
Fig 1. Attenuation by HT and OA of TNF-α-induced inhibition of adiponectin protein release in human adipocytes.
Human SGBS adipocytes were pretreated with HT (1 h) (A), OA (48 h) or RSG (24 h) (B) at the concentrations indicated and then either treated with 10 ng/mL TNF-α (black-filled bars), or left untreated (open white bars), for 24 h. Adiponectin levels in the culture medium were determined by ELISA, and expressed as percent of unstimulated control (CTL). Bars represent means ± SD (n = 3). #p<0.05 versus CTL. *p<0.05 versus TNF-α. **p<0.01 versus TNF-α.
Fig 2
Fig 2. The effect of HT and OA treatment on cell viability.
SGBS adipocytes were treated with HT (1 h) (A) or OA (48 h) (B) at the concentrations indicated, and then either treated with 10 ng/mL TNF-α (black-filled bars), or left untreated (open white bars), for 24 h. Cell viability was assessed by the MTT assay, and expressed as percent of unstimulated control (CTL). Data are means ± SD (n = 3). In (C), phase-contrast images of adipocytes treated with HT, OA or HT + OA in the absence or presence of TNF-α are presented. Scale bar = 50 μm.
Fig 3
Fig 3. Effect of combined treatment with HT and OA on TNF-α-induced inhibition of adiponectin protein release and expression.
SGBS cells were pretreated with either HT, OA or cotreated with HT + OA before 10 ng/mL TNF-α stimulation for 24 h. (A) Adiponectin in the culture medium was determined by ELISA, and expressed as percent of unstimulated control (CTL). (B) Adiponectin intracellular protein levels were determined by Western analysis using antibodies against adiponectin. Western analysis under reducing and denaturing condition here reveals the 30 kDa adiponectin monomer. Adiponectin expression was normalized to β-actin, and expressed as percent of unstimulated control (CTL). Data are means ± SD (n = 3). #p<0.05 versus CTL. *p<0.05 versus TNF-α alone. †p<0.05 versus each compound + TNF-α.
Fig 4
Fig 4. Effect of combined treatment with HT and OA on TNF-α-induced inhibition of adiponectin mRNA expression.
SGBS cells were pretreated with either HT, OA or cotreated with HT + OA before 10 ng/mL TNF-α stimulation for 24 h. Adiponectin mRNA levels were determined by qPCR and normalized to 18S RNA. Data are expressed as fold induction over unstimulated control (CTL). Data are means ± SD (n = 3). #p<0.05 versus CTL. *p<0.05 versus TNF-α alone. †p<0.05 versus each compound + TNF-α.
Fig 5
Fig 5. Attenuation by HT and OA of TNF-α-induced inhibition of PPARγ expression and activity.
(A) SGBS cells were treated with 1 μmol/L HT, 10 μmol/L OA, or 1 μmol/L RSG in the absence or presence of the PPARγ antagonist GW9662 at 10 μmol/L (GW), and then stimulated with 10 ng/mL TNF-α for 24 h. Adiponectin levels in the culture medium were determined by ELISA, and expressed as percent of unstimulated control (CTL). Data are means ± SD (n = 3). #p<0.05 versus CTL. *p<0.05 versus TNF-α alone. †p<0.05 versus the compound-treated group without GW9662. (B) and (C) SGBS cells were treated with 1 μmol/L HT or 10 μmol/L OA before 10 ng/mL TNF-α stimulation for 24 h. (B) Whole-cell lysates were assayed by Western blotting using antibodies against PPARγ1, PPARγ2, and against β-actin, this last used as a loading control. Total PPARγ1 and PPARγ2 band intensities were normalized to β-actin, and are expressed as percent of unstimulated control (CTL). (C) Nuclear proteins were analyzed for PPARγ DNA-binding activity by ELISA as described in Methods. Data are expressed as percent of unstimulated control (CTL). (D) SGBS cells were treated with 1–10 μmol/L HT, or 10 μmol/L OA, or co-treated with OA + HT before 10 ng/mL TNF-α stimulation for 24 h. PPARγ mRNA levels were determined by qPCR and normalized to 18S RNA. Data are expressed as fold induction over unstimulated control (CTL). Bars represent means ± SD (n = 3). #p<0.05 versus CTL. *p<0.05 versus TNF-α. †p<0.05 versus each compound + TNF-α.
Fig 6
Fig 6. Involvement of JNK activation in TNF-α-induced PPARγ and adiponectin inhibition.
SGBS cells were pretreated for 1 h with 10 μmol/L of the JNK inhibitor SP600125 (SP), the ERK1/2 inhibitor PD98059 (PD), or the p38 inhibitor SB203580 (SB), and then stimulated with 10 ng/mL TNF-α for 24 h. Culture media were analyzed for adiponectin by ELISA (A), and whole-cell lysates were assayed by Western blotting using antibodies against adiponectin (B) or PPARγ (C). Adiponectin and PPARγ expression were normalized to β-actin, and expressed as percent of unstimulated control (CTL). Bars represent means ± SD (n = 3). #p<0.05 versus CTL. *p<0.05 versus TNF-α.
Fig 7
Fig 7. Attenuation of TNF-α-induced adiponectin downregulation by siRNA-mediated depletion of JNK.
SGBS cells were treated with scrambled negative control siRNA (siControl), JNK1 siRNA (siJNK1), JNK2 siRNA (siJNK2), or JNK1 plus JNK2 siRNA, for 72 h. The mRNA expression levels of JNK1 and JNK2 were measured by qPCR, normalized to 18S RNA, and expressed as fold induction over scrambled negative control siRNA (A). JNK1 and JNK2 intracellular protein levels were assayed by Western blotting, normalized to β-actin, and expressed as percent of scrambled negative control siRNA (B). Bars represent means ± SD. #p<0.05 versus siControl. After 72 h of transfection, cells were stimulated with 10 ng/mL TNF-α for further 24 h. Adiponectin mRNA were determined by qPCR (C), while adiponectin intracellular and secreted protein levels were determined by Western analysis (D) and ELISA (E), respectively. Bars represent means ± SD. #p<0.05 versus siControl without TNF-α. *p<0.05 versus siControl with TNF-α.
Fig 8
Fig 8. Attenuation by HT and OA of TNF-α-induced JNK phosphorylation.
SGBS cells were treated with increasing concentrations of HT (A) or OA (B), or with 1 μmol/L HT, 10 μmol/L OA or co-treated with OA + HT (C) before 10 ng/mL TNF-α for 20 min. Whole-cell lysates were assayed by Western blotting using antibodies against phosphorylated (p) JNK1/2, total JNK or β-actin, as a loading control. Band intensities for phosphorylated and total JNK were normalized to β-actin, and are expressed as percent of unstimulated control (CTL). Bars represent means ± SD. #p<0.05 versus CTL. *p<0.05 versus TNF-α. †p<0.05 versus each compound + TNF-α.
Fig 9
Fig 9. A working model for the HT and OA-mediated increase of adiponectin expression in TNF-α-stimulated adipocytes.
Pre-treatment with HT and OA before TNF-α stimulation prevents JNK activation and restores PPARγ expression and activity and, as a consequence, adiponectin levels. A coherent interpretation of the findings is as follows: upon binding to the cognate receptor, TNF-α induces reactive oxygen species (ROS) production and triggers an inflammatory signaling cascade involving, among others, the activation of JNK, which mediates the degradation of PPARγ (a transcription factor implicated in adiponectin gene expression through a PPAR-responsive element (PPRE) in its promoter). As a result, adiponectin expression is downregulated. Arrow indicates stimulation. Line indicates inhibition. MKK: MAP kinase kinase; pJNK: phosphorylated JNK.

References

    1. Madonna R, De Caterina R. Cellular and molecular mechanisms of vascular injury in diabetes—part II: cellular mechanisms and therapeutic targets. Vascul Pharmacol. 2011;54: 75–79. 10.1016/j.vph.2011.03.007 - DOI - PubMed
    1. Capurso C, Capurso A. From excess adiposity to insulin resistance: the role of free fatty acids. Vascul Pharmacol. 2012;57: 91–97. 10.1016/j.vph.2012.05.003 - DOI - PubMed
    1. Kawano J, Arora R. The role of adiponectin in obesity, diabetes, and cardiovascular disease. J Cardiometab Syndr. 2009;4: 44–49. 10.1111/j.1559-4572.2008.00030.x - DOI - PubMed
    1. Lopez-Jaramillo P, Gomez-Arbelaez D, Lopez-Lopez J, Lopez-Lopez C, Martinez-Ortega J, Gomez-Rodriguez A, et al. The role of leptin/adiponectin ratio in metabolic syndrome and diabetes. Horm Mol Biol Clin Investig. 2014;18: 37–45. 10.1515/hmbci-2013-0053 - DOI - PubMed
    1. Estruch R, Ros E, Salas-Salvado J, Covas MI, Corella D, Aros F, et al. Primary prevention of cardiovascular disease with a Mediterranean diet. N Engl J Med. 2013;368: 1279–1290. 10.1056/NEJMoa1200303 - DOI - PubMed

Publication types

MeSH terms