. 2015 Sep 1;192(5):605-17.
doi: 10.1164/rccm.201412-2141OC.

Combinatorial Immunoprofiling in Latent Tuberculosis Infection. Toward Better Risk Stratification

Affiliations

Combinatorial Immunoprofiling in Latent Tuberculosis Infection. Toward Better Risk Stratification

Patricio Escalante et al. Am J Respir Crit Care Med. .

Abstract

Rationale: Most immunocompetent patients diagnosed with latent tuberculosis infection (LTBI) will not progress to tuberculosis (TB) reactivation. However, current diagnostic tools cannot reliably distinguish nonprogressing from progressing patients a priori, and thus LTBI therapy must be prescribed with suboptimal patient specificity. We hypothesized that LTBI diagnostics could be improved by generating immunomarker profiles capable of categorizing distinct patient subsets by a combinatorial immunoassay approach.

Objectives: A combinatorial immunoassay analysis was applied to identify potential immunomarker combinations that distinguish among unexposed subjects, untreated patients with LTBI, and treated patients with LTBI and to differentiate risk of reactivation.

Methods: IFN-γ release assay (IGRA) was combined with a flow cytometric assay that detects induction of CD25(+)CD134(+) coexpression on TB antigen-stimulated T cells from peripheral blood. The combinatorial immunoassay analysis was based on receiver operating characteristic curves, technical cut-offs, 95% bivariate normal density ellipse prediction, and statistical analysis. Risk of reactivation was estimated with a prediction formula.

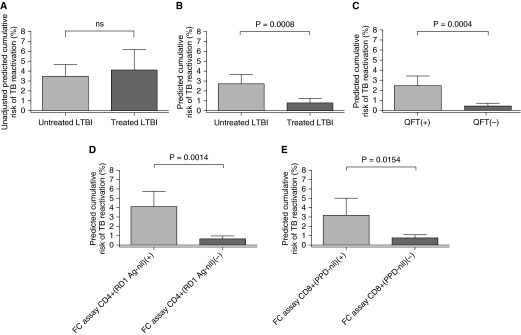
Measurements and main results: Sixty-five out of 150 subjects were included. The combinatorial immunoassay approach identified at least four different T-cell subsets. The representation of these immune phenotypes was more heterogeneous in untreated patients with LTBI than in treated patients with LTBI or unexposed groups. Patients with IGRA(+) CD4(+)CD25(+)CD134(+) T-cell phenotypes had the highest estimated reactivation risk (4.11 ± 2.11%).

Conclusions: These findings suggest that immune phenotypes defined by combinatorial assays may potentially have a role in identifying those at risk of developing TB; this potential role is supported by risk of reactivation modeling. Prospective studies will be needed to test this novel approach.

Keywords: biomarker; flow cytometry; immunoassay; latent tuberculosis infection; tuberculosis.


Figures

Figure 1.
Figure 1.
Flow cytometric gating strategy for detection of percentage of activated T cells (CD3+CD4+ and CD3+CD8+) coexpressing CD25+CD134+ markers in a suspected latent tuberculosis infection (LTBI) case [prior TST(+)/IGRA(+) results]. (A) Viable lymphocyte gate using side and forward scatter. (B) Gate on CD3+/CD4+. (C) Percentage of CD3+CD4+/CD25+CD134+ coexpression (right upper quadrant box) after 48 hours of incubation with an unstimulated sample, purified protein derivative (PPD), and an ESAT-6/CFP-10 peptide mixture antigen (region of difference 1 [RD1] antigen). (D) Gate on CD3+/CD8+. (E) Percentage of CD3+CD8+/CD25+CD134+ coexpression with an unstimulated sample, PPD, and RD1 antigen. Percentages (boxes) indicate the calculated distribution of CD25+CD134+ among CD3+CD4+ T cells after the subtraction of background (negative control). Ag = antigen; FCS-A = forward scatter; IGRA = interferon-γ release assay; SSC-A = side scatter; TST = tuberculin skin test. This case example was not included in the study owing to unclear history of completion of LTBI therapy. Study-generated QuantiFERON TB Gold In-Tube was 7.52 IU/ml. Additional case examples are available in Figures E1 and E2 in the online supplement.
Figure 2.
Figure 2.
Receiver operating characteristic curves and diagnostic performance of study assays in unexposed subjects and untreated patients with latent tuberculosis infection. (A) QuantiFERON TB Gold In-Tube (i.e., region of difference 1 [RD1] peptides). (B) Flow cytometry (FC) assay detection of percentage of CD25+CD134+ coexpression in RD1 antigen–stimulated CD3+CD4+ T cells. (C) FC assay detection of the percentage of CD25+CD134+ coexpression in purified protein derivative (PPD)-stimulated CD3+CD4+ T cells. (D) FC assay detection of percentage of CD25+CD134+ coexpression in RD1 antigen–stimulated CD3+CD8+ T cells. (E) FC assay detection of percentage of CD25+CD134+ coexpression in PPD-stimulated CD3+CD8+ T cells. (F) Diagnostic performance parameters of each test associated with the receiver operating characteristic analysis. Ag = antigen; AUC = area under the curve (i.e., diagnostic accuracy); nil = negative control.
Figure 3.
Figure 3.
Testing results in unexposed subjects, untreated patients with latent tuberculosis infection (LTBI), and treated patients with LTBI. (A) QuantiFERON TB Gold In-Tube results (i.e., region of difference [RD] peptides). (B) Flow cytometric detection of percentage of CD25+CD134+ coexpression in RD1 antigen–stimulated CD3+CD4+ T cells. (C) Flow cytometric detection of percentage of CD25+CD134+ coexpression in purified protein derivative (PPD)-stimulated CD3+CD4+ T cells. (D) Flow cytometric detection of percentage of CD25+CD134+ coexpression in Candida antigen–stimulated CD3+CD4+ T cells. (E) Flow cytometric detection of the percentage of CD25+CD134+ coexpression in RD1 antigen–stimulated CD3+CD8+ T cells. (F) Flow cytometric detection of the percentage of CD25+CD134+ coexpression in PPD-stimulated CD3+CD8+ T cells. (G) Flow cytometric detection of percentage of CD25+CD134+ coexpression in Candida antigen–stimulated CD3+CD8+ T cells. P value estimation by Dunn’s multiple comparison test. *P < 0.05, **P < 0.01, ***P < 0.001, and ****P < 0.0001. ns = not significant (P >  0.05). Boxed values indicate median and interquartile range, and whiskers indicate minimum and maximum values. Ag = antigen; IU = international units; nil = negative control; RD1 = region of difference 1.
Figure 4.
Figure 4.
Flow cytometry (FC) test measurements and combination of immunodiagnostic tests distinguish between unexposed subjects, untreated patients with latent tuberculosis infection (LTBI), and treated patients with LTBI. (A) Bivariate normal density ellipse with 95% coverage for QuantiFERON TB Gold In-Tube (QFT)(+) results (red color) and QFT(−) results (blue color) and correspondent FC test results: percentage of CD25+CD134+ of CD3+CD4+ T cells (region of difference 1 [RD1] peptide antigen [Ag] − negative control [nil]) versus percentage of CD25+CD134+ of CD3+CD8+ T cells (purified protein derivative [PPD] − nil) by study groups. The cut-offs for the FC tests were those associated with the highest specificity to separate treated from untreated LTBI cases (dashed lines, optimized FC test cut-offs). (B) Pie charts represent the number of subjects with positive or negative immunodiagnostic test results (using the optimized FC test cut-offs) by study groups. FC assay CD4+ (RD1 Ag − nil) = FC assay for the percentage of CD25+CD134+ of CD3+CD4+ T cells (RD1 Ag − nil); FC assay CD8+ (PPD − nil) = FC assay for the percentage of CD25+CD134+ of CD3+CD8+ T cells (PPD − nil).
Figure 5.
Figure 5.
Adjusted prediction formula differentiates cumulative risk of tuberculosis (TB) reactivation in untreated versus treated patients with latent tuberculosis infection (LTBI) and for each individual immunodiagnostic test result. (A) Unadjusted cumulative risk for TB reactivation for untreated versus treated patients with LTBI. ns = not significant (P > 0.05). (B) Adjusted cumulative risk for TB reactivation for untreated versus treated patients with LTBI. (C) Adjusted cumulative risk of TB reactivation for QuantiFERON TB Gold In-Tube (QFT). (D) Adjusted cumulative risk of TB reactivation for flow cytometry (FC) assay CD4+ (region of difference 1 [RD1] peptide antigen [Ag] − negative control [nil]) results (using the optimized FC test cut-offs that differentiate untreated from treated subjects with LTBI). (E) Adjusted cumulative patients’ risk for TB reactivation for FC assay CD8+ (purified protein derivative [PPD] − nil) results (using the optimized FC test cut-offs). P value estimation by Student's t test. Bar indicates mean value; error bar indicates 95% confidence interval. FC assay CD4+ (RD1 Ag − nil) = FC assay for the percentage CD25+CD134+ of CD3+CD4+ T cells (RD1 Ag − nil); FC assay CD8+ (PPD − nil) = FC assay for the percentage CD25+CD134+ of CD3+CD8+ T cells (PPD − nil).
Figure 6.
Figure 6.
Adjusted prediction formula differentiates cumulative risk of tuberculosis (TB) reactivation in combination subsets of QuantiFERON TB Gold In-Tube (QFT) and flow cytometry (FC) immune-reactive profiles. (A) Cumulative patients’ risk for TB reactivation for combinations of QFT and FC assay CD4+ (region of difference 1 [RD1] peptide antigen [Ag] − negative control [nil]) results (using the optimized FC test cut-offs that differentiate untreated from treated subjects with latent tuberculosis infection). (B) Cumulative patients’ risk for TB reactivation for combinations of QFT and FC assay CD8+ (purified protein derivative [PPD] − nil) results (using the optimized FC test cut-offs). P value estimation by Tukey’s multiple comparisons test. *P < 0.05, **P < 0.01, ***P < 0.001, and ****P < 0.0001. ns = not significant (P > 0.05). Bar indicates mean value; error bar indicates 95% confidence interval. FC assay CD4+ (RD1 Ag − nil) = FC assay for the percentage of CD25+CD134+ of CD3+CD4+ T cells (RD1 Ag − nil); FC assay CD8+ (PPD − nil) = FC assay for the percentage of CD25+CD134+ of CD3+CD8+ T cells (PPD − nil).

Comment in

References

    1. Comstock GW, Baum C, Snider DE., Jr Isoniazid prophylaxis among Alaskan Eskimos: a final report of the bethel isoniazid studies. Am Rev Respir Dis. 1979;119:827–830. - PubMed
    1. Canetti G. Dynamic aspects of the pathology and bacteriology of tuberculous lesions. Am Rev Tuberc. 1956;74:13–21; discussion, 22–27. - PubMed
    1. Esmail H, Barry CE, III, Young DB, Wilkinson RJ. The ongoing challenge of latent tuberculosis. Philos Trans R Soc Lond B Biol Sci. 2014;369:20130437. - PMC - PubMed
    1. Lin PL, Flynn JL. Understanding latent tuberculosis: a moving target. J Immunol. 2010;185:15–22. - PMC - PubMed
    1. Mack U, Migliori GB, Sester M, Rieder HL, Ehlers S, Goletti D, Bossink A, Magdorf K, Hölscher C, Kampmann B, et al. C. Lange; TBNET. LTBI: latent tuberculosis infection or lasting immune responses to M. tuberculosis? A TBNET consensus statement. Eur Respir J. 2009;33:956–973. - PubMed

Publication types

MeSH terms