. 2015 Jun 1;10(6):e0126466.
doi: 10.1371/journal.pone.0126466. eCollection 2015.

Cancer Cells Hijack PRC2 to Modify Multiple Cytokine Pathways

Affiliations

Cancer Cells Hijack PRC2 to Modify Multiple Cytokine Pathways

Mohamed Abou El Hassan et al. PLoS One. .

Abstract

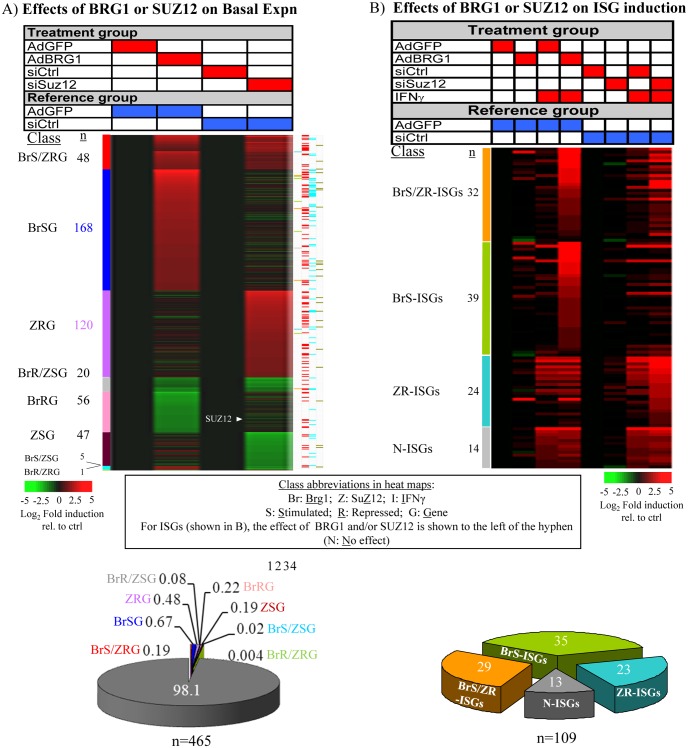
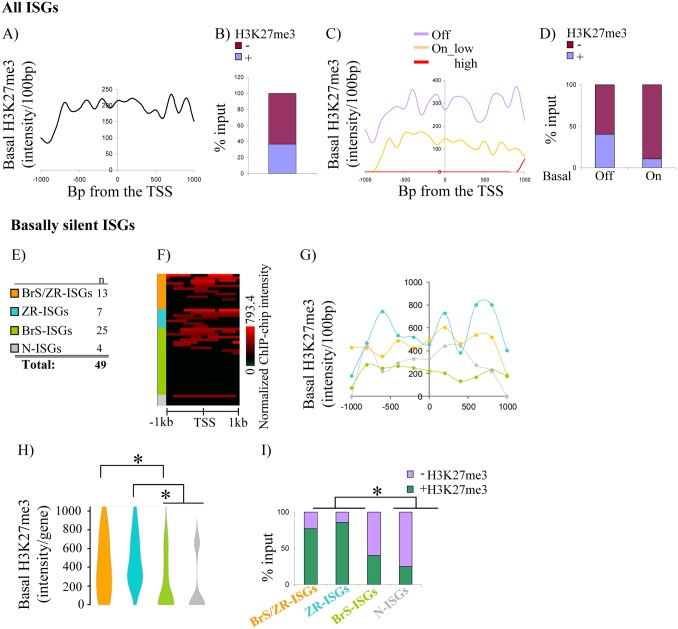
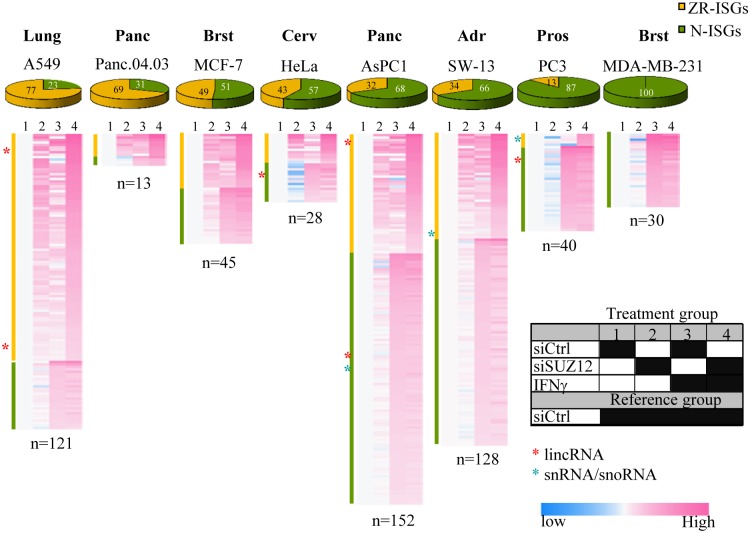
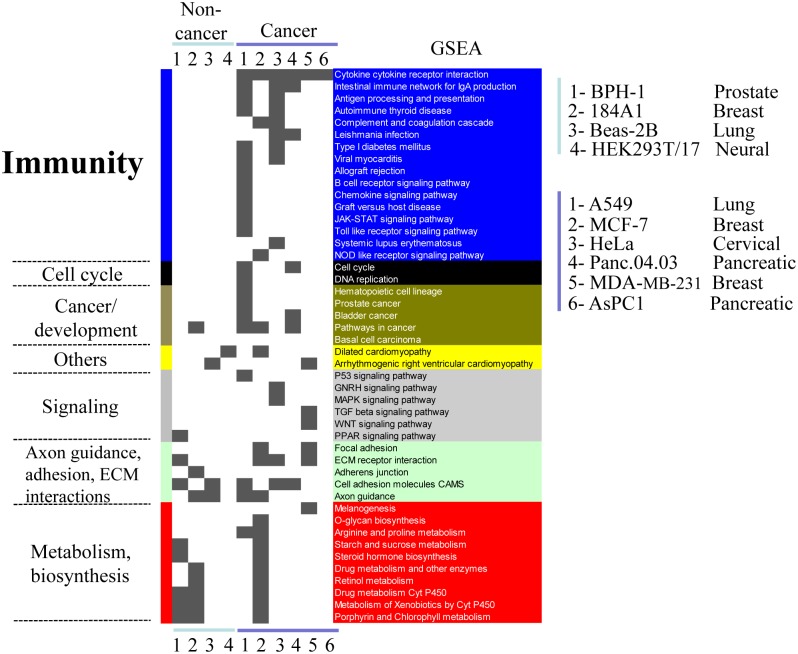
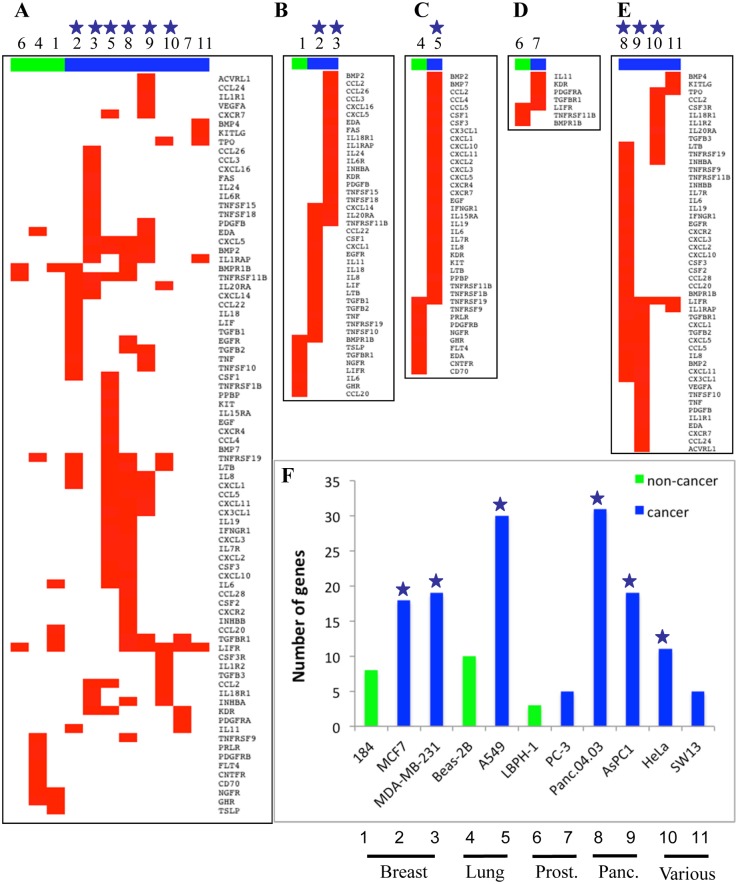
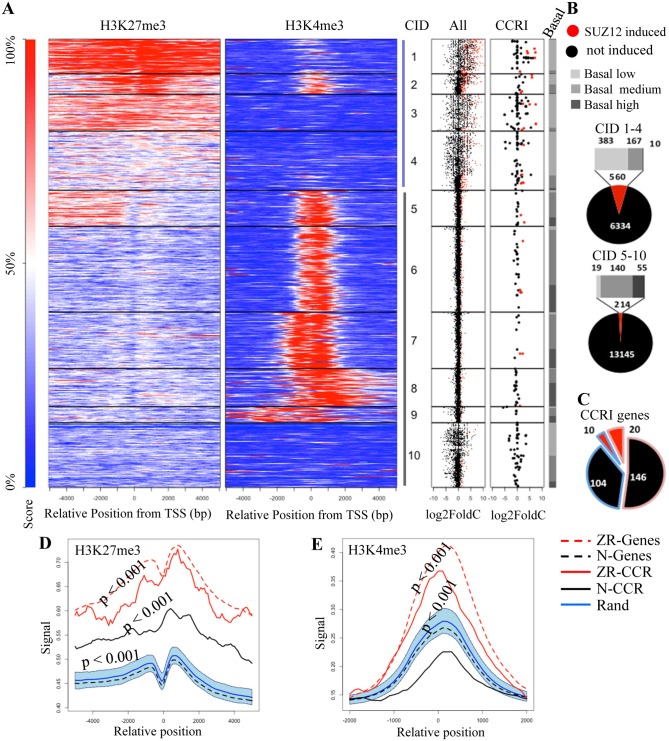
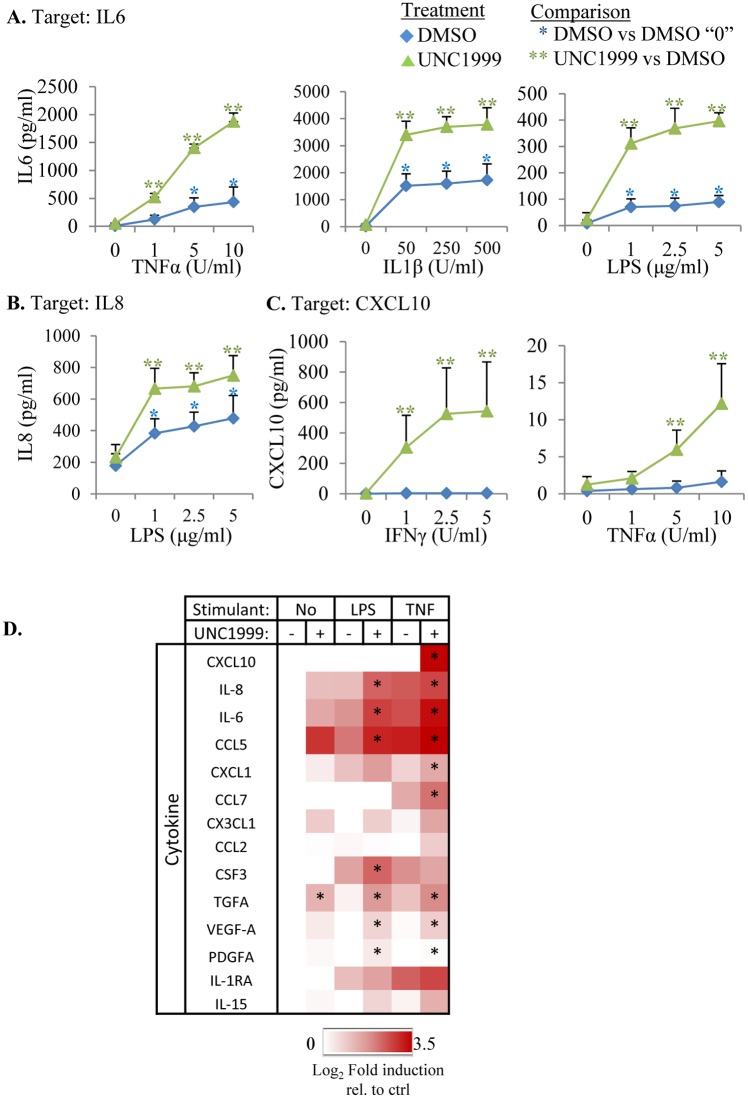
Polycomb Repressive Complex 2 (PRC2) is an epigenetic regulator induced in many cancers. It is thought to drive tumorigenesis by repressing division, stemness, and/or developmental regulators. Cancers evade immune detection, and diverse immune regulators are perturbed in different tumors. It is unclear how such cell-specific effects are coordinated. Here, we show a profound and cancer-selective role for PRC2 in repressing multiple cytokine pathways. We find that PRC2 represses hundreds of IFNγ stimulated genes (ISGs), cytokines and cytokine receptors. This target repertoire is significantly broadened in cancer vs non-cancer cells, and is distinct in different cancer types. PRC2 is therefore a higher order regulator of the immune program in cancer cells. Inhibiting PRC2 with either RNAi or EZH2 inhibitors activates cytokine/cytokine receptor promoters marked with bivalent H3K27me3/H3K4me3 chromatin, and augments responsiveness to diverse immune signals. PRC2 inhibition rescues immune gene induction even in the absence of SWI/SNF, a tumor suppressor defective in ~20% of human cancers. This novel PRC2 function in tumor cells could profoundly impact the mechanism of action and efficacy of EZH2 inhibitors in cancer treatment.


Conflict of interest statement

Competing Interests: The authors have declared that no competing interests exist.

Figures

Fig 1
Fig 1. BRG1 and PRC2 regulate most ISGs.
Microarrays were performed with RNA from SW-13 cells to assess the effect of BRG1-reconstitution or SUZ12 knockdown on basal expression of all genes (A, 465 affected genes) or IFNγ responsiveness (B, 109 ISGs). Treatments are indicated in red and blue above each heatmap, gene classes are indicated by colored bars to the left of each heatmap, and the pie graphs summarize the % of genes in each class (In (A) grey = unaffected genes). An additional chart to the right of the heatmap in (A) classifies genes based on: 1. IFNγ responsiveness (ISGs = 12), or GO terms: 2. Development (n = 118); 3. Cell signalling (n = 64); 4. Cell migration (n = 24). Gene Class Abbreviations: Expn: Expression; Br: Brg1, Z: Suz12; S: Stimulated; R: Repressed; I: Interferon-γ; G: Gene.
Fig 2
Fig 2. PRC2 epigenetic signature is common at ISG promoters.
Genome-wide ChIP-chip data was used to assess H3K27me3 levels at ISG promoters. (A) ChIP-chip signal intensity per 100 bp bins within +/-5 kb of the TSS of all 109 ISGs defined in Fig 1B. (B) Percentage of H3K27me3 positive and negative ISG promoters. (C) ChIP-chip signal intensity as in (A) but grouped according to ISG basal expression. (D) Histogram of the percentage of H3K27me3 positive and negative ISGs in relation to their basal gene expression. (E) Color code of basally silent ISGs analyzed in (F)-(H). (F) Heatmap shows basal H3K27me3 ChIP-chip signal within +/-1 kb of the TSS of the indicated basally silent ISG classes. (G) ChIP-chip signal intensity per 100 bp bins within +/- 1kb of the TSS of basally silent ISGs. (H) Violin plot shows the level of the average ChIP-chip signal. Asterisks indicate significant difference (P < 0.05, Mann Whitney test) between the indicated groups. (I) Histogram shows the percentage of H3K27me3 positive promoters in each indicated ISG class. *: significantly higher % of H3K27me3 positive ISGs between the indicated groups (P < 0.05, Fisher exact test). Gene Class Abbreviations: Br: Brg1, Z: Suz12; S: Stimulated; R: Repressed; I: Interferon-γ; G: Gene.
Fig 3
Fig 3. PRC2 represses ISGs in different types of cancers.
Heatmaps show the effect of the four treatments (columns 1–4, key in table to right) on ISG expression in a panel of lung, pancreas, breast, cervical, adrenocortical and prostate cancer cell lines. Cells were transfected with siCtrl or siSUZ12 and left untreated or stimulated with IFNγ for 6 hours. ISGs are sorted into SUZ12-repressed ISGs (Zr-ISGs, yellow) and ISGs which are not regulated by PRC2 (N-ISGs, green). The percentage of Zr-ISGs and N-ISGs are shown in pie diagrams above each heatmap, and the total number of ISGs per line is indicated below each heatmap.
Fig 4
Fig 4. Cancer cells hijack PRC2 to regulated immune pathways.
Summary of GSEA analysis of genes differentially induced by siSUZ12 relative to siCtrl in 6 cancer and 4 non-cancer derived cell lines. Cell lines included in the heatmap are indicated to the right; a significant signal is indicated in grey. Similar biological pathways are grouped, and highlighted with a distinct color to the right, and their general class name is indicated to the left.
Fig 5
Fig 5. Distinct siSUZ12 induced CCRI pathway genes in cancer and non-cancer cell lines.
A. Heatmap of CCRI genes significantly induced by siSUZ12 (Differential Probability > 0.9) in 11 cell lines (non-cancer green, cancer blue). For cell line names corresponding to each number see (F). Blue stars in this and subsequent panels indicate cell lines in which the CCRI pathway was significantly enriched according to GSEA. B-E Heatmaps of subsets of the data in (A) separated by tissue type: B. Breast (184 non-cancer vs. MCF7 and MDA-MB-231 cancer), C. Lung (Beas-2B non-cancer vs. A549 cancer), D. Prostate (BPH-1 non-cancer vs. PC-3 cancer), and E. Another 4 cancer cell lines of pancreatic (Panc.04.03 and AsPC1), cervical (HeLa) and adrenocortical (SW-13) origin. F. Frequency of induced CCRI genes across all 271 CCRI genes in each cell line.
Fig 6
Fig 6. siSUZ12-induced genes are bivalent.
ChIP-seq data from A549 cells was used to assess chromatin marks at siSUZ12 induced genes. A. Unsupervised K-means clustering was performed on H3K27me3 and H3K4me3 signals, and plotted as heatmaps around the TSS (for more details see “ChIP-seq data analysis in S1 Text, Supplementary Methods). The 10 resulting clusters (Cluster ID (CID) 1–10) are depicted in order of average log2Fold change in gene expression after siSUZ12 treatment as shown in the dot plots to the right. On the dot plot, all genes (left) or CCRI genes (right) show log2Fold change for each gene; red dots indicate genes significantly induced by siSUZ12 (Differential probability > 0.9). Basal expression is shown to the far right (Light grey: low; grey: medium; dark grey: high). B. Shows gene clusters revealed in panel A. Proportion of all genes induced by siSUZ12 (red) in CIDs 1–4, or 5–10 (as shown in the dot plots in A). C. Proportion of CCRI pathway genes induced by siSUZ12 (red) in CIDs 1–4 (red outline) or 5–10 (blue outline). D. Average H3K27me3 ChIP signal around the TSS for the indicated groups of genes (Key to the right; ZR-Genes: all SUZ12 repressed genes; N-Genes: not affected by siSUZ12; ZR-CCRI: CCRI genes that are SUZ12-repressed; N-CCRI: CCRI genes not affected by SUZ12; Rand: 1000 random gene sets, n = median of the other four gene sets). E. Same as (D) except for H3K4me3 ChIP signals in CIDs 1–4 (i.e. those with high H3K27me3).
Fig 7
Fig 7. Pharmacological inhibition of PRC2 boosts multiple immune pathways.
A549 cells treated with UNC1999 (green) or DMSO (blue) were stimulated with the indicated concentrations of TNFα, IFNγ, IL1β or LPS for 24 h and ELISA was performed for secreted IL6 (A), IL8 (B) and CXCL10 (C). Asterisks indicate significant effects (P< 0.05; n = 3; ANOVA followed by Fisher test) according to the indicated comparisons. (D) A549 cells treated with vehicle (-) or UNC1999 (+) as indicated were exposed to No immune stimulus, 5μg/ml LPS, or 10U/ml TNFα for 24 h, and the concentration of secreted cytokines assessed using a Multiplexing Laser Bead assay. Heat map represents the log2 average fold induction from three biological replicates compared to vehicle with No immune stimulus. Asterisks indicate significant effects (P< 0.05; n = 3; ANOVA followed by Fisher test) between-/+ UNC1999 for each stimulus.

References

    1. Schreiber RD, Old LJ, Smyth MJ. Cancer immunoediting: integrating immunity’s roles in cancer suppression and promotion. Science. 2011;331: 1565–1570. 10.1126/science - DOI - PubMed
    1. Fridman WH, Pagès F, Sautès-Fridman C, Galon J. The immune contexture in human tumours: impact on clinical outcome. Nat Rev Cancer. 2012;12: 298–306. 10.1038/nrc3245 - DOI - PubMed
    1. Chow MT, Möller A, Smyth MJ. Inflammation and immune surveillance in cancer. Semin Cancer Biol. 2012;22: 23–32. 10.1016/j.semcancer.2011.12.004 - DOI - PubMed
    1. Pasini D, Bracken AP, Jensen MR, Denchi EL, Helin K. Suz12 is essential for mouse development and for EZH2 histone methyltransferase activity. Embo J. 2004;23: 4061–71. - PMC - PubMed
    1. Mills AA. Throwing the cancer switch: reciprocal roles of polycomb and trithorax proteins. Nat Rev Cancer. 2010;10: 669–682. 10.1038/nrc2931 - DOI - PMC - PubMed

Publication types

MeSH terms