. 2015 Jul;18(7):997-1007.
doi: 10.1038/nn.4037. Epub 2015 Jun 1.

Distinct circuit-dependent functions of presynaptic neurexin-3 at GABAergic and glutamatergic synapses

Affiliations

Distinct circuit-dependent functions of presynaptic neurexin-3 at GABAergic and glutamatergic synapses

Jason Aoto et al. Nat Neurosci. 2015 Jul.

Abstract

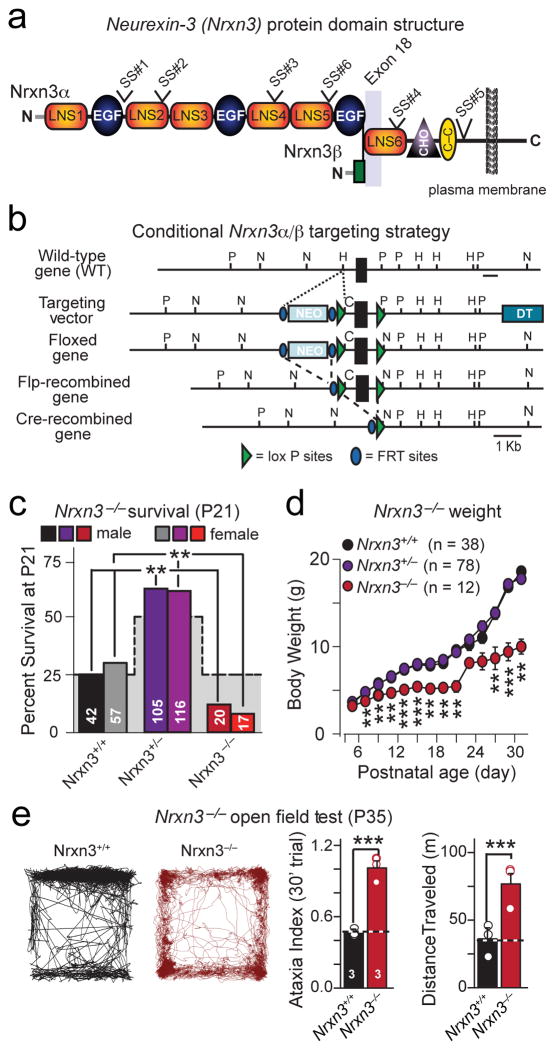
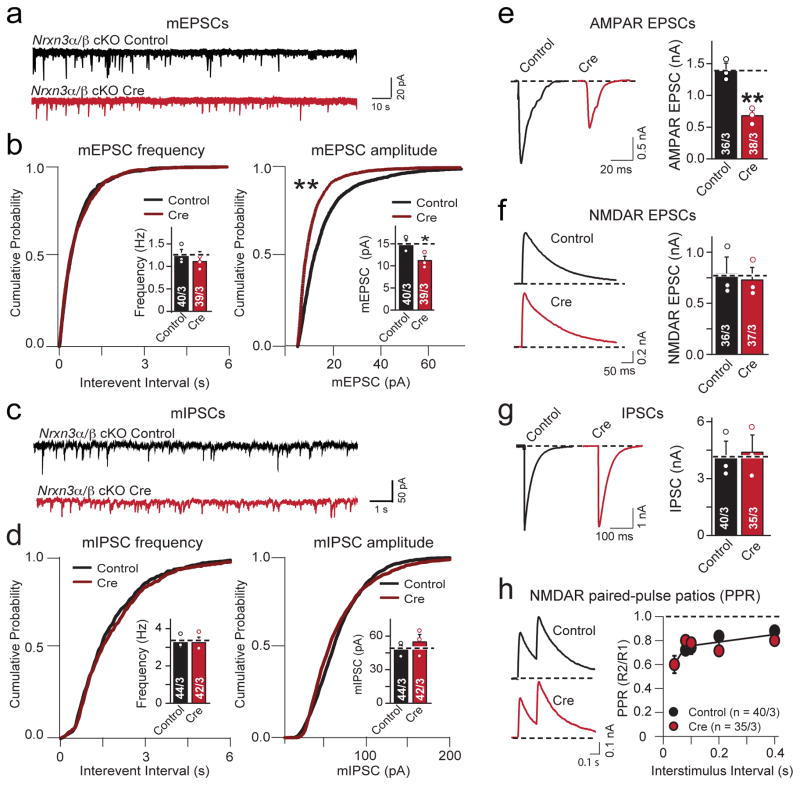
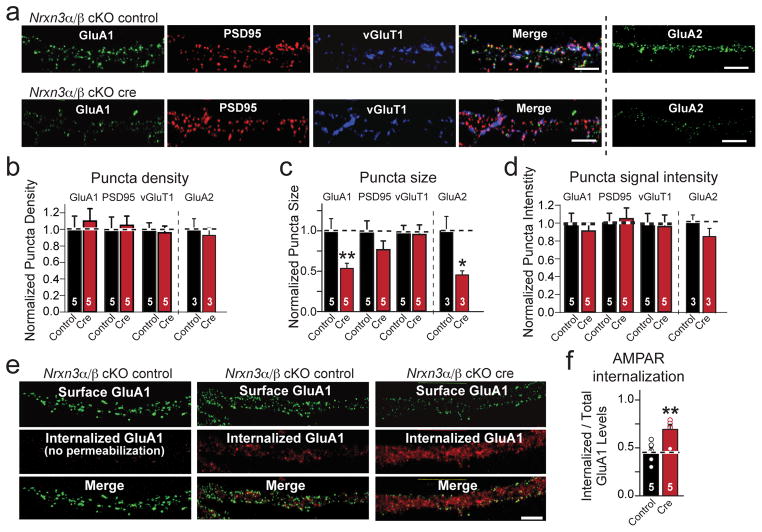
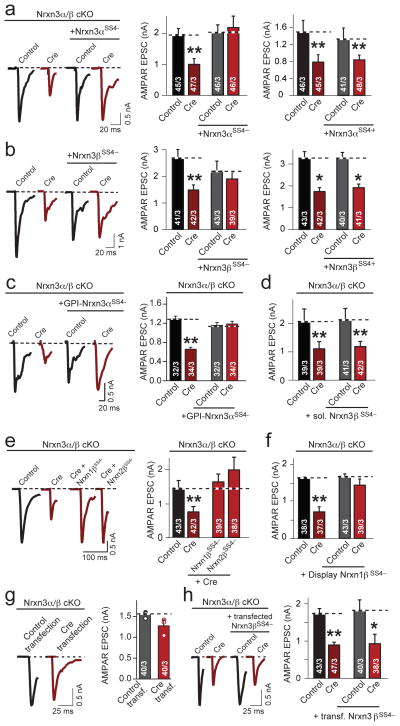
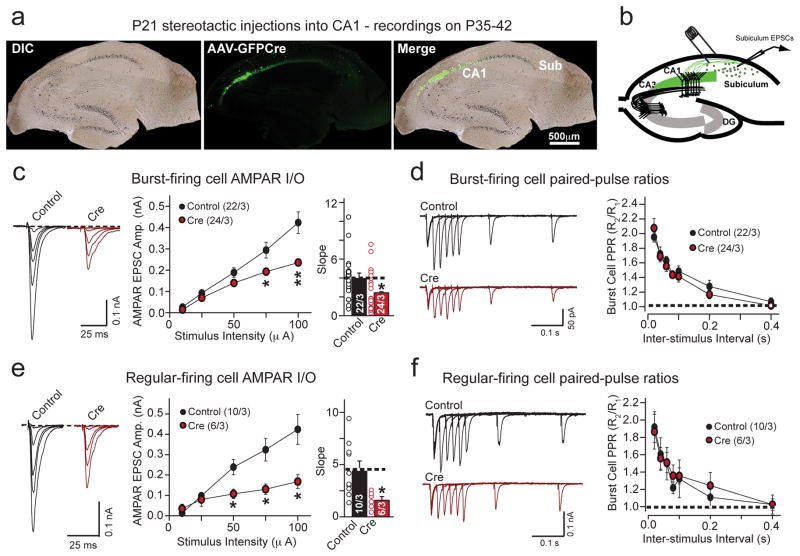
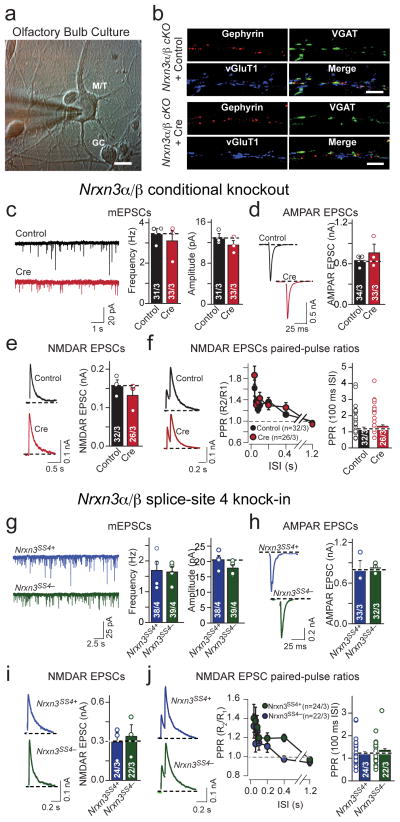
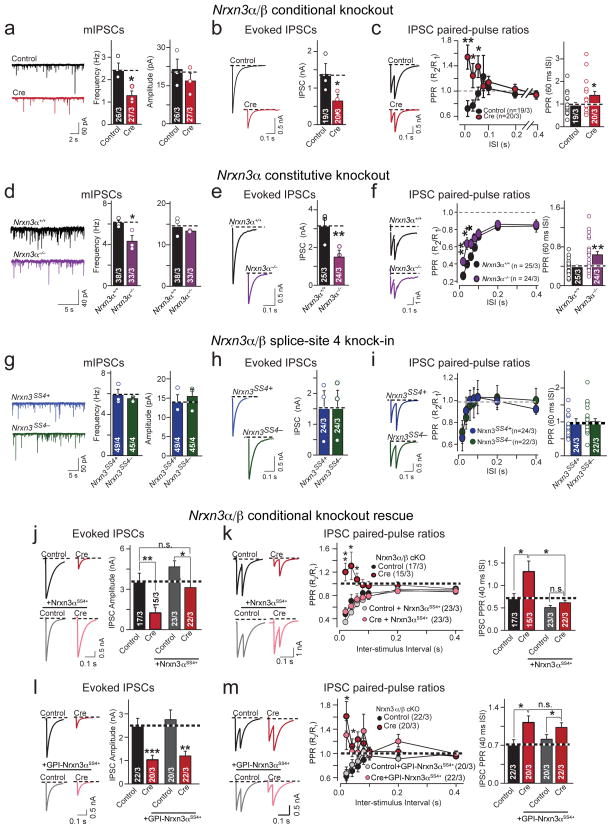
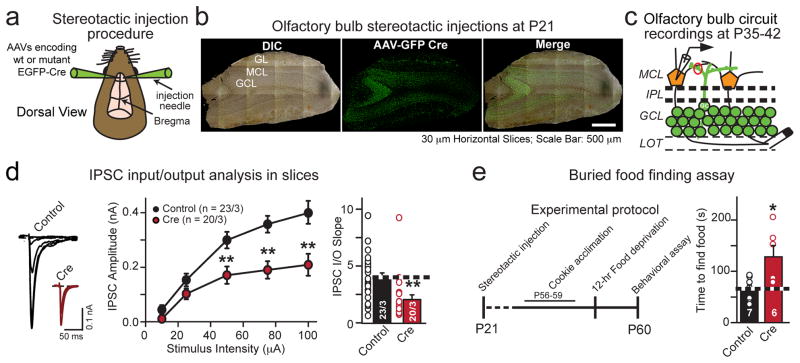
α- and β-neurexins are presynaptic cell-adhesion molecules whose general importance for synaptic transmission is well documented. The specific functions of neurexins, however, remain largely unknown because no conditional neurexin knockouts are available and targeting all α- and β-neurexins produced by a particular gene is challenging. Using newly generated constitutive and conditional knockout mice that target all neurexin-3α and neurexin-3β isoforms, we found that neurexin-3 was differentially required for distinct synaptic functions in different brain regions. Specifically, we found that, in cultured neurons and acute slices of the hippocampus, extracellular sequences of presynaptic neurexin-3 mediated trans-synaptic regulation of postsynaptic AMPA receptors. In cultured neurons and acute slices of the olfactory bulb, however, intracellular sequences of presynaptic neurexin-3 were selectively required for GABA release. Thus, our data indicate that neurexin-3 performs distinct essential pre- or postsynaptic functions in different brain regions by distinct mechanisms.


Figures

Figure 1
Figure 1. Generation of conditional and constitutive Nrxn3α/β KO mice: Constitutive Nrxn3α/β KO impairs survival
a, Structure of Nrxn3α and Nrxn3β, with locations of the six canonical sites of alternative splicing (SS#1 to SS#6) and of exon 18. LNS: Laminin G-neurexin-sex hormone binding globulin domain. EGF: Epidermal growth factor-like repeat. CHO: carbohydrate-attachment sequence. C-C: cysteine loop. b, Targeting strategy for the generation of conditional Nrxn3α/β KO mice in which all Nrxn3α and Nrxn3β forms neurexins are conditionally deleted by cre-recombinase. c, Survival rates of P21 of male and female offspring from heterozygous constitutive Nrxn3α/β KO mice (stepped background shadow = expected Mendelian ratio; p<0.001). d, Average body weight of Nrxn3+/+, Nrxn3+/− and Nrxn3−/− mice as a function of age (P5: p = 0.144; P7: p = 0.00375; P9: = 0.003; P11: p = 0.00134; P13: p < 0.0001; P15: p < 0.0001; P17: p = 0.0001; P19: p = 0.000178; P21: p = 0.0151; P23: p = 0.305; P25: p = 0.0807; P27: p = 0.0115; P29: p < 0.0001; P31: p = 0.00999). e, Distance moved (left) and ataxia indices (right) of P35 Nrxn3α/β KO mice over a 30 min force plate trial (***, p <0.0001). Data shown in (d and e) are means ± SEMs (numbers in bars = number of mice analyzed. Statistical significance was assessed using the χ2-test comparing the observed to the expected Mendelian distribution (c) or by single-factor ANOVA (d and e). For additional information see supplementary figure 1.
Figure 2
Figure 2. Conditional Nrxn3α/β KO selectively decreases AMPAR-mediated synaptic transmission in cultured hippocampal neurons
a, Representative traces of mEPSCs recorded from cultured hippocampal pyramidal neurons from homozygous Nrxn3α/β cKO mice in 1 μM tetrodotoxin and 100 μM picrotoxin. Neurons were infected with lentiviruses expressing inactive (control) or active cre-recombinase (cre) at 4–5 days in vitro (DIV), and analyzed at 14–16 DIV. b, Cumulative distribution plots of the mEPSC frequency and amplitude in hippocampal Nrxn3α/β cKO neurons infected with lentiviruses expressing inactive (control) or active cre-recombinase (cre) (mEPSC frequency cumulative probability: p = 0.972, frequency: p = 0.128; amplitude cumulative probability: p < 0.0001, mEPSC amplitude bar graph: p = 0.0216). c & d, Same as in a & b, but analyzing mIPSCs (mIPSC frequency cumulative probability: p = 0.481, frequency: p = 0.879; amplitude cumulative probability: p = 0.392, amplitude: p = 0.467). e–g, Evoked synaptic responses in control and Nrxn3α/β cKO neurons. Panels show representative traces (left) and summary graphs of the response amplitudes (right) for AMPAR- (e; p = 0.0036) and NMDAR-mediated EPSCs (f; p = 0.752) and for GABA-receptor-mediated IPSCs (g; p = 0.821). h, Paired-pulse ratio measurements of NMDAR-mediated EPSCs demonstrate that there is no change in release probability in Nrxn3α/β deficient neurons (80 ms ISI: p = 0.969) Data shown are means ± SEM; numbers of cells/independent cultures analyzed are indicated. Statistical significance was assessed by K-S test for cumulative probability plots, (b and d) and single-factor ANOVA. For more information, please supplementary figure 2.
Figure 3
Figure 3. Conditional Nrxn3α/β KO destabilizes postsynaptic AMPAR-levels
a, Representative immunofluorescence images of dendritic surface-exposed AMPA-receptor subunits GluA1 and GluA2 and of synaptic markers vGluT1 and PSD95 in control and Nrxn3α/β cKO neurons (scale bar = 5 μm). b–d, Density (b), size (c), and intensity (d) of GluA1-, GluA2-, PSD95-, and vGluT1-containing synapses in control and Nrxn3α/β cKO neurons (Density: GluA1, p = 0.698; GluA2, p = 0.631; PSD95, p = 0.818; vGluT1, p = 0.758. Size: GluA1, p = 0.018; GluA2, p = 0.0387, PSD95, p = 0.186; vGluT1, p = 0.421. Intensity: GluA1, p = 0.579; GluA2, p = 0.267; PSD95, p = 0.821; vGluT1, p = 0.796). e–f, Representative images (e) and summary graph (f) of GluR1 internalization experiments in which control and Nrxn3α/β KO neurons were incubated with GluA1 antibodies for 5 min, chased for 20 min, and then the surface-exposed and internalized GluR1 was labeled with two different secondary antibodies. Control images on the left are from neurons without permeabilization to ensure that surface-exposed and internalized GluA1 can be cleanly differentiated (scale bar = 5 μm). Internalization is quantified (f) as the ratio of internalized to total GluA1 (**, p = 0.0034). Data in b–d and f are means ± SEM (n=5 cultures); statistical significance was evaluated by single factor ANOVA. Please see supplementary figure 3 for absolute quantification of puncta parameters.
Figure 4
Figure 4. Rescue of AMPAR-mediated EPSCs in cultured hippocampal Nrxn3α/β cKO neurons by pre-synaptic neurexins lacking an insert in SS#4
a–f, Summary data of AMPAR-mediated EPSC rescue experiments, performed as in Figure 2a and co-infected with lentivirus expressing the following: a, Nrxn3αSS4− (cre: p = 0.0014; cre + Nrxn3αSS4−: p = 0.962) or Nrxn3αSS4+ (cre: p = 0.00836; cre + Nrxn3αSS4+: p = 0.00450). b, Nrxn3β SS4− (cre: p = 0.00785; cre + Nrxn3βSS4−: p = 0.647) or Nrxn3βSS4− (cre: p = 0.0138; cre + Nrxn3βSS4+: p = 0.0118). c, GPI-Nrxn3αSS4− (cre: p = 0.0009; cre + GPI-Nrxn3αSS4−: p = 0.742). d, Endogenous soluble form of Nrxn3βSS4 (cre: p = 0.003; cre + sNrxn3βSS4−: p = 0.007). e, Nrxn1βSS4− and Nrxn2βSS4− (cre: p = 0.0025; cre + Nrxn1βSS4−: p = 0.717; cre + Nrxn2βSS4−: p = 0.697). f, Nrxn1βSS4− fused to the PDGF receptor (cre: p = 0.0073; cre + Nrxn1βSS4−-PDGFR: p = 0.535). g, Traces and summary graph of AMPAR-mediated EPSCs measured in GFP-positive Nrxn3α/β cKO neurons sparsely co-transfected with inactive (control) or active cre-recombinase (cre) and EGFP (p = 0.100). h, Traces and summary graph of AMPAR-mediated EPSCs measured in GFP+ Nrxn3α/β cKO neurons, infected with lentivirus (as in (a)), and sparsely co-transfected with EGFP and Nrxn3βSS4−,plasmids (**, p = 0.00112; *, p = 0.0186). Data shown are means ± SEMs; numbers in bars: cells/independent cultures analyzed. Statistical significance was assessed using single-factor ANOVA. For more information, please see supplementary figure 4.
Figure 5
Figure 5. Conditional in vivo ablation of Nrxn3α/β in presynaptic hippocampal CA1-region neurons impairs postsynaptic AMPAR-mediated responses in the subiculum
a, Hippocampal brain sections of P35 male animals illustrating complete targeted infection of the CA1-region without significant infection of the subiculum, following the stereotactic injection of AAVs expressing EGFP-tagged inactive (control) or active (cre) cre-recombinase at P21 (scale bar: 500 μm). b, Schematic illustrating the electrophysiological recording configuration to selectively evoke AMPAR-mediated EPSCs at CA1-subiculum synapses. c & e, Input-output representative traces (left), summary graph (middle) and slope (right) for AMPAR EPSCs measured in burst spiking (c; 10μA: p = 0.0728; 25μA: p = 0.177; 50μA: p = 0.122; 75μA: p = 0.0198; 100μA: p = 0.00748 and slope: p = 0.0362) or regular spiking (e; 10μA: p = 0.132; 25μA: p = 0.188; 50μA: p = 0.0248, 75μA: 0.0349, 100μA: 0.035 and slope: p = 0.0172) neurons from mice prepared as in (a). d & f, Paired-pulse ratio measurements from burst spiking (d; 60ms ISI: p = 0.422) or regular spiking (f; 60ms ISI: p = 0.954) subicular neurons in mice injected with inactive (control) or active (cre) cre-recombinase in region CA1. Representative traces (left) and summary graph (right) are shown. Data are means ± SEMs; means were calculated from the total number of cells. Numbers in bars: cell/animal. Statistical significance was assessed using single-factor ANOVA. For more information on subicular neuron identification and passive membrane properties of each cell type, see supplementary figure 5.
Figure 6
Figure 6. Different from the hippocampus Nrxn3α/β is not required for AMPAR-mediated synaptic responses in the olfactory bulb
a, Representative image of DIV 14 cultured olfactory bulb neurons. Note the difference in soma size that was used to identify neuron subtypes (M/T: mitral/tufted cell; GC: granule cell; scale bar: 10 μm). b, Representative images of excitatory and inhibitory synapse density immunostained for inhibitory (vGAT and gephyrin) and excitatory (vGluT1) markers in cultured Nrxn3α/β cKO olfactory bulb neurons infected with lentiviruses expressing EGFP-tagged inactive (control) or active (cre) cre-recombinase. n = 3 experiments; scale bar: 5 μm. c–f, Sample traces and summary graphs of mEPSCs (c; frequency: p = 0.603; amplitude: p = 0.276), AMPAR EPSCs (d; p = 0.469), NMDAR EPSCs (e; p = 0.537) and NMDAR paired-pulse ratios (f; 100ms ISI: p = 0.300) recorded from Nrxn3α/β cKO mitral/tufted olfactory bulb neurons, cultured as in (b). g–j, Sample traces and summary graphs of mEPSCs (g; frequency: p = 0.883; amplitude: p = 0.181), evoked AMPAR EPSCs (h; p = 0.881), evoked NMDAR EPSCs (i; p = 0.721) and NMDAR-EPSC paired-pulse ratios (j; 100ms ISI: 0.807) recorded from Nrxn3α/β SS#4 KI M/T olfactory bulb neurons infected with lentiviruses expressing EGFP-tagged inactive (Nrxn3α/βSS4+) or active (Nrxn3α/βSS4−) cre-recombinase. Data are means ± SEM. Bar graphs: cells/ independent culture experiments. Means and SEMs: from three independent experiments except for figures f and j, where the number of cells was. Statistical significance was determined by single-factor ANOVA. For more information, please see supplemental figure 6.
Figure 7
Figure 7. Nrxn3 is essential for presynaptic GABA release in olfactory bulb neurons by an SS#4-independent mechanism
a–c, Sample traces and summary graphs for mIPSCs (a; frequency: p = 0.039; amplitude: 0.419), evoked IPSCs (b; p = 0.024) and IPSC PPRs (c; p = 0.00264 (20ms ISI), 0.0365 (40ms), 0.450 (60ms)), recorded from mitral/tufted cells in cultured Nrxn3α/β cKO olfactory bulb neurons infected with lentiviruses expressing EGFP-tagged inactive (control) or active (cre) cre-recombinase d–f, Same as (a–c), but measured in cultured Nrxn3α+/+ and Nrxn3α−/− olfactory bulb neurons. (d: frequency: p = 0.0435; amplitude: p = 0.367; e: p = 0.0005; f: p = 0.00805 (20ms ISI), 0.00744 (40ms), 0.0327 (60ms)). g–i, Same as (a–c), but measured in cultured Nrxn3α/β SS#4 KI olfactory bulb neurons (g: frequency: p = 0.536, amplitude: p = 0.614; h: p = 0.983; i: 60 ms ISI: p = 0.130). Neurons were infected with lentiviruses as in Fig. 6g. j & k, Rescue of the GABAergic transmission in Nrxn3α/β cKO neurons by full-length Nrxn3αSS4+. Evoked IPSC (j; cre: p = 0.0034; cre + Nrxn3αSS4+: p = 0.0217) and IPSC PPRs (k; cre: p = 0.000515 (20ms ISI), 0.0363 (40ms), 0.02891 (60ms), cre + Nrxn3αSS4+: p = 0.0334 (20ms), 0.128 (40ms), 0.284 (60ms)) in mitral/tufted cells as in Fig. 7c, with or without full-length Nrxn3αSS4+. l & m, Same as in (j) and (k) but with a GPI-anchored Nrxn3αSS4+. Evoked IPSCs (l; cre: p < 0.001; cre + GPI-Nrxn3αSS4+: p = 0.00165) and IPSC PPRs (m; cre: p = 0.0006 (20ms ISI), 0.0107 (40ms), 0.0055 (60ms); cre + GPI-Nrxn3αSS4+: p = 0.0231 (20ms), 0.0213 (40ms), ISI: 0.219 (60ms). Data shown are means ± SEMs; the number of cells/independent cultures analyzed are indicated in the bars. Statistical analyses were calculated from the number of independent cultures (for a, d and g) and from cell number (b, e, h, j–m). Statistical significance was assessed using single-factor ANOVA. For more information, see supplementary figure 7.
Figure 8
Figure 8. Conditional in vivo deletion of Nrxn3α/β in the olfactory bulb decreases GABAergic synaptic transmission at granule cell-mitral/tufted cell synapses and impairs an olfactory behavior
a, Schematic of bilateral stereotactic injections in vivo into the olfactory bulb. b, Representative images of horizontal (30 μm) sections showing. complete infection of the granule cell layer. Nrxn3α/β cKO mice were bilaterally injected with AAV expressing EGFP fused to inactive (control) or active (cre) cre-recombibase at P21, and analyzed at P35-42. (scale bar: 500 μm). c, Schematic of recording configuration from uninfected postsynaptic mitral/tufted cells in the mitral cell layer (MCL). Granule cell IPSCs were evoked by antidromic extracellular stimulation in the lateral olfactory tract (LOT). d, IPSC input-output representative traces (left), plotted data (middle) and slope (right) from olfactory bulb slices from Nrxn3α/β cKO mice that had been infected as in (b). 10 μA: p = 0.0749; 25μA: p = 0.111; 50 μA: p = 0.00578; 75 μA: p = 0.00052; 100 μA: p = 0.0026; slope: p = 0.00370. e, Schematic of the experimental protocol (left) and summary graph (right) of the buried food finding assay. Bilateral genetic ablation of Nrxn3α/β in olfactory bulbs (as in (b)) significantly increased the latency of food finding in behaving mice (p = 0.0162). Data are means ± SEMs; the number of cells/independent animals analyzed are indicated in the bars (d) or number of animals (e). Statistical significance was assessed using single-factor ANOVA. For more information, see supplementary figure 8.

References

    1. Bang ML, Owczarek S. A matter of balance: role of neurexin and neuroligin at the synapse. Neurochem Res. 2013;38:1174–1189. doi: 10.1007/s11064-013-1029-9. - DOI - PubMed
    1. Knight D, Xie W, Boulianne GL. Neurexins and neuroligins: recent insights from invertebrates. Mol Neurobiol. 2011;44:426–440. doi: 10.1007/s12035-011-8213-1. - DOI - PMC - PubMed
    1. Krueger DD, Tuffy LP, Papadopoulos T, Brose N. The role of neurexins and neuroligins in the formation, maturation, and function of vertebrate synapses. Curr Opin Neurobiol. 2012;22:412–422. doi: 10.1016/j.conb.2012.02.012. - DOI - PubMed
    1. Südhof TC. Neuroligins and neurexins link synaptic function to cognitive disease. Nature. 2008;455:903–911. doi: 10.1038/nature07456. - DOI - PMC - PubMed
    1. Tabuchi K, Südhof TC. Structure and evolution of neurexin genes: insight into the mechanism of alternative splicing. Genomics. 2002;79:849–859. doi: 10.1006/geno.2002.6780. - DOI - PubMed

Publication types