. 2015 Jun 1;10(6):e0126230.
doi: 10.1371/journal.pone.0126230. eCollection 2015.

Three dimensional imaging of paraffin embedded human lung tissue samples by micro-computed tomography

Affiliations

Three dimensional imaging of paraffin embedded human lung tissue samples by micro-computed tomography

Anna E Scott et al. PLoS One. .

Abstract

Background: Understanding the three-dimensional (3-D) micro-architecture of lung tissue can provide insights into the pathology of lung disease. Micro computed tomography (µCT) has previously been used to elucidate lung 3D histology and morphometry in fixed samples that have been stained with contrast agents or air inflated and dried. However, non-destructive microstructural 3D imaging of formalin-fixed paraffin embedded (FFPE) tissues would facilitate retrospective analysis of extensive tissue archives of lung FFPE lung samples with linked clinical data.

Methods: FFPE human lung tissue samples (n = 4) were scanned using a Nikon metrology µCT scanner. Semi-automatic techniques were used to segment the 3D structure of airways and blood vessels. Airspace size (mean linear intercept, Lm) was measured on µCT images and on matched histological sections from the same FFPE samples imaged by light microscopy to validate µCT imaging.

Results: The µCT imaging protocol provided contrast between tissue and paraffin in FFPE samples (15 mm x 7 mm). Resolution (voxel size 6.7 µm) in the reconstructed images was sufficient for semi-automatic image segmentation of airways and blood vessels as well as quantitative airspace analysis. The scans were also used to scout for regions of interest, enabling time-efficient preparation of conventional histological sections. The Lm measurements from µCT images were not significantly different to those from matched histological sections.

Conclusion: We demonstrated how non-destructive imaging of routinely prepared FFPE samples by laboratory µCT can be used to visualize and assess the 3D morphology of the lung including by morphometric analysis.


Conflict of interest statement

Competing Interests: The authors have declared that no competing interests exist.

Figures

Fig 1
Fig 1. Mass attenuation coefficients versus X-ray energy for paraffin wax and soft-tissue.
The tolerable range indicates an acceptable difference in mass attenuation between the paraffin and tissue, for samples thicknesses down to approximately 5mm.
Fig 2
Fig 2. Registration based image matching of μCT and histological section stained with Movat’s Pentachrome.
A. shows the histological section imaged using a 10x objective on a Dot-Slide scanning system. The initial image required deformation, rotation and translation using UnwarpJ elastic registration [23] to match the μCT image, reflecting deformation during sectioning. The final transformed image of the histological section (B) and with a matching slice from the corresponding μCT image (C). Details of the same sub-region in A, B and C are shown in D, E and F. Structural details in the μCT image correspond closely to those seen by light microscopy.
Fig 3
Fig 3. Matched serial μCT and Movat’s Pentachrome stained histological sections.
Serial μCT images (A-D) and corresponding Movat’s stained histological sections (E-H) demonstrate the ability of the μCT scanner to provide sufficient contrast between tissue and paraffin to allow image analysis. Structures at the cellular level can be differentiated through staining of histological sections. Microscopy can achieve higher resolution as visualized by the magnified comparison of C (zoomed image) and G (20x magnification). [TB = terminal bronchiole, RB = respiratory bronchiole].
Fig 4
Fig 4. 3D rendering of small airways and blood vessels.
A 3D rendering of the segmentation of small airways (blue) and blood vessels (red) extracted from the μCT images of the FFPE sample also shown in Fig 2. Manual definition of the airway or vessel profile was combined with use of an automatic 3D seed growth tool (VGStudio Max) to delineate connected structures.
Fig 5
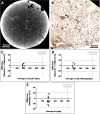
Fig 5. Comparison of mean linear intercept measurements.
(A) Representative micro CT slice from a formalin fixed-paraffin embedded (FFPE) core and (B) the corresponding histology section at the same resolution (imaged with an objective of 2x magnification) matched using image registration. 10 μCT slices matched to 10 histological sections were randomly selected from one of the scanned samples and mean linear intercept counting was performed on all images. The Bland-Altman plots show the comparison of mean linear intercept counts between the 2 readers (co-authors TLH and DMV), for (C) micro CT, (D) histology, and (E) demonstrates the comparison of mean linear intercept measurements between the two imaging modalities.

References

    1. Hasegawa M, Nasuhara Y, Onodera Y, Makita H, Nagai K, Fuke S, et al. (2006) Airflow limitation and airway dimensions in chronic obstructive pulmonary disease. Am J Respir Crit Care Med 173: 1309–1315. - PubMed
    1. Ranga V, Kleinerman J (1978) Structure and function of small airways in health and disease. Arch Pathol Lab Med 102: 609–617. - PubMed
    1. McDonough JE, Yuan R, Suzuki M, Seyednejad N, Elliott WM, Sanchez PG, et al. (2011) Small-airway obstruction and emphysema in chronic obstructive pulmonary disease. N Engl J Med 365: 1567–1575. 10.1056/NEJMoa1106955 - DOI - PMC - PubMed
    1. Roberts N, Magee D, Song Y, Brabazon K, Shires M, Crellin D, et al. (2012) Toward routine use of 3D histopathology as a research tool. Am J Pathol 180: 1835–1842. 10.1016/j.ajpath.2012.01.033 - DOI - PMC - PubMed
    1. Paulus MJ, Gleason SS, Kennel SJ, Hunsicker PR, Johnson DK (2000) High resolution X-ray computed tomography: an emerging tool for small animal cancer research. Neoplasia 2: 62–70. - PMC - PubMed

Publication types

LinkOut - more resources