

Noise-driven causal inference in biomolecular networks
- PMID: 26030907
- PMCID: PMC4452541
- DOI: 10.1371/journal.pone.0125777
Noise-driven causal inference in biomolecular networks
Abstract
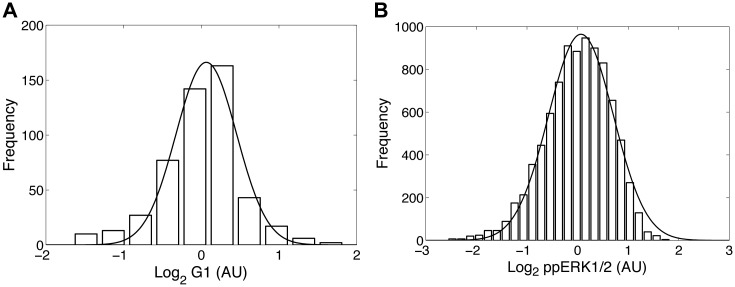
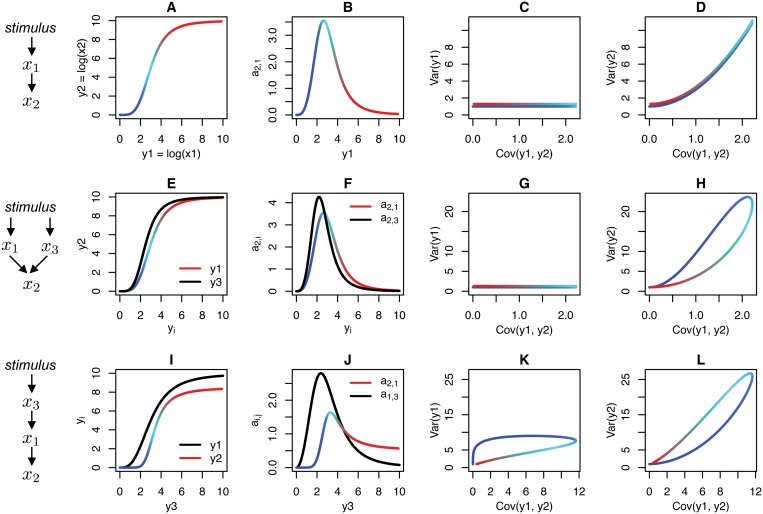
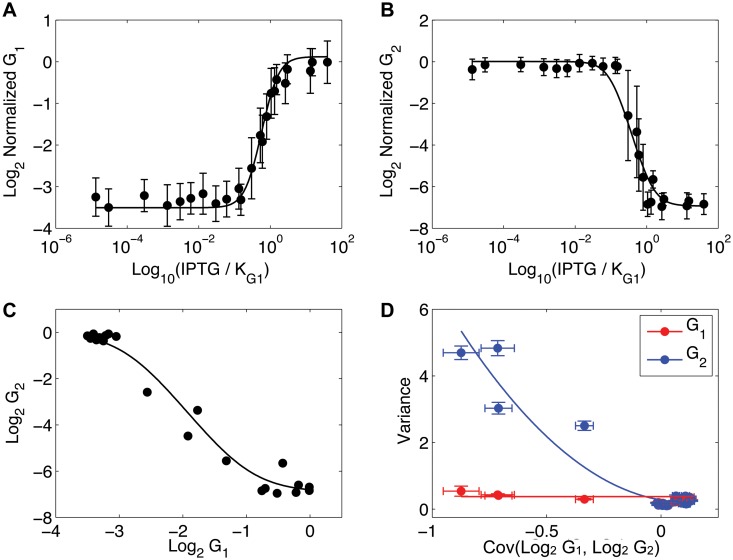
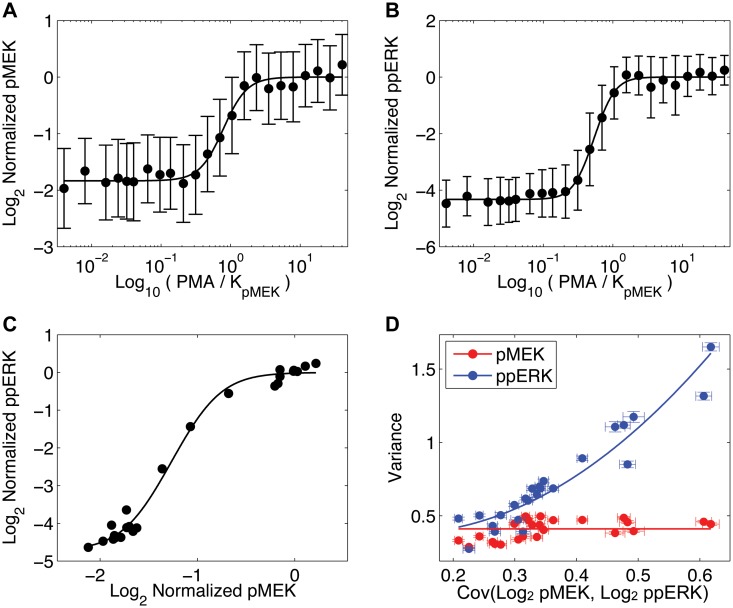
Single-cell RNA and protein concentrations dynamically fluctuate because of stochastic ("noisy") regulation. Consequently, biological signaling and genetic networks not only translate stimuli with functional response but also random fluctuations. Intuitively, this feature manifests as the accumulation of fluctuations from the network source to the target. Taking advantage of the fact that noise propagates directionally, we developed a method for causation prediction that does not require time-lagged observations and therefore can be applied to data generated by destructive assays such as immunohistochemistry. Our method for causation prediction, "Inference of Network Directionality Using Covariance Elements (INDUCE)," exploits the theoretical relationship between a change in the strength of a causal interaction and the associated changes in the single cell measured entries of the covariance matrix of protein concentrations. We validated our method for causation prediction in two experimental systems where causation is well established: in an E. coli synthetic gene network, and in MEK to ERK signaling in mammalian cells. We report the first analysis of covariance elements documenting noise propagation from a kinase to a phosphorylated substrate in an endogenous mammalian signaling network.
Conflict of interest statement
Figures
Similar articles
-
Controlling E. coli Gene Expression Noise.IEEE Trans Biomed Circuits Syst. 2015 Aug;9(4):497-504. doi: 10.1109/TBCAS.2015.2461135. Epub 2015 Sep 10. IEEE Trans Biomed Circuits Syst. 2015. PMID: 26372647
-
Gene network shaping of inherent noise spectra.Nature. 2006 Feb 2;439(7076):608-11. doi: 10.1038/nature04194. Nature. 2006. PMID: 16452980
-
Causal relationship inference for a large-scale cellular network.Bioinformatics. 2010 Aug 15;26(16):2020-8. doi: 10.1093/bioinformatics/btq325. Epub 2010 Jun 16. Bioinformatics. 2010. PMID: 20554691
-
Multivariate analysis of noise in genetic regulatory networks.J Theor Biol. 2004 Aug 21;229(4):501-21. doi: 10.1016/j.jtbi.2004.04.034. J Theor Biol. 2004. PMID: 15246787
-
Biological Network Inference and analysis using SEBINI and CABIN.Methods Mol Biol. 2009;541:551-76. doi: 10.1007/978-1-59745-243-4_24. Methods Mol Biol. 2009. PMID: 19381531 Review.
Cited by
-
Network inference from short, noisy, low time-resolution, partial measurements: Application to C. elegans neuronal calcium dynamics.Proc Natl Acad Sci U S A. 2023 Mar 21;120(12):e2216030120. doi: 10.1073/pnas.2216030120. Epub 2023 Mar 16. Proc Natl Acad Sci U S A. 2023. PMID: 36927154 Free PMC article.
-
SERGIO: A Single-Cell Expression Simulator Guided by Gene Regulatory Networks.Cell Syst. 2020 Sep 23;11(3):252-271.e11. doi: 10.1016/j.cels.2020.08.003. Epub 2020 Aug 31. Cell Syst. 2020. PMID: 32871105 Free PMC article.
-
Modeling of cytometry data in logarithmic space: When is a bimodal distribution not bimodal?Cytometry A. 2018 Jun;93(6):611-619. doi: 10.1002/cyto.a.23333. Epub 2018 Feb 16. Cytometry A. 2018. PMID: 29451717 Free PMC article.
-
The SPEAK study rationale and design: A linguistic corpus-based approach to understanding thought disorder.Schizophr Res. 2023 Sep;259:80-87. doi: 10.1016/j.schres.2022.12.048. Epub 2023 Jan 31. Schizophr Res. 2023. PMID: 36732110 Free PMC article.
-
Information-theoretic analysis of the directional influence between cellular processes.PLoS One. 2017 Nov 9;12(11):e0187431. doi: 10.1371/journal.pone.0187431. eCollection 2017. PLoS One. 2017. PMID: 29121044 Free PMC article.
References
-
- Granger CWJ. Investigating Causal Relations by Econometric Models and Cross-spectral Methods. Econometrica. 1969;37(3):424–438. 10.2307/1912791 - DOI
-
- Pearl J. Causality: Models, Reasoning, and Inference. New York: Cambridge University Press; 2000.
-
- Koller D, Friedman N. Probabilistic Graphical Models: Principles and Techniques. MIT Press; 2009.
Publication types
MeSH terms
Grants and funding
LinkOut - more resources
Full Text Sources
Other Literature Sources
Medical
Miscellaneous
