Review
. 2015 Oct;21(10):754-67.
doi: 10.1111/cns.12410. Epub 2015 Jun 1.

Propagation of pathology through brain networks in neurodegenerative diseases: from molecules to clinical phenotypes

Affiliations
Review

Propagation of pathology through brain networks in neurodegenerative diseases: from molecules to clinical phenotypes

Federica Agosta et al. CNS Neurosci Ther. 2015 Oct.

Abstract

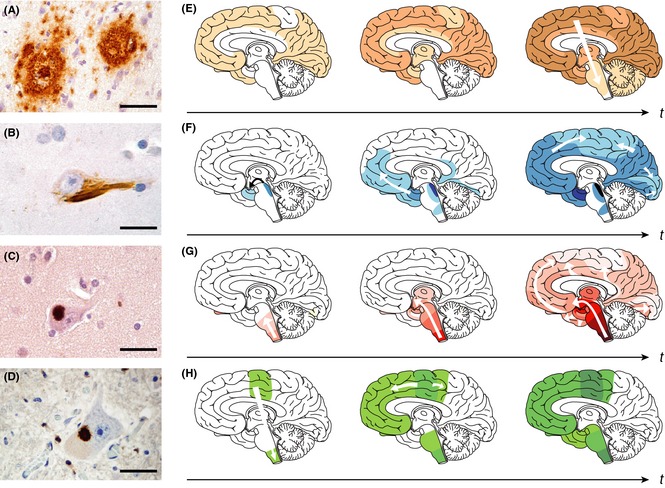
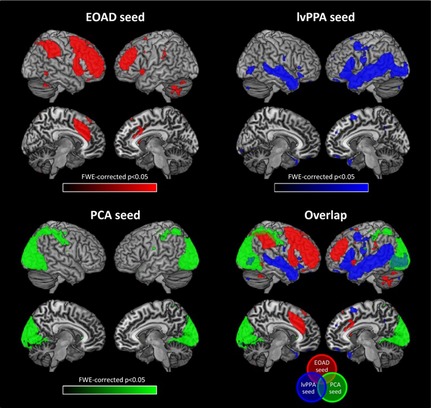
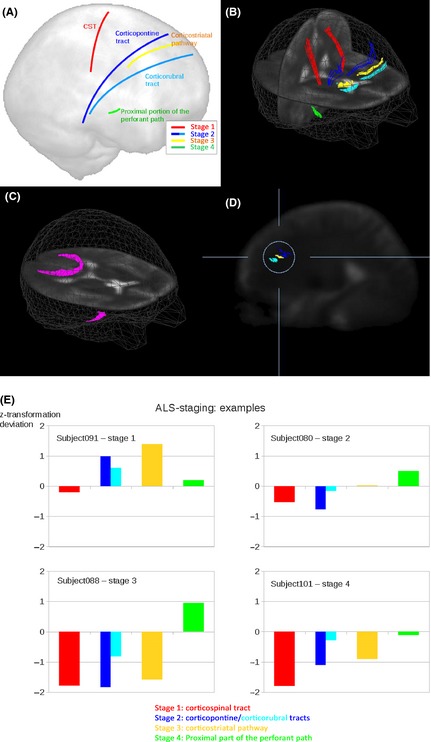
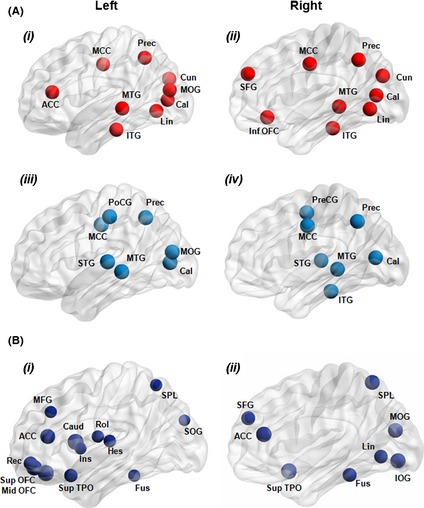
The cellular mechanisms underlying the stereotypical progression of pathology in neurodegenerative diseases are incompletely understood, but increasing evidence indicates that misfolded protein aggregates can spread by a self-perpetuating neuron-to-neuron transmission. Novel neuroimaging techniques can help elucidating how these disorders spread across brain networks. Recent knowledge from structural and functional connectivity studies suggests that the relation between neurodegenerative diseases and distinct brain networks is likely to be a strict consequence of diffuse network dynamics. Diffusion tensor magnetic resonance imaging also showed that measurement of white matter tract involvement can be a valid surrogate to assess the in vivo spreading of pathological proteins in these conditions. This review will introduce briefly the main molecular and pathological substrates of the most frequent neurodegenerative diseases and provide a comprehensive overview of neuroimaging findings that support the "network-based neurodegeneration" hypothesis in these disorders. Characterizing network breakdown in neurodegenerative diseases will help anticipate and perhaps prevent the devastating impact of these conditions.

Keywords: Diffusion tensor MRI; Network-based neurodegeneration; Neurodegenerative diseases; Prion-like proteins; Resting-state functional MRI.


Conflict of interest statement

F. Agosta serves on the editorial board of the Journal of Neurology; has received speaker honoraria from Biogen Idec and EXCEMED—Excellence in Medical Education; and receives research supports from the Italian Ministry of Health, and AriSLA (Fondazione Italiana di Ricerca per la SLA). M. Weiler reports no disclosures. M. Filippi is Editor‐in‐Chief of the Journal of Neurology; serves on scientific advisory boards for Teva Pharmaceutical Industries; has received compensation for consulting services and/or speaking activities from Bayer Schering Pharma, Biogen Idec, Merck Serono, Novartis, and Teva Pharmaceutical Industries; and receives research support from Bayer Schering Pharma, Biogen Idec, Merck Serono, Teva Pharmaceutical Industries, Novartis, Italian Ministry of Health, Fondazione Italiana Sclerosi Multipla, Cure PSP, Alzheimer's Drug Discovery Foundation (ADDF), the Jacques and Gloria Gossweiler Foundation (Switzerland), and AriSLA (Fondazione Italiana di Ricerca per la SLA).

Figures

Figure 1
Figure 1
Protein aggregates show “prion‐like” self‐propagation and spreading in experimental settings, consistent with the progressive appearance of the lesions in the brain of patients with neurodegenerative diseases. (A) Aβ deposits in the neocortex of a patient with Alzheimer disease (AD). (B) Tau inclusion as a neurofibrillary tangle in a neocortical neuron of a patient with AD. (C) α‐Synuclein inclusion (Lewy body) in a neocortical neuron from a patient with Parkinson disease (PD)/Lewy body dementia. (D) TDP‐43 inclusion in a motor neuron of the spinal cord from a patient with amyotrophic lateral sclerosis (ALS). Scale bars are 50 μm in a and 20 μm in BD. (EH) Characteristic progression of specific proteinaceous lesions in neurodegenerative diseases over time (t, black arrows), inferred from postmortem analyses of brains. Aβ deposits and tau inclusions in brains of patients with AD (E and F), α‐synuclein inclusions in brains of patients with PD (G), and TDP‐43 inclusions in brains of patients with ALS (H). Three stages are shown for each disease, with white arrows indicating the putative spread of the lesions. Reproduced with permission from 2.
Figure 2
Figure 2
Resting‐state functional connectivity network maps in healthy individuals produced by seeding three regions that were specifically atrophied in Alzheimer disease (AD) variants, that is, early‐onset AD (EOAD), posterior cortical atrophy (PCA), and logopenic variant of primary progressive aphasia (lvPPA). Figure shows statistical P maps after correction for multiple comparisons (P < 0.05 family‐wise‐error corrected for multiple comparisons). Reproduced with permission from 64.
Figure 3
Figure 3
In vivo imaging of the disease stages in amyotrophic lateral sclerosis (ALS) using diffusion tensor tractography. (A) Schematic representation of the white matter tracts analyzed. (B) Three‐dimensional images of the corticospinal tract (CST, red) corresponding to ALS stage 1 5, corticopontine tract (dark blue) and corticorubral tract (light blue) corresponding to ALS stage 2 5, corticostriatal pathway (yellow) corresponding to ALS stage 3 5, and proximal portion of the perforant path (green) corresponding to ALS stage 4 5. (C) Reference paths (magenta) show starting points in the corpus callosum (area V) and starting points in the optic tract. (D) Sagittal slice for the illustration of the differences between the corticopontine tract (dark blue), corticorubral tract (light blue), and corticostriatal pathway (yellow). (E) Individual examples for the categorization of patients with ALS into ALS stages based upon deviations of z‐transformed fractional anisotropy values from controls’ values for different ALS stages. Modified with permission from 100.
Figure 4
Figure 4
(A) Cortical hubs of brain functional networks in healthy controls (i, ii) and patients with the behavioral variant of frontotemporal dementia (bvFTD) (iii, iv). (B) Regions showing decreased integrated nodal degree (i, ii) in patients with bvFTD compared to healthy controls. Node size is proportional to the difference in the value of the integrated nodal parameters between the two groups. ACC, anterior cingulate cortex; Cal, calcarine cortex; Caud, caudate nucleus; Cun, cuneus; Fus, fusiform gyrus; Hes, Heschl gyrus; Ins, insula; IOG, inferior occipital gyrus; ITG, inferior temporal gyrus; Lin, lingual gyrus; MCC, middle cingulate cortex; MFG, middle frontal gyrus; MOG, middle occipital gyrus; MTG, middle temporal gyrus; OFC, orbitofrontal cortex; Prec, precuneus; PoCG, postcentral gyrus; PreCG, precentral gyrus; Rec, gyrus rectus; Rol, rolandic operculum; SFG, superior frontal gyrus; SOG, superior occipital gyrus; SPL, superior parietal lobule; STG, superior temporal gyrus; TPO, temporal pole. Reproduced with permission from 126.
Figure 5
Figure 5
(A) Predictions made by network‐based degeneration models: effects of healthy intrinsic connectivity graph metrics on atrophy severity in neurodegenerative diseases. A simplified healthy connectivity graph is shown (far left) for illustration purposes only; circles represent nodes (brain regions), lines represent edges (a connection between two nodes), and edge lengths represent the connectivity strength between nodes, with shorter edges representing stronger connections. The orange node represents an epicenter. Three nodes, labeled as “A”, “B”, and “C”, feature contrasting graph theoretical properties to illustrate predictions made by the network‐based vulnerability models (far right). Listed in the center column are the relationships predicted by each model. For example, the transneuronal spread model predicts that nodes with shorter (↓) paths to the epicenter in health will be associated with greater (↑) atrophy severity in disease. (B) Regions with high total connectional flow (row 1) and shorter functional paths to the epicenters (row 2) showed significantly greater disease vulnerability (P < 0.05 family‐wise‐error corrected for multiple comparisons) in Alzheimer disease (AD), behavioral variant of frontotemporal dementia (bvFTD), semantic dementia (SD), progressive supranuclear palsy (PNFA), and corticobasal degeneration (CBS), whereas inconsistent weaker or nonsignificant relationships were observed between clustering coefficient and atrophy (row 3). Cortical regions = blue circles; subcortical regions = orange circles. Modified with permission from 133.

References

    1. Guo JL, Lee VM. Cell‐to‐cell transmission of pathogenic proteins in neurodegenerative diseases. Nat Med 2014;20:130–138. - PMC - PubMed
    1. Jucker M, Walker LC. Self‐propagation of pathogenic protein aggregates in neurodegenerative diseases. Nature 2013;501:45–51. - PMC - PubMed
    1. Braak H, Braak E. Neuropathological stageing of Alzheimer‐related changes. Acta Neuropathol 1991;82:239–259. - PubMed
    1. Braak H, Del Tredici K, Rub U, de Vos RA, Jansen Steur EN, Braak E. Staging of brain pathology related to sporadic Parkinson's disease. Neurobiol Aging 2003;24:197–211. - PubMed
    1. Brettschneider J, Del Tredici K, Toledo JB, et al. Stages of pTDP‐43 pathology in amyotrophic lateral sclerosis. Ann Neurol 2013;74:20–38. - PMC - PubMed

Publication types