. 2015 Jul 17;290(29):18187-18198.
doi: 10.1074/jbc.M115.638700. Epub 2015 Jun 1.

Complex Formation between Two Biosynthetic Enzymes Modifies the Allosteric Regulatory Properties of Both: AN EXAMPLE OF MOLECULAR SYMBIOSIS

Affiliations

Complex Formation between Two Biosynthetic Enzymes Modifies the Allosteric Regulatory Properties of Both: AN EXAMPLE OF MOLECULAR SYMBIOSIS

Nicola J Blackmore et al. J Biol Chem. .

Abstract

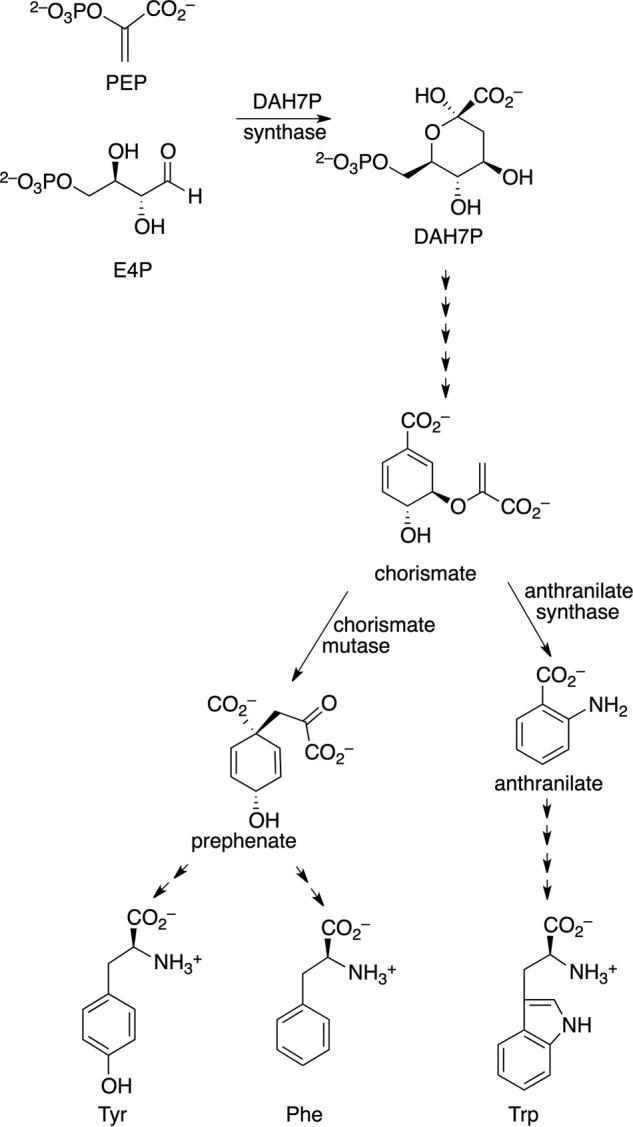
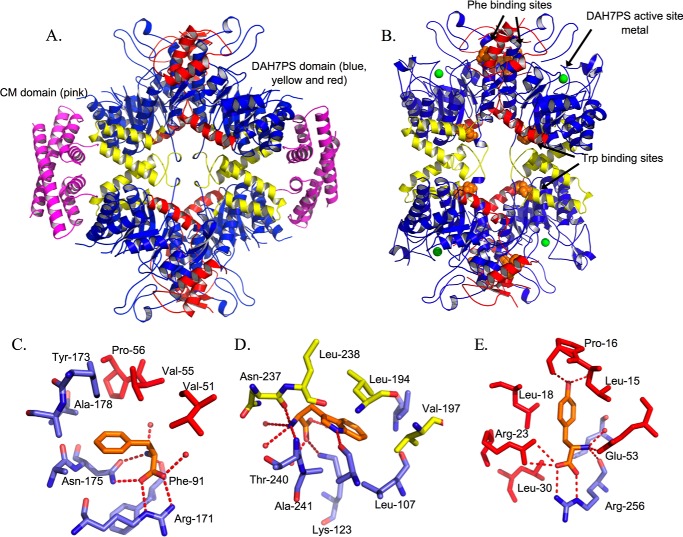
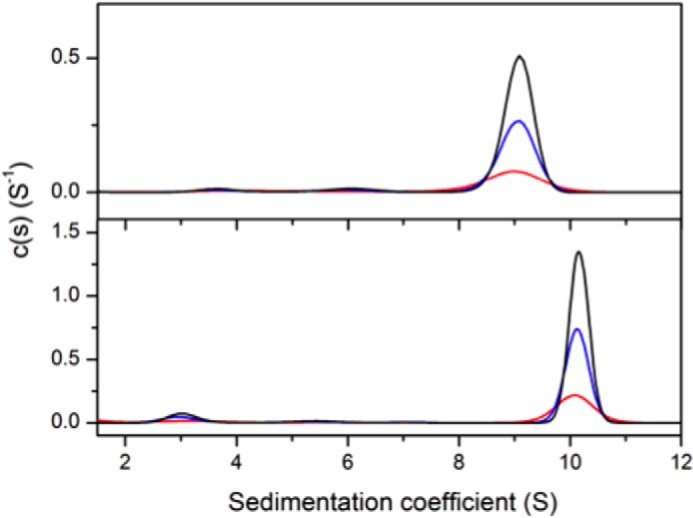
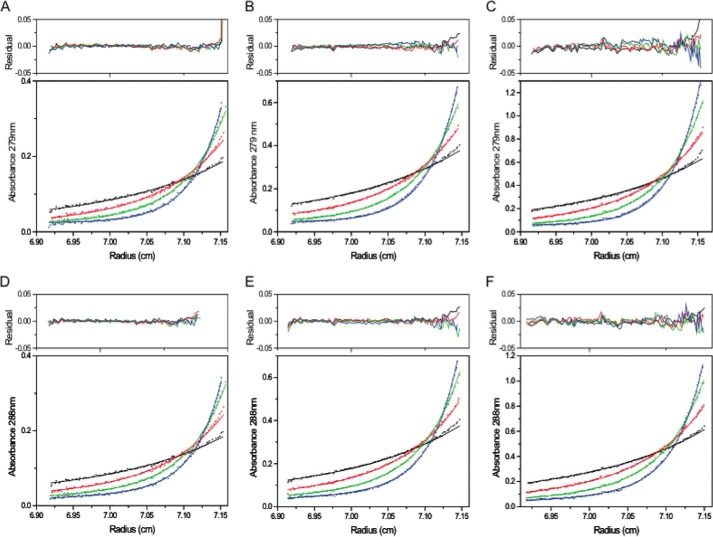
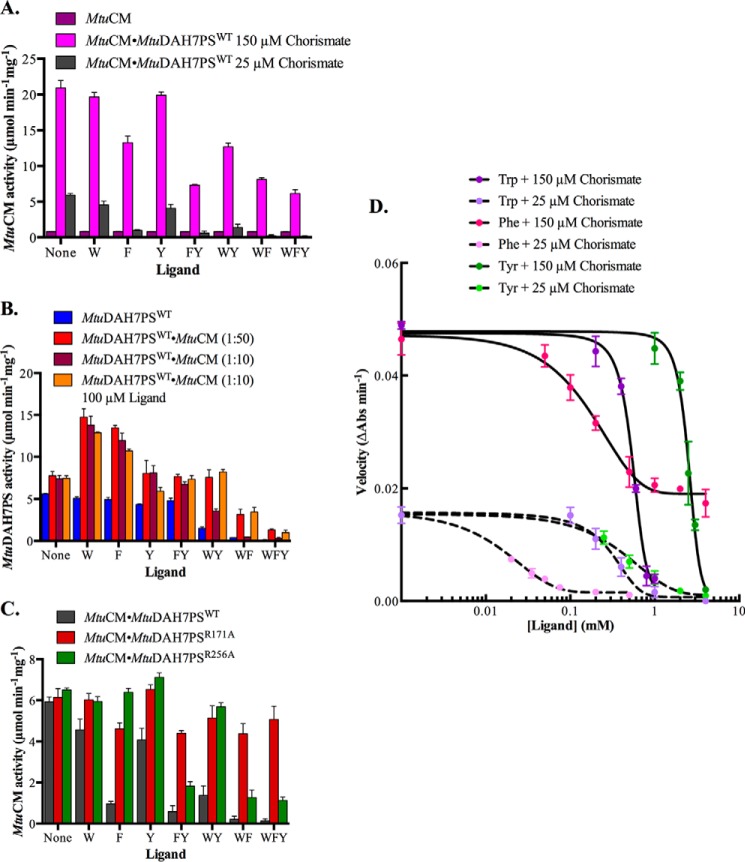
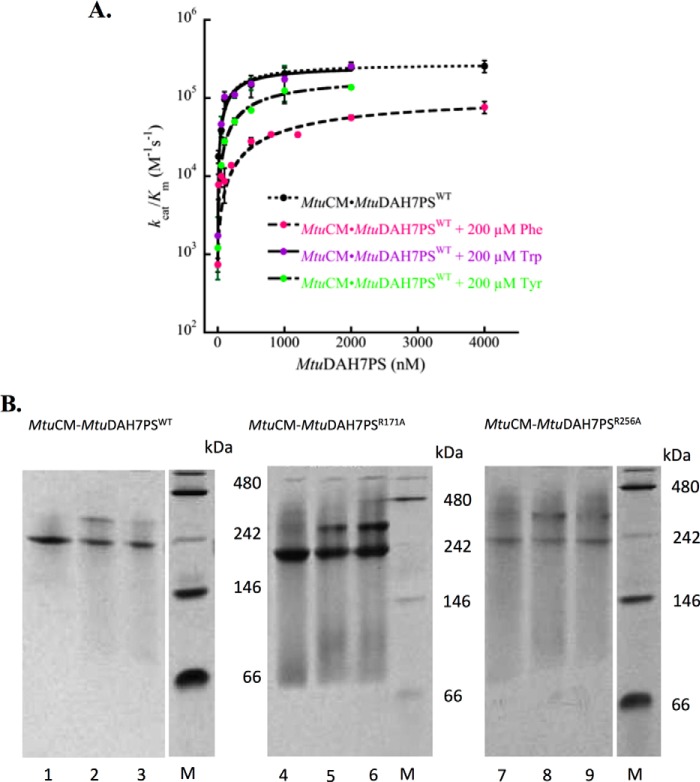
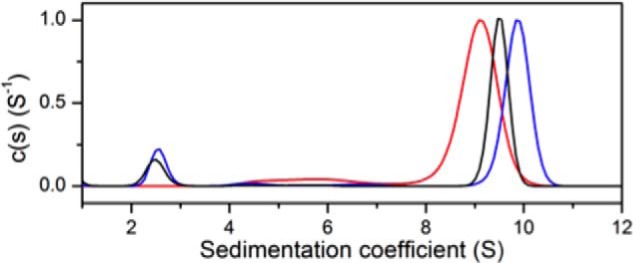
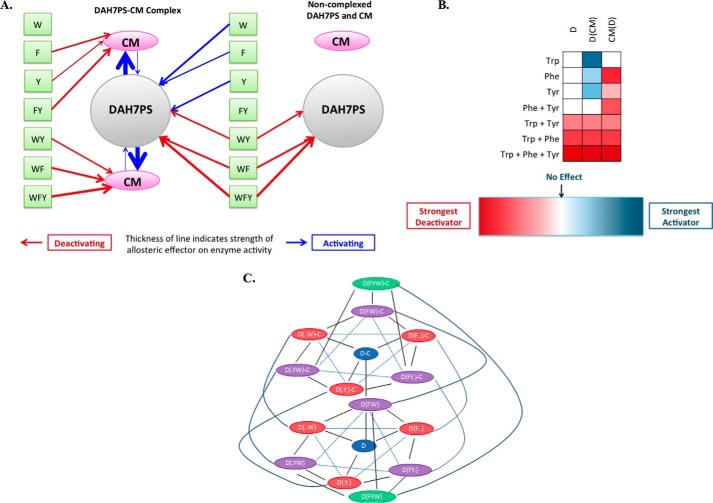
Allostery, where remote ligand binding alters protein function, is essential for the control of metabolism. Here, we have identified a highly sophisticated allosteric response that allows complex control of the pathway for aromatic amino acid biosynthesis in the pathogen Mycobacterium tuberculosis. This response is mediated by an enzyme complex formed by two pathway enzymes: chorismate mutase (CM) and 3-deoxy-d-arabino-heptulosonate 7-phosphate synthase (DAH7PS). Whereas both enzymes are active in isolation, the catalytic activity of both enzymes is enhanced, and in particular that of the much smaller CM is greatly enhanced (by 120-fold), by formation of a hetero-octameric complex between CM and DAH7PS. Moreover, on complex formation M. tuberculosis CM, which has no allosteric response on its own, acquires allosteric behavior to facilitate its own regulatory needs by directly appropriating and partly reconfiguring the allosteric machinery that provides a synergistic allosteric response in DAH7PS. Kinetic and analytical ultracentrifugation experiments demonstrate that allosteric binding of phenylalanine specifically promotes hetero-octameric complex dissociation, with concomitant reduction of CM activity. Together, DAH7PS and CM from M. tuberculosis provide exquisite control of aromatic amino acid biosynthesis, not only controlling flux into the start of the pathway, but also directing the pathway intermediate chorismate into either Phe/Tyr or Trp biosynthesis.

Keywords: 3-deoxy-d-arabino-heptulosonate 7-phosphate synthase; Mycobacterium tuberculosis; TB; allosteric regulation; chorismate mutase; enzyme catalysis; oligomer; protein complex; protein-protein interaction; shikimate.


Figures

FIGURE 1.
FIGURE 1.
Aromatic amino acid biosynthesis.
FIGURE 2.
FIGURE 2.
MtuCM-MtuDAH7PS hetero-octameric complex and MtuDAH7PS allosteric binding sites. A, complex (Protein Data Bank code 2W19) of MtuDAH7PS in blue (Phe/Tyr binding sites in red, and Trp binding site in yellow) with MtuCM in magenta. B, MtuDAH7PS (Protein Data Bank code 3KGF) showing Phe/Tyr and Trp binding sites (ligands shown as orange spheres, and active site manganese shown as green spheres) provided by extra subdomains at the N terminus (red) or C terminus (yellow) of the catalytic (β/α)8 barrel (blue). C, Phe binding site (Protein Data Bank code 3KGF). D, Trp binding site (Protein Data Bank code 3KGF). E, Tyr binding site (Protein Data Bank code 2YPP). Whereas there are four Phe and Trp binding sites per tetramer, there are only two Tyr-binding sites per tetramer.
FIGURE 3.
FIGURE 3.
Sedimentation coefficient distribution of species. Shown are MtuDAH7PS (top panel) and a 4:1 mixture (molar ratio) of MtuCM-MtuDAH7PSWT (bottom panel). MtuDAH7PSWT was present at concentrations of 0.2 mg·ml−1 (red), 0.4 mg·ml−1 (blue), or 0.6 mg·ml−1 (black). Note that the molar extinction coefficient of MtuCM is 1,490 cm−1·mol−1, whereas that of MtuDAH7PSWT is 41,160 cm−1·mol−1 at a wavelength of 280 nm.
FIGURE 4.
FIGURE 4.
Sedimentation equilibrium experiments for MtuDAH7PSWT and the MtuDAH7PS-MtuCM complex. The experiments were performed at 6,000 (black), 8,000 (red), 10,000 (green), and 12,000 rpm (blue). A–C represent the data for the MtuDAH7PSWT at concentrations of 0.2, 0.4, and 0.6 mg·ml−1, respectively. D–F represent the data for the complex with the MtuDAH7PSWT concentrations of 0.2, 0.4, and 0.6 mg·ml−1, respectively, with a 4-fold molar excess of MtuCM at each concentration. The experimental data are represented using solid circles, and the fits using the species analysis model are shown as solid curves.
FIGURE 5.
FIGURE 5.
Inhibition of MtuCM and MtuDAH7PS activity by aromatic amino acids. A, effect of aromatic amino acids on MtuCM activity alone (3 μm MtuCM, 150 μm chorismate) (purple) and in complex with MtuDAH7PS (60 nm MtuCM) at chorismate concentrations of 150 μm (pink) or 25 μm (gray). B, effect of aromatic amino acids on MtuDAH7PSWT activity (40 nm MtuDAH7PS) either in complex with MtuCM in a 1:10, a 1:50 ratio to MtuDAH7PS (red), or alone (blue). The effect of changing the concentration of each ligand present to 100 μm (orange) (from 200 μm) is also shown. C, effect of aromatic amino acids on MtuCM activity (60 nm MtuCM) in the presence of MtuDAH7PSWT (gray), MtuDAH7PSR171A (red), or MtuDAH7PSR256A (green). D, effect of increasing aromatic amino acid concentration on MtuCM (60 nm) activity in complex with MtuDAH7PS. Chorismate concentrations were held at either 150 μm (solid lines) or 25 μm (dashed lines). For complexes with MtuDAH7PS, CM activity was determined with a 1:10 ratio for CM to DAH7PS, and DAH7PS activity was determined with a 10:1 ratio of CM to DAH7PS. The ligands are denoted by single-letter amino acid codes (W, Trp; F, Phe; and Y, Tyr) with each individual letter also representing a concentration of 200 μm. Error bars represent the estimated standard deviation of triplicate measurements.
FIGURE 6.
FIGURE 6.
A, response of MtuCM catalytic efficiency (kcat/Km) to increasing concentrations of MtuDAH7PSWT in the absence of ligand (black dots) or in the presence of Phe (200 μm) (pink dots), Trp (200 μm) (purple dots), and Tyr (200 μm) (green dots). MtuCM concentration was held constant at a value of 10 nm. Error bars represent the spread of duplicate independent Michaelis-Menten kinetic measurements. B, complex formation between MtuCM and MtuDAH7PSWT, MtuDAH7PSR171A, and MtuDAH7PSR256A. Shown are the results of native PAGE (Amersham Biosciences ECL, using 50 mm Tris, 175 mm alanine running buffer, pH 9.2) of MtuDAH7PS, MtuDAH7PSR171A, and MtuDAH7PSR256A alone (lanes 1, 4, and 7, respectively), with 4-fold molar excess of MtuCM (lanes 2, 5, and 8, respectively), and with 4-fold molar excess of MtuCM and Phe (1 mm) (lanes 3, 6, and 9, respectively). Lanes marked M show the native molecular mass markers of stated masses.
FIGURE 7.
FIGURE 7.
Normalized sedimentation coefficient distribution of species. Red, wild-type MtuDAH7PS; blue, MtuCM-MtuDAH7PS (molar ratio 4:1); black, MtuCM-MtuDAH7PS (molar ratio 4:1) in presence of 100 μm Phe. The concentration of MtuDAH7PSWT was 0.4 mg·ml−1 in all three experiments.
FIGURE 8.
FIGURE 8.
The complex allostery of the MtuCM-MtuDAH7PS complex. A, summary of interactions which alter DAH7PS or CM activity of the MtuCM-MtuDAH7P complex or the enzymes without their complex partner present. Inhibitory effects are shown in red, activating effects in blue, and the thickness of the lines indicates qualitatively the magnitude of the effect. B, the expanded allosteric response of the MtuCM-MtuDAH7PS complex. C, linkage diagram showing the complexity of allosteric regulation in MtuDAH7PS, MtuCM, and MtuCM-MtuDAH7PS. In the interests of clarity, the additional linkages associated with the homotropic allosteric effector E4P are not shown.

References

    1. Nussinov R., Jang H. (2014) Dynamic multiprotein assemblies shape the spatial structure of cell signaling. Prog. Biophys. Mol. Biol. 116, 158–164 - PMC - PubMed
    1. Motlagh H. N., Wrabl J. O., Li J., Hilser V. J. (2014) The ensemble nature of allostery. Nature 508, 331–339 - PMC - PubMed
    1. Gabizon R., Friedler A. (2014) Allosteric modulation of protein oligomerization: an emerging approach to drug design. Front. Chem. 2, 1–15 - PMC - PubMed
    1. Perica T., Marsh J. A., Sousa F. L., Natan E., Colwell L. J., Ahnert S. E., Teichmann S. A. (2012) The emergence of protein complexes: quaternary structure, dynamics and allostery. Biochem. Soc. Trans. 40, 475–491 - PubMed
    1. McConkey G. A., Pinney J. W., Westhead D. R., Plueckhahn K., Fitzpatrick T. B., Macheroux P., Kappes B. (2004) Annotating the Plasmodium genome and the enigma of the shikimate pathway. Trends Parasitol. 20, 60–65 - PubMed

Publication types

MeSH terms

Substances