

Test-retest reliability of freesurfer measurements within and between sites: Effects of visual approval process
- PMID: 26033168
- PMCID: PMC4545736
- DOI: 10.1002/hbm.22856
Test-retest reliability of freesurfer measurements within and between sites: Effects of visual approval process
Abstract
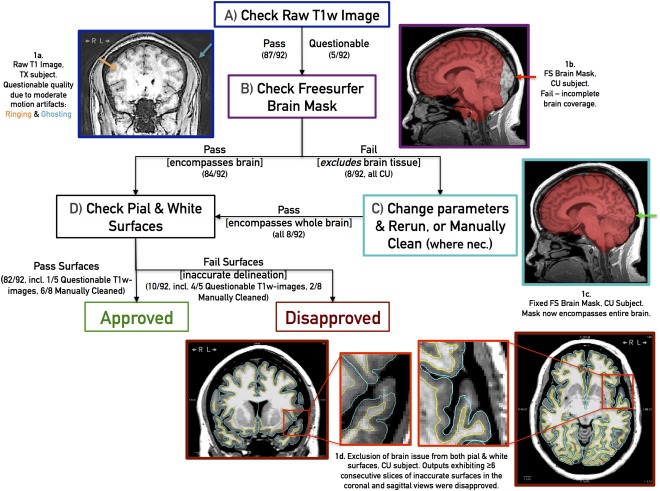
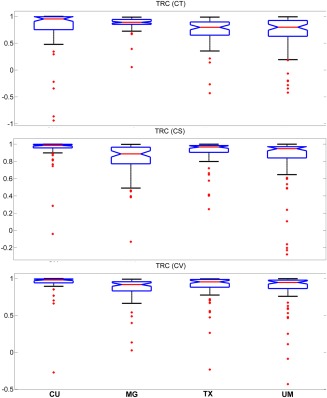
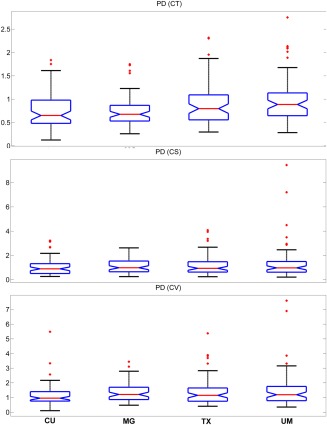
In the last decade, many studies have used automated processes to analyze magnetic resonance imaging (MRI) data such as cortical thickness, which is one indicator of neuronal health. Due to the convenience of image processing software (e.g., FreeSurfer), standard practice is to rely on automated results without performing visual inspection of intermediate processing. In this work, structural MRIs of 40 healthy controls who were scanned twice were used to determine the test-retest reliability of FreeSurfer-derived cortical measures in four groups of subjects-those 25 that passed visual inspection (approved), those 15 that failed visual inspection (disapproved), a combined group, and a subset of 10 subjects (Travel) whose test and retest scans occurred at different sites. Test-retest correlation (TRC), intraclass correlation coefficient (ICC), and percent difference (PD) were used to measure the reliability in the Destrieux and Desikan-Killiany (DK) atlases. In the approved subjects, reliability of cortical thickness/surface area/volume (DK atlas only) were: TRC (0.82/0.88/0.88), ICC (0.81/0.87/0.88), PD (0.86/1.19/1.39), which represent a significant improvement over these measures when disapproved subjects are included. Travel subjects' results show that cortical thickness reliability is more sensitive to site differences than the cortical surface area and volume. To determine the effect of visual inspection on sample size required for studies of MRI-derived cortical thickness, the number of subjects required to show group differences was calculated. Significant differences observed across imaging sites, between visually approved/disapproved subjects, and across regions with different sizes suggest that these measures should be used with caution.
Keywords: FreeSurfer; cerebral cortical surface area; cerebral cortical thickness; cerebral cortical volume; multisite MRI; test-retest reliability.
© 2015 Wiley Periodicals, Inc.
Figures

References
-
- Ardekani BA, Guckemus S, Bachman A, Hoptman MJ, Wojtaszek M, Nierenberg J (2005): Quantitative comparison of algorithms for inter‐subject registration of 3D volumetric brain MRI scans. J Neurosci Methods 142:67–76. - PubMed
-
- Bellon E, Haacke E, Coleman P, Sacco D, Steiger D, Gangarosa R (1986): MR artifacts: A review. Am J Roentgenol 147:1271–1281. - PubMed
-
- Bremner JD, Vythilingam M, Vermetten E, Nazeer A, Adil J, Khan S, Staib LH, Charney DS (2002): Reduced volume of orbitofrontal cortex in major depression. Biol Psychiatry 51:273–279. - PubMed
-
- Colloby SJ, Firbank MJ, Vasudev A, Parry SW, Thomas AJ, O'Brien JT (2011): Cortical thickness and VBM‐DARTEL in late‐life depression. J Affect Disorders 133:158–164. - PubMed
Publication types
MeSH terms
Grants and funding
LinkOut - more resources
Full Text Sources
Other Literature Sources
Medical
