. 2015 Aug;172(16):4173-88.
doi: 10.1111/bph.13203. Epub 2015 Jul 6.

The Akt inhibitor, triciribine, ameliorates chronic hypoxia-induced vascular pruning and TGFβ-induced pulmonary fibrosis

Affiliations

The Akt inhibitor, triciribine, ameliorates chronic hypoxia-induced vascular pruning and TGFβ-induced pulmonary fibrosis

Maha Abdalla et al. Br J Pharmacol. 2015 Aug.

Abstract

Background and purpose: Interstitial lung disease accounts for a group of chronic and progressive disorders associated with severe pulmonary vascular remodelling, peripheral vascular rarefaction and fibrosis, thus limiting lung function. We have previously shown that Akt is necessary for myofibroblast differentiation, a critical event in organ fibrosis. However, the contributory role of the Akt-mTOR pathway in interstitial lung disease and the therapeutic benefits of targeting Akt and mTOR remain unclear.

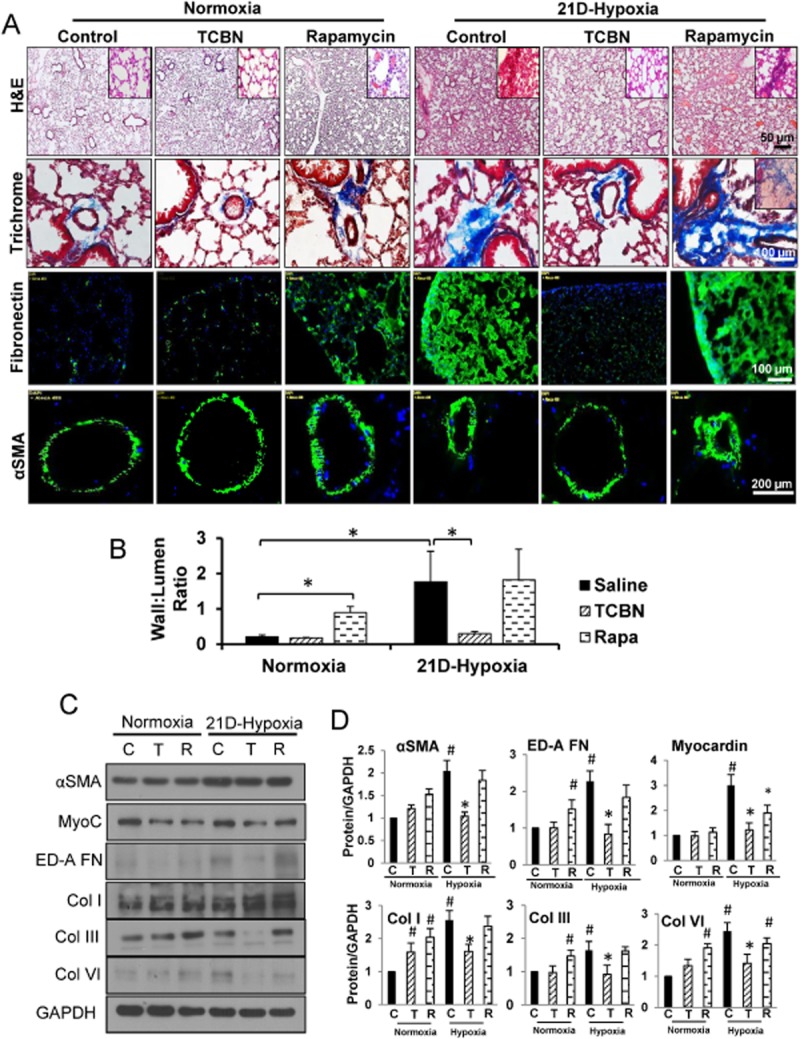
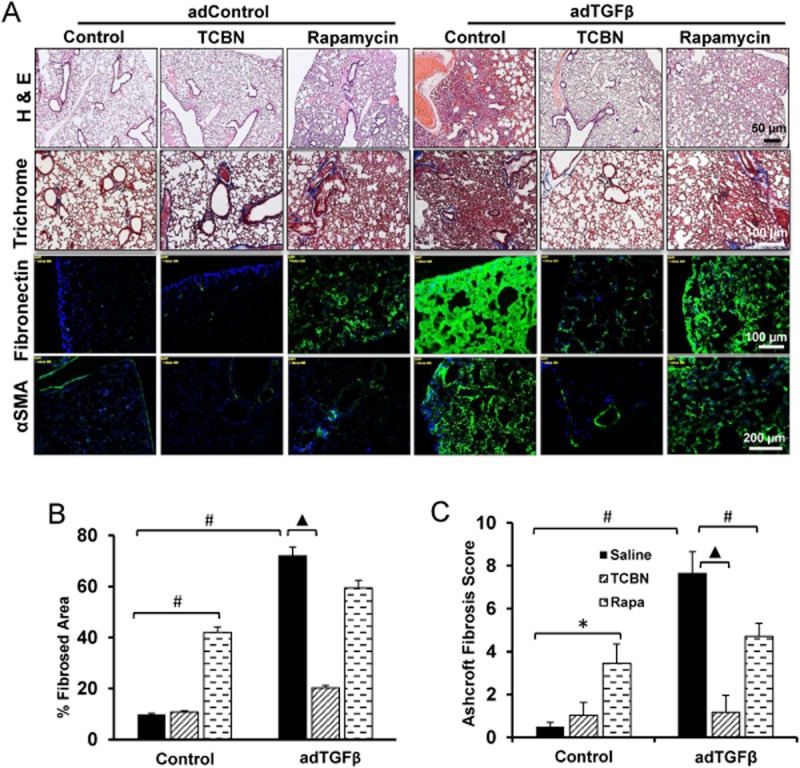
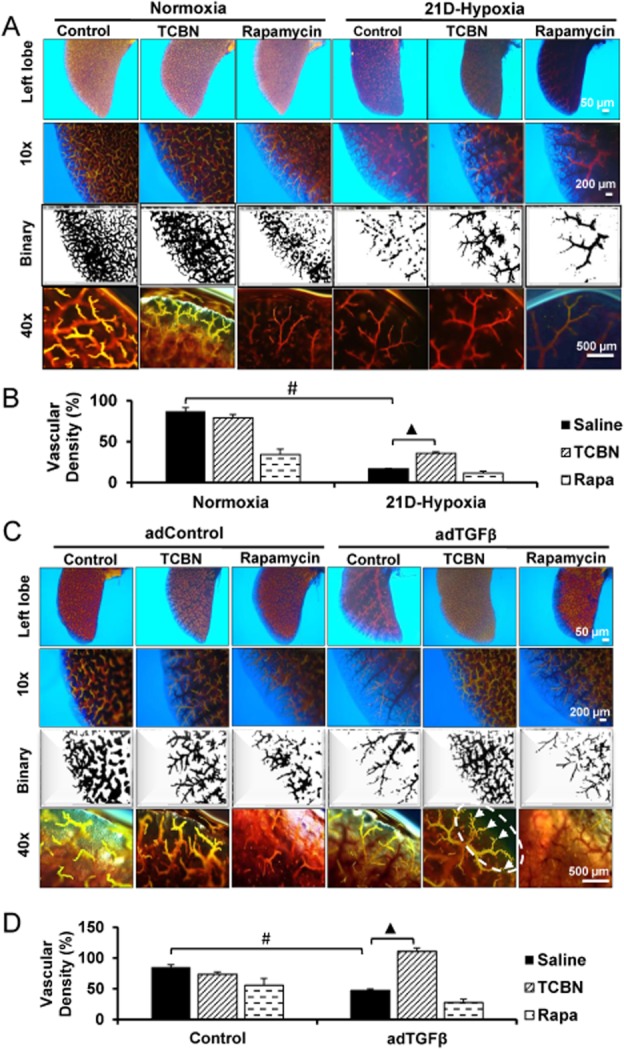
Experimental approach: We investigated the role of the Akt-mTOR pathway and its downstream molecular mechanisms in chronic hypoxia- and TGFβ-induced pulmonary vascular pruning and fibrosis in mice. We also determined the therapeutic benefits of the Akt inhibitor triciribine and the mTOR inhibitor rapamycin for the treatment of pulmonary fibrosis in mice.

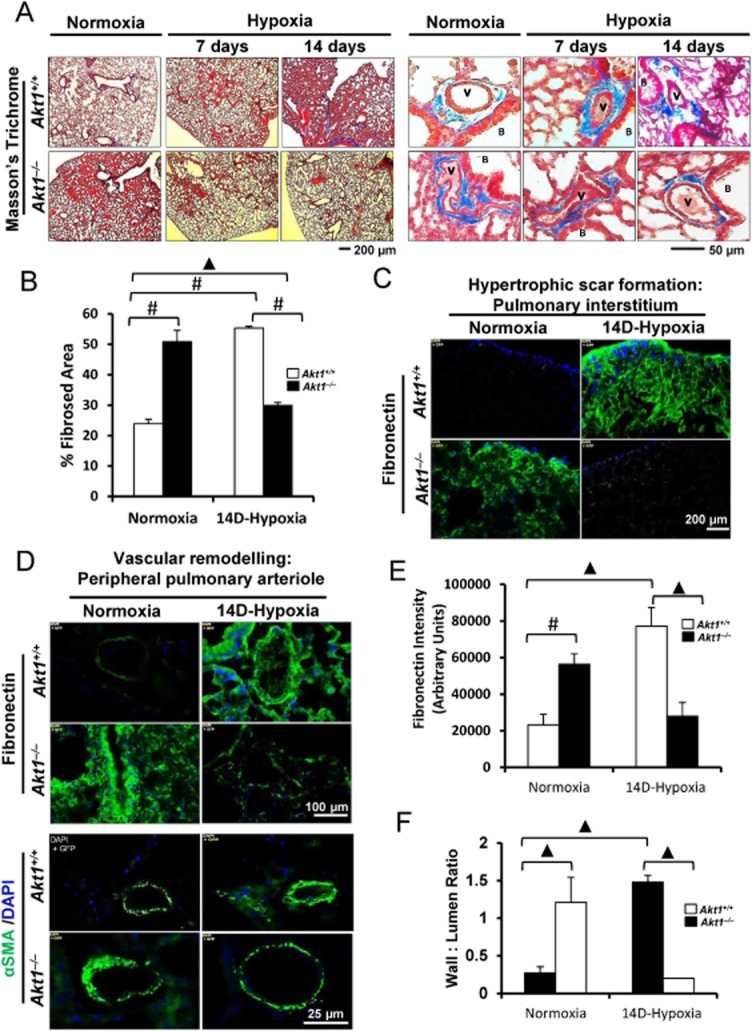
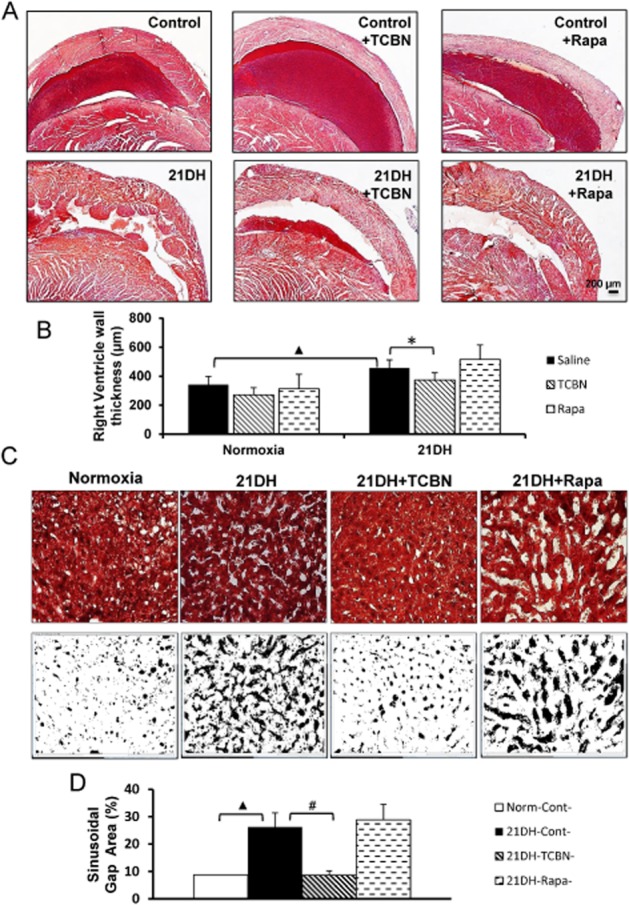
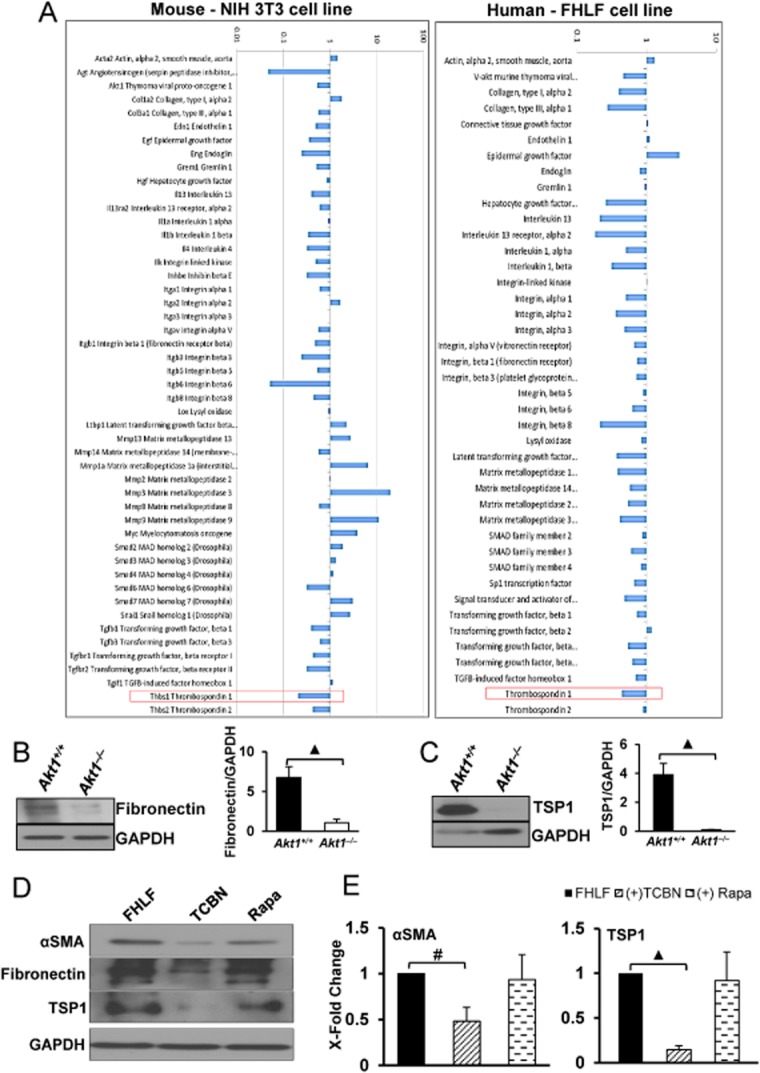
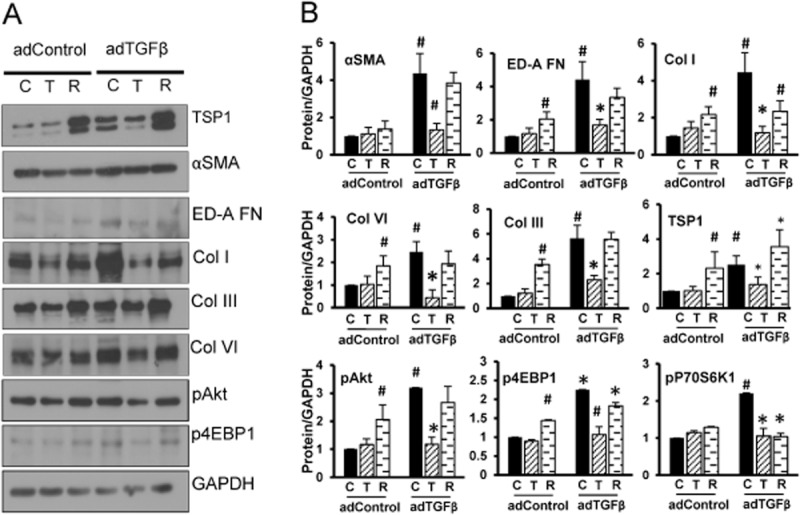
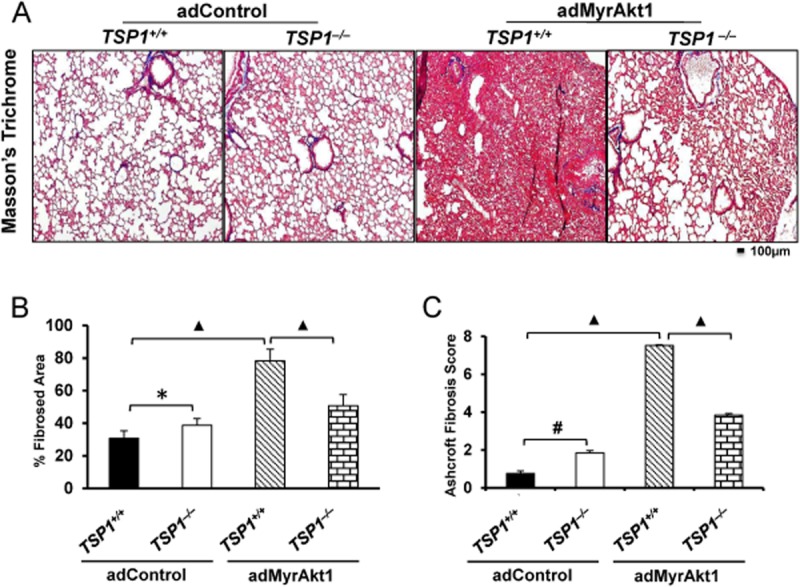
Key results: Akt1(-) (/) (-) mice were protected from chronic hypoxia-induced peripheral vascular pruning. In contrast, hyperactivation of Akt1 induced focal fibrosis similar to TGFβ-induced fibrosis. Pharmacological inhibition of Akt, but not the Akt substrate mTOR, inhibited hypoxia- and TGFβ-induced pulmonary vascular rarefaction and fibrosis. Mechanistically, we found that Akt1 modulates pulmonary remodelling via regulation of thrombospondin1 (TSP1) expression. Hypoxic Akt1(-) (/) (-) mice lungs expressed less TSP1. Moreover, TSP1(-) (/) (-) mice were resistant to adMyrAkt1-induced pulmonary fibrosis.

Conclusions and implications: Our study identified Akt1 as a novel target for the treatment of interstitial lung disease and provides preclinical data on the potential benefits of the Akt inhibitor triciribine for the treatment of interstitial lung disease.


Figures

Figure 1
Figure 1
Akt1 deficiency protects against hypoxia-induced pulmonary remodelling. (A) Masson's trichrome stained section of the pulmonary interstitium (left) and peripheral pulmonary arterioles (right) of Akt1+/+ and Akt1/ mice subjected to normoxia or chronic hypoxia for 7 and 14 days (n = 3–5 mice/group). (B) Histogram showing quantification of the fibrosed area in Akt1+/+ and Akt1/ mice lungs after 14 day hypoxia compared with normoxia. (C) Immunostaining of frozen sections of 14 day hypoxia and normoxia Akt1+/+ and Akt1/ mice lungs showing fibronectin expression in the interstitium. (D) Fibronectin and αSMA immunofluorescence staining in and around small pulmonary arteries of normoxic and 14d-hypoxic Akt1+/+ and Akt1/ mice. (E) Histogram showing reduced fibronectin expression in Akt1/ mice hypoxic lung sections compared with Akt1+/+ mice lungs (n = 4–5 mice/group). (F) Histogram showing vascular wall to lumen ratio in Akt1+/+ and Akt1/ mice lung hypoxic sections measured from αSMA immunofluorescence (n = 3–5 mice/group). V, vasculature; B, bronchiole. #P < 0.01, P < 0.001.
Figure 2
Figure 2
TCBN reverses hypoxia-induced pulmonary fibrosis and vascular remodelling in vivo. (A) H&E staining, Masson's trichrome staining, fibronectin and αSMA immunofluorescence staining of lung sections subjected for normoxia and 21 day chronic hypoxia. (B) Histogram showing vascular wall to lumen ratio (n = 6–8 mice/group). (C) Western analysis of αSMA and its transcription factors SRF and myocardin, ECM proteins including ED-A-FN, collagen types I, III and VI in TCBN, and rapamycin-treated lungs compared with vehicle-treated lungs after 21 days of hypoxia. (D) Histograms showing the densitometry analysis of Western protein bands showing changes in the expression of αSMA, SRF, myocardin, ED-A-FN, collagen types I, III and VI in control, TCBN and rapamycin-treated 21 day hypoxic lungs. *P < 0.05, #P < 0.01 (n = 6–8 mice/group).
Figure 3
Figure 3
TCBN ameliorates adTGFβ-induced pulmonary fibrosis in vivo. (A) H&E staining, Masson's trichrome staining, fibronectin and αSMA immunofluorescence staining of lung sections subjected for adControl and adTGFβ treatments. (B) Histogram showing quantification of the fibrosed area in adControl and adTGFβ-expressing mice lungs (n = 6–8 mice/group). (C) Histogram showing Aschroft fibrosis score in adControl and adTGFβ-expressing mice lungs (n = 6–8 mice/group). *P < 0.05, #P < 0.01, P < 0.001.
Figure 4
Figure 4
TCBN reverses hypoxia- and adTGFβ-induced vascular rarefaction. (A) Representative images showing vascular branching of the left lobe after Microfil casting of mice subjected to normoxia or chronic hypoxia and treated with saline, TCBN or rapamycin. (B) Histogram showing vascular density (%) in mouse lungs subjected to normoxia or chronic hypoxia and treated with saline, TCBN or rapamycin, and calculated using ImageJ software (n = 3–5 mice/group). (C) Representative images showing vascular branching of the left lobe after Microfil casting of mice subjected to adControl or adTGFβ, and treated with saline, TCBN or rapamycin. Arrows indicate increase in microvascular branching in TCBN-treated group. (D) Histogram showing vascular density (%) in mouse lungs subjected to adControl or adTGFβ treated with saline, TCBN or rapamycin, and calculated using ImageJ software (n = 3–5 mice/group). #P < 0.01, P < 0.001. Scale bar in order 500, 200 and 50 μm.
Figure 5
Figure 5
TCBN inhibits hypoxia-induced right ventricular remodelling and hepatic injury. (A) Images of Masson's trichrome stained cross sections of the right ventricle from control, chronic hypoxic, hypoxic treated with TCBN and hypoxic treated with rapamycin hearts. (B) Histogram showing quantification of right ventricular wall thickness showing the effect of TCBN and rapamycin on compensatory ventricular wall remodelling following hypoxia (n = 6–8 mice/group). (C) Pictures of Masson's trichrome stained liver sections and binary images (using ImageJ software). (D) Histogram showing quantification of per cent sinusoidal gap area as measured using ImageJ software from binary images (n = 6–8 mice/group). *P < 0.05, #P < 0.01, P < 0.001.
Figure 6
Figure 6
TSP1 expression is decreased in Akt1-deficient NIH 3T3, IPF fibroblasts and 14 day hypoxic mice. (A) Gene expression profiles of NIH 3T3 and IPF fibroblasts (FHLFs) expressing DN-Akt1 (dominant negative, inactive Akt1) (n = 3). (B and C) Western blot image and histogram showing total fibronectin and TSP1 expression levels normalized to GAPDH levels in 14 day hypoxic Akt1+/+ and Akt1/ mice lungs (n = 3–5 per group). (D) Images of Western blots showing the effect of TCBN and rapamycin on the expression of αSMA and TSP1 expression in FHLFs. (E) Histogram showing densitometry analysis of the Western blot bands indicating changes in the expression levels of αSMA and TSP1, normalized to GAPDH after treatment with TCBN and rapamycin in FHLFs (n = 3). #P < 0.01, P < 0.001.
Figure 7
Figure 7
Targeting Akt, not mTOR, modulates expression of TSP1, αSMA and ECM proteins in the mice lungs with adTGFβ expression. (A) Western blot images of adControl and adTGFβ expressing lung tissue lysates showing the changes in expression of TSP1, αSMA, ED-A-FN, collagens (types I, III and VI), and phosphorylated Akt and 4E-BP1. (B) Densitometry analysis of Western blot bands of adControl and adTGFβ-expressing lung tissue lysates showing the changes in expression of TSP1, αSMA, ED-A-FN, collagens (types I, III and VI) and phosphorylated Akt and 4E-BP1 (n = 4). *P < 0.05, #P < 0.01.
Figure 8
Figure 8
TSP1−/− mice are protected from adMyrAkt1-induced pulmonary fibrosis. (A) Masson's trichrome staining of WT and TSP1−/− mouse lung harvested 14 days after i.t. adenovirus gene transfer of control vector or adMyrAkt1 (constitutive active Akt1) (n = 3 mice/group). (B and C) Per cent fibrosed area quantified using ImageJ software, and Ashcroft fibrosis score of the degree of fibrosis in WT and TSP1−/− mice subjected to control vector or adMyr-Akt1 respectively. *P < 0.05, #P < 0.01, P < 0.001.

References

    1. Abdalla M, Goc A, Segar L, Somanath PR. Akt1 mediates α-smooth muscle actin expression and myofibroblast differentiation via myocardin and serum response factor. J Biol Chem. 2013;288:33483–33493. - PMC - PubMed
    1. Alexander SPH, Benson HE, Faccenda E, Pawson AJ, Sharman JL, Spedding M, et al. CGTP Collaborators. The Concise Guide to PHARMACOLOGY 2013/14: Enzymes. Br J Pharmacol. 2013;170:1797–1867. - PMC - PubMed
    1. Ashcroft T, Simpson JM, Timbrell V. Simple method of estimating severity of pulmonary fibrosis on a numerical scale. J Clin Pathol. 1988;41:467–470. - PMC - PubMed
    1. Barman SA, Chen F, Su Y, Dimitropoulou C, Wang Y, Catravas JD, et al. Nadph oxidase 4 is expressed in pulmonary artery adventitia and contributes to hypertensive vascular remodeling. Arterioscler Thromb Vasc Biol. 2014;34:1704–1715. - PMC - PubMed
    1. Breuleux M, Klopfenstein M, Stephan C, Doughty CA, Barys L, Maira SM, et al. Increased AKT S473 phosphorylation after mTORC1 inhibition is rictor dependent and does not predict tumor cell response to PI3K/mTOR inhibition. Mol Cancer Ther. 2009;8:742–753. - PMC - PubMed

Publication types

MeSH terms