

Nutrigenomics analysis reveals that copper deficiency and dietary sucrose up-regulate inflammation, fibrosis and lipogenic pathways in a mature rat model of nonalcoholic fatty liver disease
- PMID: 26033743
- PMCID: PMC4578989
- DOI: 10.1016/j.jnutbio.2015.04.009
Nutrigenomics analysis reveals that copper deficiency and dietary sucrose up-regulate inflammation, fibrosis and lipogenic pathways in a mature rat model of nonalcoholic fatty liver disease
Abstract
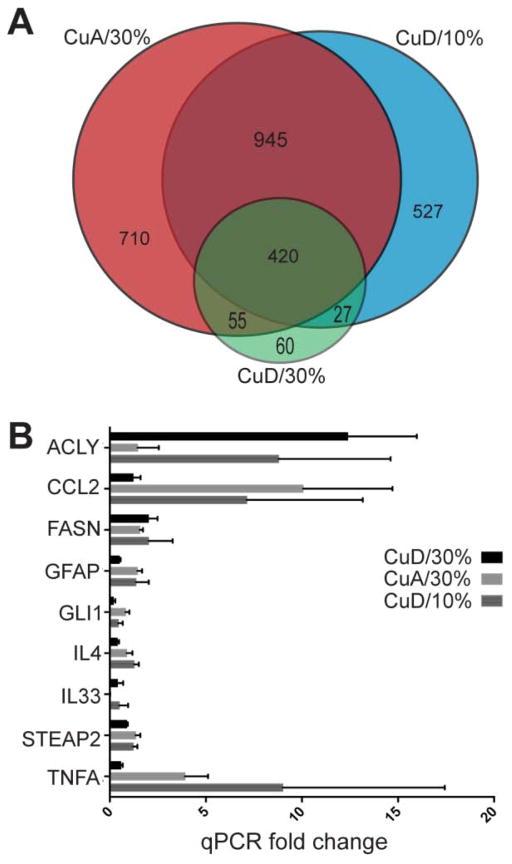
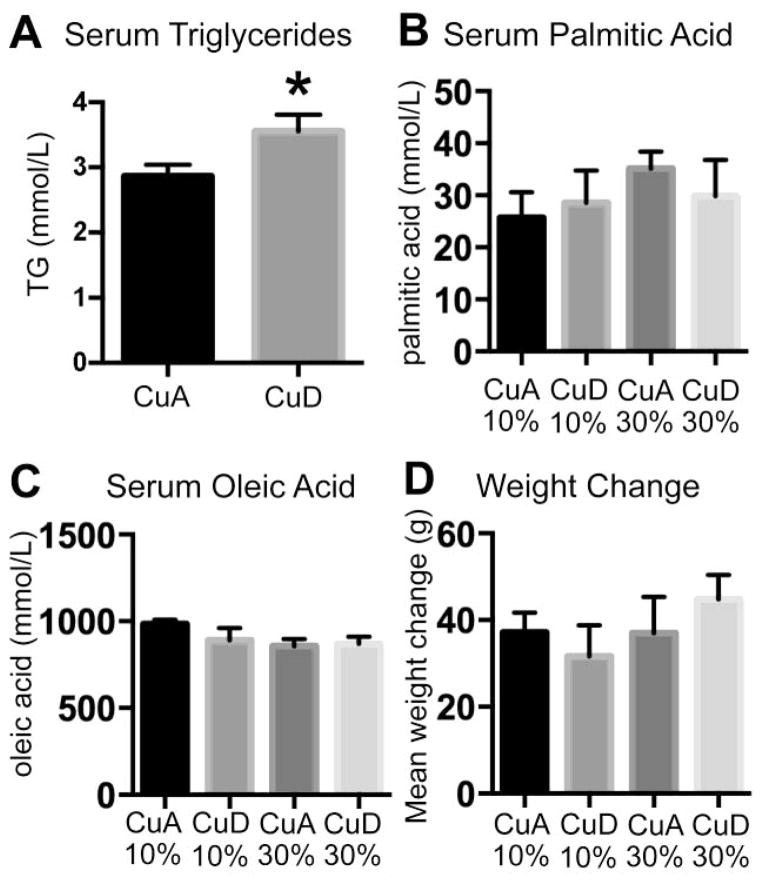
Nonalcoholic fatty liver disease (NAFLD) prevalence is increasing worldwide, with the affected US population estimated near 30%. Diet is a recognized risk factor in the NAFLD spectrum, which includes nonalcoholic steatohepatitis (NASH) and fibrosis. Low hepatic copper (Cu) was recently linked to clinical NAFLD/NASH severity. Simple sugar consumption including sucrose and fructose is implicated in NAFLD, while consumption of these macronutrients also decreases liver Cu levels. Though dietary sugar and low Cu are implicated in NAFLD, transcript-level responses that connect diet and pathology are not established. We have developed a mature rat model of NAFLD induced by dietary Cu deficiency, human-relevant high sucrose intake (30% w/w) or both factors in combination. Compared to the control diet with adequate Cu and 10% (w/w) sucrose, rats fed either high-sucrose or low-Cu diet had increased hepatic expression of genes involved in inflammation and fibrogenesis, including hepatic stellate cell activation, while the combination of diet factors also increased ATP citrate lyase and fatty acid synthase gene transcription (fold change > 2, P < 0.02). Low dietary Cu decreased hepatic and serum Cu (P ≤ 0.05), promoted lipid peroxidation and induced NAFLD-like histopathology, while the combined factors also induced fasting hepatic insulin resistance and liver damage. Neither low Cu nor 30% sucrose in the diet led to enhanced weight gain. Taken together, transcript profiles, histological and biochemical data indicate that low Cu and high sucrose promote hepatic gene expression and physiological responses associated with NAFLD and NASH, even in the absence of obesity or severe steatosis.
Keywords: Copper; Fibrosis; Inflammation; Liver; Nonalcoholic steatohepatitis; Steatosis.
Copyright © 2015 The Authors. Published by Elsevier Inc. All rights reserved.
Conflict of interest statement
Figures


References
-
- Torres DM, Harrison Sa. Diagnosis and Therapy of Nonalcoholic Steatohepatitis. Gastroenterology. 2008;134:1682–98. - PubMed
-
- Ogden CL, Carroll MD, Kit BK, Flegal KM. Prevalence of obesity in the United States, 2009–2010. NCHS Data Brief. 2012:1–8. - PubMed
-
- Eckel RH, Alberti KGMM, Grundy SM, Zimmet PZ. The metabolic syndrome. Lancet. 2005;365:1415–28. - PubMed
Publication types
MeSH terms
Substances
Grants and funding
LinkOut - more resources
Full Text Sources
Other Literature Sources
Medical
Molecular Biology Databases
