. 2016 Jul;65(7):1151-64.
doi: 10.1136/gutjnl-2014-308270. Epub 2015 Jun 1.

BCL-3 expression promotes colorectal tumorigenesis through activation of AKT signalling

Affiliations

BCL-3 expression promotes colorectal tumorigenesis through activation of AKT signalling

Bettina C Urban et al. Gut. 2016 Jul.

Abstract

Objective: Colorectal cancer remains the fourth most common cause of cancer-related mortality worldwide. Here we investigate the role of nuclear factor-κB (NF-κB) co-factor B-cell CLL/lymphoma 3 (BCL-3) in promoting colorectal tumour cell survival.

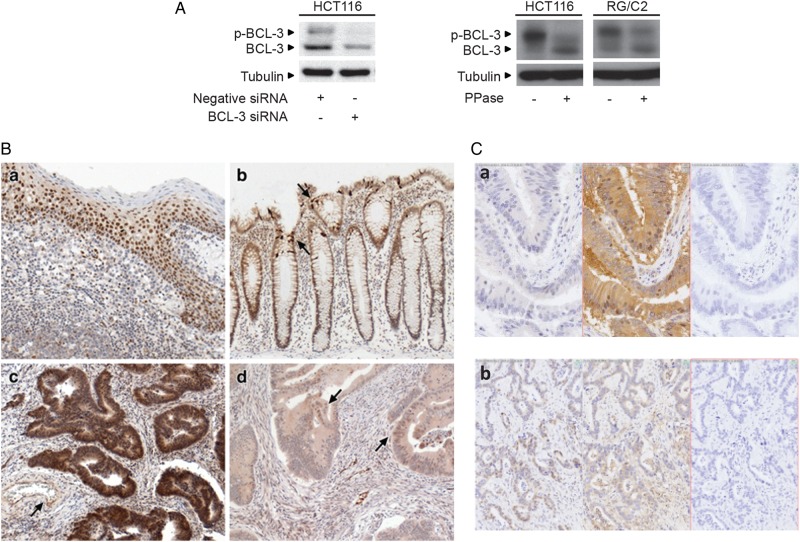
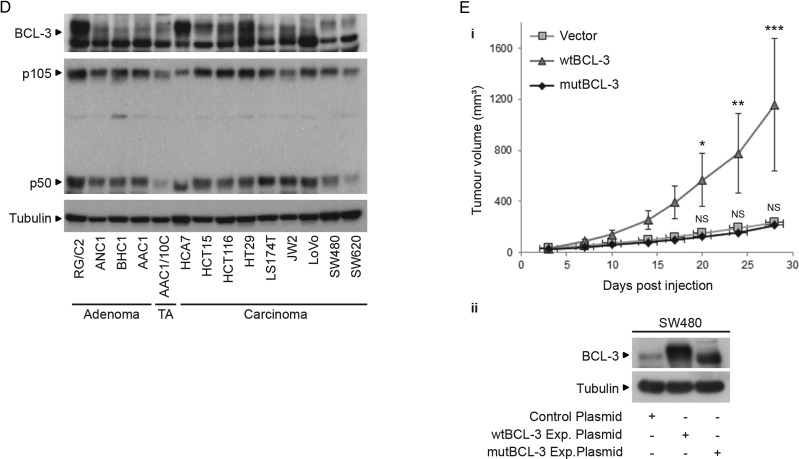
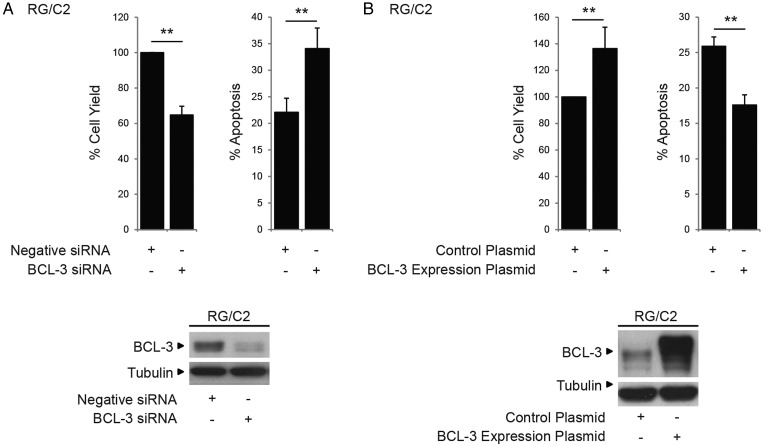
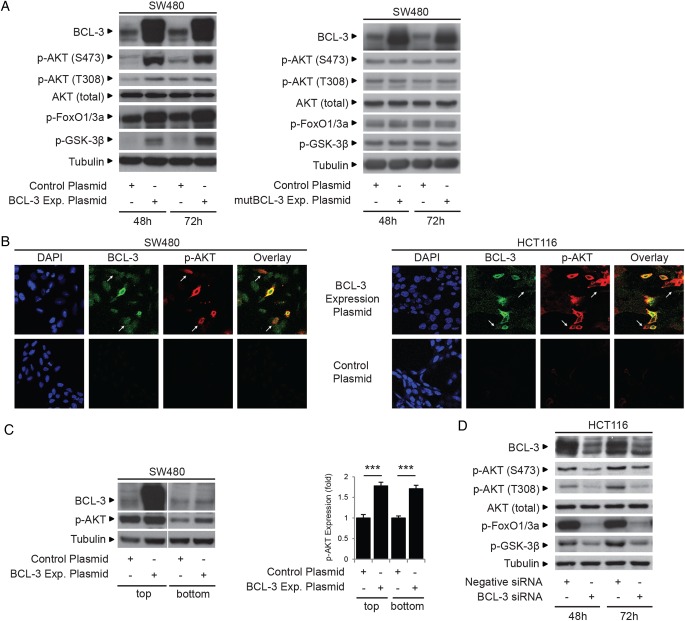
Design: Immunohistochemistry was carried out on 47 tumour samples and normal tissue from resection margins. The role of BCL-3/NF-κB complexes on cell growth was studied in vivo and in vitro using an siRNA approach and exogenous BCL-3 expression in colorectal adenoma and carcinoma cells. The question whether BCL-3 activated the AKT/protein kinase B (PKB) pathway in colorectal tumour cells was addressed by western blotting and confocal microscopy, and the ability of 5-aminosalicylic acid (5-ASA) to suppress BCL-3 expression was also investigated.

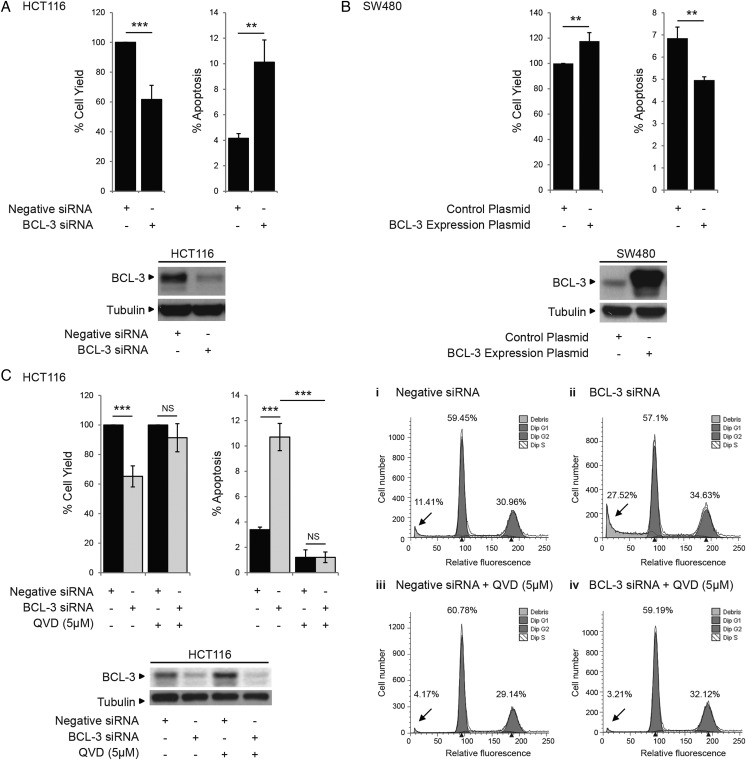
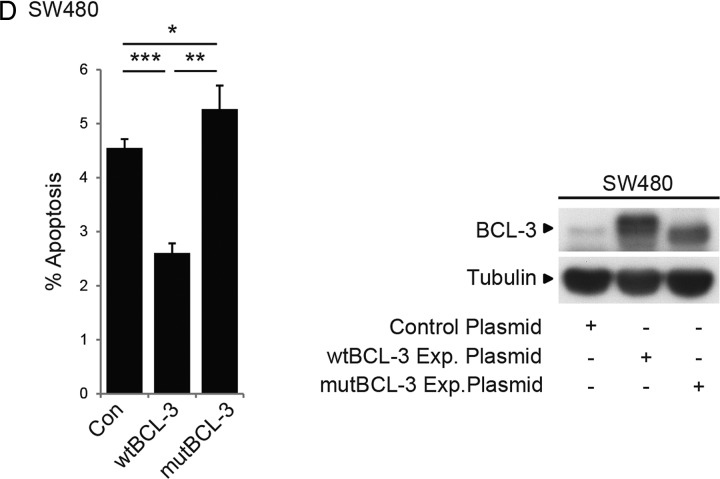
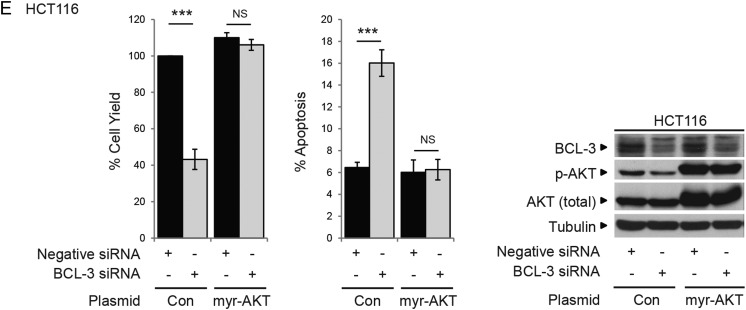
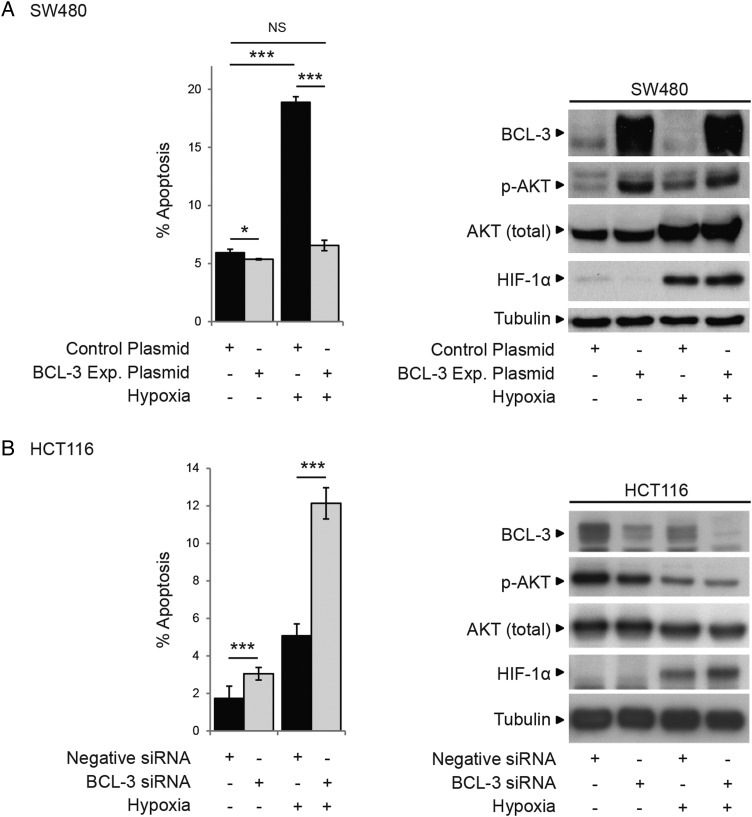
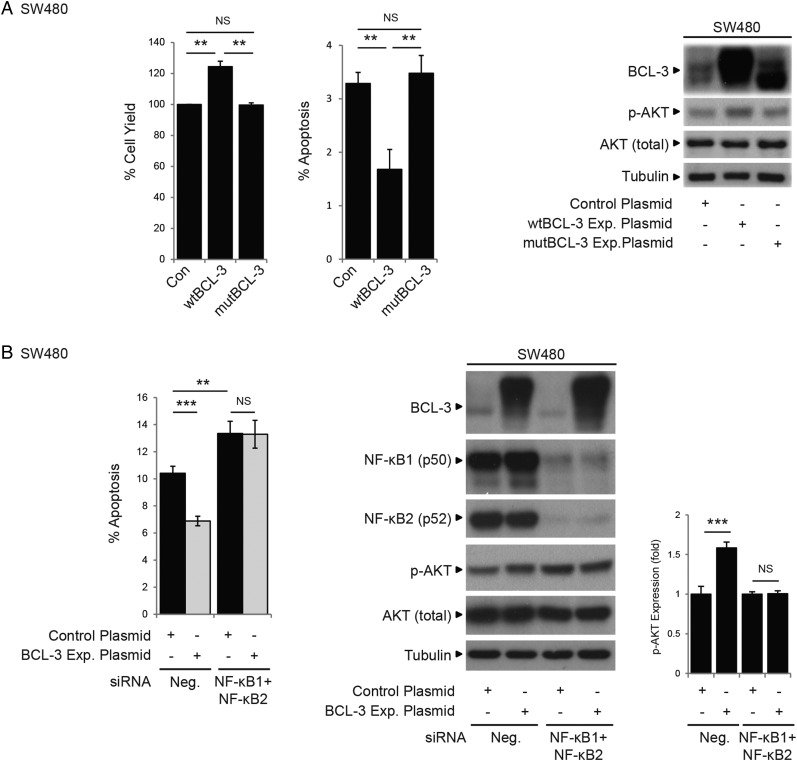
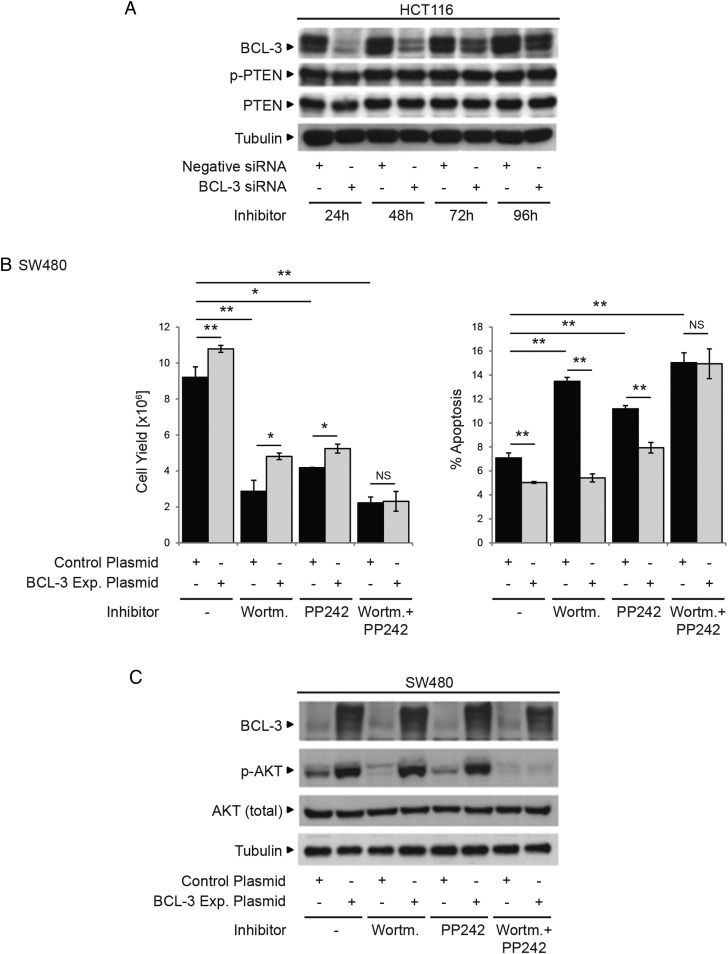
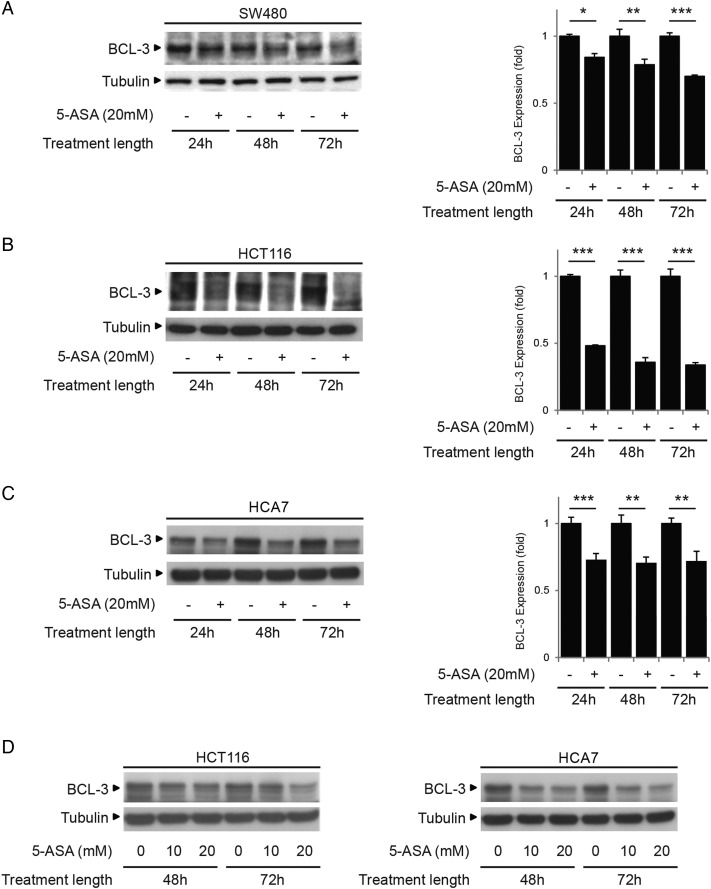
Results: We report increased BCL-3 expression in human colorectal cancers and demonstrate that BCL-3 expression promotes tumour cell survival in vitro and tumour growth in mouse xenografts in vivo, dependent on interaction with NF-κB p50 or p52 homodimers. We show that BCL-3 promotes cell survival under conditions relevant to the tumour microenvironment, protecting both colorectal adenoma and carcinoma cells from apoptosis via activation of the AKT survival pathway: AKT activation is mediated via both PI3K and mammalian target of rapamycin (mTOR) pathways, leading to phosphorylation of downstream targets GSK-3β and FoxO1/3a. Treatment with 5-ASA suppressed BCL-3 expression in colorectal cancer cells.

Conclusions: Our study helps to unravel the mechanism by which BCL-3 is linked to poor prognosis in colorectal cancer; we suggest that targeting BCL-3 activity represents an exciting therapeutic opportunity potentially increasing the sensitivity of tumour cells to conventional therapy.

Keywords: APOPTOSIS; CANCER PREVENTION; COLORECTAL CANCER; INFLAMMATION; NUCLEAR FACTOR KAPPA B.


Figures

Figure 1
Figure 1
B-cell CLL/lymphoma 3 (BCL-3) is expressed in colorectal tumour tissue and cell lines and BCL-3 promotes the growth of colorectal tumour cells in vivo. (A) Western blot showing validation of BCL-3 antibody; the BCL-3 antibody used in this study detects two distinct bands that represent the BCL-3 protein in its phosphorylated (p-BCL-3) and unphosphorylated form (as shown in cells treated with lambda-phosphatase, 400 units for 2 h). (B) Immunohistochemistry (IHC) staining: (a) tonsil positive control for BCL-3 immunoreactivity yields strong nuclear staining of all but superficial keratinocytes, along with a scattered subset of inflammatory cells. (b) Normal colon showing moderate BCL-3 immunoreactivity in epithelial cell cytoplasm, with occasional strong positive cells (arrows). (c) Area of carcinoma showing strong cytoplasmic and nuclear BCL-3. The endothelium of the artery shows nuclear and cytoplasmic immunoreactivity (arrow). (d) In this tumour sample, the bulk of the tumour glands show weak or absent BCL-3 immunoreactivity, although foci of nuclear positivity are present (arrows). Original objective magnification; a×20; b–d×10. (C) IHC staining: (a) area of carcinoma with no staining for BCL-3 (left panel), strong cytoplasmic immunoreactivity for nuclear factor (NF)-κB1 (centre) and no staining in the absence of either primary antibody (right). (b) Area of carcinoma with nuclear BCL-3 staining (left panel), NF-κB1 staining (centre) and no staining in the absence of either primary antibody (right): no overall correlation between BCL-3 and NF-κB1 staining was detected. (D) Western analysis to determine BCL-3 and NF-κB1 protein expression in a panel of colorectal adenoma-derived and carcinoma-derived cell lines. TA, transformed adenoma. (E) Graph representing SW480 tumour growth in athymic nude mice: groups of six nude mice were injected with SW480 cells stably expressing either wildtype (wt)BCL-3, mutant (mut)BCL-3 expression or vector control plasmids (ii shown by western blotting) and tumour size was measured over 30 days. Mean values were plotted with SDs. Analysis of variance ***p<0.001, **p<0.01, *p<0.05, NS, non-significant. Note: the phosphorylation status and therefore the stability of the mutBCL-3 protein is affected by the ANK M123 mutation (Alain Chariot, personal communication, 2011); to compensate, the amount of expression plasmid was adjusted accordingly (refer to online supplementary figure S1).
Figure 1
Figure 1
B-cell CLL/lymphoma 3 (BCL-3) is expressed in colorectal tumour tissue and cell lines and BCL-3 promotes the growth of colorectal tumour cells in vivo. (A) Western blot showing validation of BCL-3 antibody; the BCL-3 antibody used in this study detects two distinct bands that represent the BCL-3 protein in its phosphorylated (p-BCL-3) and unphosphorylated form (as shown in cells treated with lambda-phosphatase, 400 units for 2 h). (B) Immunohistochemistry (IHC) staining: (a) tonsil positive control for BCL-3 immunoreactivity yields strong nuclear staining of all but superficial keratinocytes, along with a scattered subset of inflammatory cells. (b) Normal colon showing moderate BCL-3 immunoreactivity in epithelial cell cytoplasm, with occasional strong positive cells (arrows). (c) Area of carcinoma showing strong cytoplasmic and nuclear BCL-3. The endothelium of the artery shows nuclear and cytoplasmic immunoreactivity (arrow). (d) In this tumour sample, the bulk of the tumour glands show weak or absent BCL-3 immunoreactivity, although foci of nuclear positivity are present (arrows). Original objective magnification; a×20; b–d×10. (C) IHC staining: (a) area of carcinoma with no staining for BCL-3 (left panel), strong cytoplasmic immunoreactivity for nuclear factor (NF)-κB1 (centre) and no staining in the absence of either primary antibody (right). (b) Area of carcinoma with nuclear BCL-3 staining (left panel), NF-κB1 staining (centre) and no staining in the absence of either primary antibody (right): no overall correlation between BCL-3 and NF-κB1 staining was detected. (D) Western analysis to determine BCL-3 and NF-κB1 protein expression in a panel of colorectal adenoma-derived and carcinoma-derived cell lines. TA, transformed adenoma. (E) Graph representing SW480 tumour growth in athymic nude mice: groups of six nude mice were injected with SW480 cells stably expressing either wildtype (wt)BCL-3, mutant (mut)BCL-3 expression or vector control plasmids (ii shown by western blotting) and tumour size was measured over 30 days. Mean values were plotted with SDs. Analysis of variance ***p<0.001, **p<0.01, *p<0.05, NS, non-significant. Note: the phosphorylation status and therefore the stability of the mutBCL-3 protein is affected by the ANK M123 mutation (Alain Chariot, personal communication, 2011); to compensate, the amount of expression plasmid was adjusted accordingly (refer to online supplementary figure S1).
Figure 2
Figure 2
B-cell CLL/lymphoma 3 (BCL-3) expression inhibits apoptosis in colorectal cancer cells. (A) Suppression of BCL-3 expression significantly decreased the total cell yield and increased cell death compared with negative small interfering (si)RNA-transfected HCT116 cells 72 h post transfection. Suppression of BCL-3 protein expression was confirmed by western analysis. (B) BCL-3 overexpression significantly increased the total cell yield and decreased cell death compared with control plasmid-transfected SW480 cells 72 h post transfection. Overexpression of BCL-3 was confirmed by western analysis. (C) Treatment with 5 μM QVD (pan-caspase inhibitor) for 72 h reduced cell death significantly in control and BCL-3 knockdown HCT116 cells confirming induction of apoptosis following suppression of BCL-3 expression (***p<0.001, **p<0.01, NS, non-significant). Western analysis confirmed suppression of BCL-3 expression in QVD-treated HCT116 cells. Fluorescence-activated cell sorting analysis showed a significant increase in apoptosis (determined as sub-G1 peak, arrows) from 11.4% to 27.5% following BCL-3 suppression. In cells treated with QVD, apoptosis is inhibited in both control and BCL-3 knockdown cells (arrows). Results are representative of a single experiment performed in duplicate, assessed 72 h post transfection. (D) The decrease in cell death on stable overexpression of wildtype (wt)BCL-3 was not detected when the ANK M123 mutant (mut)BCL-3 was stably overexpressed compared with control plasmid-transfected SW480 cells 72 h after seeding. Overexpression of BCL-3 and mutBCL-3 was confirmed by western analysis.
Figure 2
Figure 2
B-cell CLL/lymphoma 3 (BCL-3) expression inhibits apoptosis in colorectal cancer cells. (A) Suppression of BCL-3 expression significantly decreased the total cell yield and increased cell death compared with negative small interfering (si)RNA-transfected HCT116 cells 72 h post transfection. Suppression of BCL-3 protein expression was confirmed by western analysis. (B) BCL-3 overexpression significantly increased the total cell yield and decreased cell death compared with control plasmid-transfected SW480 cells 72 h post transfection. Overexpression of BCL-3 was confirmed by western analysis. (C) Treatment with 5 μM QVD (pan-caspase inhibitor) for 72 h reduced cell death significantly in control and BCL-3 knockdown HCT116 cells confirming induction of apoptosis following suppression of BCL-3 expression (***p<0.001, **p<0.01, NS, non-significant). Western analysis confirmed suppression of BCL-3 expression in QVD-treated HCT116 cells. Fluorescence-activated cell sorting analysis showed a significant increase in apoptosis (determined as sub-G1 peak, arrows) from 11.4% to 27.5% following BCL-3 suppression. In cells treated with QVD, apoptosis is inhibited in both control and BCL-3 knockdown cells (arrows). Results are representative of a single experiment performed in duplicate, assessed 72 h post transfection. (D) The decrease in cell death on stable overexpression of wildtype (wt)BCL-3 was not detected when the ANK M123 mutant (mut)BCL-3 was stably overexpressed compared with control plasmid-transfected SW480 cells 72 h after seeding. Overexpression of BCL-3 and mutBCL-3 was confirmed by western analysis.
Figure 3
Figure 3
B-cell CLL/lymphoma 3 (BCL-3) expression promotes survival in colorectal adenoma cells. (A) RG/C2 adenoma cells were transfected with BCL-3 or negative small interfering (si)RNA and survival measured 72 h post transfection. Suppression of BCL-3 expression significantly decreased the total cell yield and increased cell death compared with negative siRNA-transfected RG/C2 cells. Suppression of BCL-3 protein expression was confirmed by western analysis. (B) RG/C2 cells were transfected with BCL-3 expression or control plasmid (1 μg) and survival measured 72 h post transfection. BCL-3 overexpression significantly increased the total cell yield and decreased apoptosis compared with control plasmid-transfected RG/C2 cells. Overexpression of BCL-3 was confirmed by western analysis.
Figure 4
Figure 4
Phosphorylation of AKT and its downstream targets is increased in cells expressing high levels of B-cell CLL/lymphoma 3 (BCL-3): pro-survival effect of BCL-3 expression is mediated by AKT activation. (A) Western analysis of AKT, FoxO1/3a and GSK-3β phosphorylation following increased expression of wildtype (wt)BCL-3 or the ANK M123 mutant (mut)BCL-3. SW480 cells were transfected with wtBCL-3 or mutBCL-3 expression or control plasmids. Overexpression of wt and mutBCL-3 was confirmed (48–72 h post transfection). AKT phosphorylation at T308 and S473 was increased in cells overexpressing wtBCL-3 but not mutBCL-3 while levels of total AKT remained unchanged. Phosphorylation of AKT downstream targets FoxO1/3a and GSK-3β was also increased in the wtBCL-3 but not mutBCL-3-expressing cells. (B) Confocal microscopy of p-AKT (S473) (red) in SW480 and HCT116 cells transfected with FLAG-tagged BCL-3 (green) or control plasmid. Increased AKT phosphorylation was detected in HCT116 cells overexpressing BCL-3 as well as neighbouring cells with low BCL-3 (arrows). Cell nuclei were stained with 4′,6-diamidino-2-phenylindole (DAPI) (blue). (C) Cells grown in transwells (maintaining a physical separation between the two populations while allowing sharing of the growth medium) for 72 h prior to western analysis. Overexpression of BCL-3 was detected only in cells grown in the top chamber, leading to an increase in AKT phosphorylation (S473) compared with controls. AKT phosphorylation was also increased in untransfected SW480 cells sharing medium with cells overexpressing BCL-3. Samples run on the same western, quantification of AKT phosphorylation by densitometry, normalised to its control is shown. (D) Western analysis of AKT, FoxO1/3a and GSK-3β phosphorylation following suppression of BCL-3 expression. HCT116 cells were transfected with BCL-3 or negative small interfering (si)RNA. BCL-3 expression was suppressed throughout the time course (48–72 h post transfection). AKT phosphorylation at T308 and S473 was decreased in BCL-3 knockdown cells while levels of total AKT remained unchanged. Phosphorylation of AKT downstream targets FoxO1/3a and GSK-3β was also decreased. (E) Co-expression of constitutively active myristoylated AKT (myr-AKT) completely abrogates the induction of apoptosis following suppression of BCL-3 expression. HCT116 cells were transfected with BCL-3 or negative siRNA and subsequently myr-AKT or control plasmid. Suppression of BCL-3 expression decreased cell yield and increased apoptosis 72 h post transfection. HCT116 cells that lack BCL-3 but express myr-AKT show a similar percentage of apoptosis as control plasmid-transfected cells while no difference in the total cell yield could be detected, western analysis confirmed suppression of BCL-3. Strong AKT phosphorylation was detected in cells co-transfected with myr-AKT, ***p<0.001, NS, non-significant.
Figure 4
Figure 4
Phosphorylation of AKT and its downstream targets is increased in cells expressing high levels of B-cell CLL/lymphoma 3 (BCL-3): pro-survival effect of BCL-3 expression is mediated by AKT activation. (A) Western analysis of AKT, FoxO1/3a and GSK-3β phosphorylation following increased expression of wildtype (wt)BCL-3 or the ANK M123 mutant (mut)BCL-3. SW480 cells were transfected with wtBCL-3 or mutBCL-3 expression or control plasmids. Overexpression of wt and mutBCL-3 was confirmed (48–72 h post transfection). AKT phosphorylation at T308 and S473 was increased in cells overexpressing wtBCL-3 but not mutBCL-3 while levels of total AKT remained unchanged. Phosphorylation of AKT downstream targets FoxO1/3a and GSK-3β was also increased in the wtBCL-3 but not mutBCL-3-expressing cells. (B) Confocal microscopy of p-AKT (S473) (red) in SW480 and HCT116 cells transfected with FLAG-tagged BCL-3 (green) or control plasmid. Increased AKT phosphorylation was detected in HCT116 cells overexpressing BCL-3 as well as neighbouring cells with low BCL-3 (arrows). Cell nuclei were stained with 4′,6-diamidino-2-phenylindole (DAPI) (blue). (C) Cells grown in transwells (maintaining a physical separation between the two populations while allowing sharing of the growth medium) for 72 h prior to western analysis. Overexpression of BCL-3 was detected only in cells grown in the top chamber, leading to an increase in AKT phosphorylation (S473) compared with controls. AKT phosphorylation was also increased in untransfected SW480 cells sharing medium with cells overexpressing BCL-3. Samples run on the same western, quantification of AKT phosphorylation by densitometry, normalised to its control is shown. (D) Western analysis of AKT, FoxO1/3a and GSK-3β phosphorylation following suppression of BCL-3 expression. HCT116 cells were transfected with BCL-3 or negative small interfering (si)RNA. BCL-3 expression was suppressed throughout the time course (48–72 h post transfection). AKT phosphorylation at T308 and S473 was decreased in BCL-3 knockdown cells while levels of total AKT remained unchanged. Phosphorylation of AKT downstream targets FoxO1/3a and GSK-3β was also decreased. (E) Co-expression of constitutively active myristoylated AKT (myr-AKT) completely abrogates the induction of apoptosis following suppression of BCL-3 expression. HCT116 cells were transfected with BCL-3 or negative siRNA and subsequently myr-AKT or control plasmid. Suppression of BCL-3 expression decreased cell yield and increased apoptosis 72 h post transfection. HCT116 cells that lack BCL-3 but express myr-AKT show a similar percentage of apoptosis as control plasmid-transfected cells while no difference in the total cell yield could be detected, western analysis confirmed suppression of BCL-3. Strong AKT phosphorylation was detected in cells co-transfected with myr-AKT, ***p<0.001, NS, non-significant.
Figure 5
Figure 5
B-cell CLL/lymphoma 3 (BCL-3) expression promotes cell survival in hypoxic growth conditions. (A) SW480 cells transfected with BCL-3 expression or control plasmid were placed in 1% O2 for 48 h. Hypoxia significantly decreased cell yield and increased apoptosis in control plasmid-transfected cells. BCL-3 overexpression in 1% O2 decreased cell death to that observed for control plasmid-transfected cells in normoxia. Western analysis showed successful overexpression of BCL-3 in 1% O2. Expression of HIF-1α was detected in cells placed in 1% O2. Total AKT levels increased in 1% O2 (only seen in this cell line). AKT phosphorylation at S473 was increased in cells overexpressing BCL-3 in 1% O2 as well as normoxia. (B) HCT116 cells were transfected with BCL-3 or negative small interfering (si)RNA were placed in 1% O2 for 48 h. AKT phosphorylation at S473 was decreased in BCL-3 siRNA-transfected cells in hypoxia as well as normoxia, while levels of total AKT remained unchanged. Western analysis showed successful suppression of BCL-3 in 1% O2.
Figure 6
Figure 6
B-cell CLL/lymphoma 3 (BCL-3) increases survival of colorectal carcinoma cells that is dependent on nuclear factor (NF)-κB p50/p52 binding. (A) SW480 cells were stably transfected with wildtype (wt)BCL-3, mutant (mut)BCL-3 (NF-κB p50/p52 binding mutant) or control plasmid. The total cell yield was significantly increased and apoptosis decreased in cells overexpressing wtBCL-3 protein compared with mutBCL-3 or control plasmid-transfected cells. Western analysis showed AKT phosphorylation at S473 was only increased in cells overexpressing the wtBCL-3 protein. Note: the phosphorylation status and therefore the stability of the mutBCL-3 protein is affected by the ANK M123 mutation (Alain Chariot, personal communication, 2011); to compensate, the amount of expression plasmid was adjusted accordingly (refer to online supplementary figure S1). (B) SW480 cells were transfected with both NF-κB1 and NF-κB2, or negative small interfering (si)RNA and subsequently transfected with the BCL-3 expression or control plasmid. Apoptosis was decreased and AKT phosphorylation increased in cells transfected with the BCL-3 expression plasmid/negative siRNA compared with negative/negative controls. In contrast, no difference in the percentage of cell death and no increase in p-AKT levels could be detected between cells overexpressing BCL-3 and controls when both NF-κB1 and NF-κB2 expression were suppressed. Note: suppression of NF-κB1/NF-κB2 increased endogenous p-AKT that was not sufficient to overcome apoptosis induced by suppression of both NF-κBs. Importantly, no further increase in p-AKT was detected in BCL-3 overexpressing cells in the absence of NF-κB1 and NF-κB2. Quantification of AKT phosphorylation by densitometry normalised to its control is shown. Data was assessed 72 h post transfection. ***p<0.001, **p<0.01, NS, non-significant.
Figure 7
Figure 7
B-cell CLL/lymphoma 3 (BCL-3)-mediated survival is dependent on PI3K and mTOR activation. (A) HCT116 cells were transfected with BCL-3 or negative small interfering (si)RNA. Western analysis showing BCL-3 expression was suppressed throughout the time course (24–96 h post transfection). PTEN and phospho-PTEN expression remained unchanged throughout the time course of the experiment. (B) SW480 cells transfected with either BCL-3 expression or control plasmid were treated with 20 nM Wortmannin (PI3K inhibitor), 100 nM PP242 (mTOR inhibitor) or both inhibitors at the same time for 72 h. Overexpression of BCL-3 resulted in a significant increase in cell yield and decrease in apoptosis in untreated SW480 cells. Apoptosis was increased in Wortmannin (PI3K inhibitor) as well as PP242 (mTOR inhibitor) treated cells compared with untreated controls. No difference in apoptosis or cell yield could be detected comparing control and BCL-3 expression plasmid-transfected cells when PI3K and mTOR activation were simultaneously inhibited. Results are mean values from three independent experiments performed in duplicate normalised to controls, **p<0.01, *p<0.05, NS, non-significant. (C) Western analysis confirmed BCL-3 overexpression in treated and untreated cells. AKT phosphorylation (S473) is decreased in Wortmannin and PP242-treated control plasmid-transfected cells. p-AKT was increased in treated cells overexpressing BCL-3. In contrast, AKT phosphorylation was undetectable in cells simultaneously treated with Wortmannin and PP242. Data was assessed 72 h post transfection.
Figure 8
Figure 8
Treatment with 5-aminosalicylic acid (5-ASA) decreases B-cell CLL/lymphoma 3 (BCL-3) expression in colorectal cancer cells. Low BCL-3 expressing SW480 (A) and high BCL-3 expressing HCT116 (B) and HCA7 (C) cells were seeded for 48 h prior to treatment with 20 mM 5-ASA. Data was assessed at 24, 48 and 72 h post treatment. Western analysis showed expression of BCL-3 was decreased in all cells at 24, 48 and 72 h. Quantification of BCL-3 by densitometry normalised to its control is shown. (D) The high endogenous BCL-3 expressing cells (HCT116 and HCA7) were seeded for 48 h prior to treatment with 0, 10 or 20 mM 5-ASA. Western analysis shows BCL-3 expression was suppressed with 10 and 20 mM 5-ASA 48 h post treatment.

References

    1. Ferlay J, Soerjomataram I, Ervik M, et al. GLOBOCAN 2012 v1.0, Cancer Incidence and Mortality Worldwide: IARC CancerBase No. 11, Colorectal Cancer [Internet]. Lyon, France: International Agency for Research on Cancer, 2013. http://globocan.iarc.fr/Pages/fact_sheets_cancer.aspx (accessed 07/08/2014).
    1. Cancer Research UK. Bowel cancer incidence report [Internet]. Cancer Research UK, 2014. http://www.cancerresearchuk.org/cancer-info/cancerstats/types/bowel/inci... (accessed 07/08/2014).
    1. Kaidi A, Williams AC, Paraskeva C. Interaction between beta-catenin and HIF-1 promotes cellular adaptation to hypoxia. Nat Cell Biol 2007;9:210–17. 10.1038/ncb1534 - DOI - PubMed
    1. Petherick KJ, Williams AC, Lane JD, et al. Autolysosomal β-catenin degradation regulates Wnt-autophagy-p62 crosstalk. EMBO J 2013;32:1903–16. 10.1038/emboj.2013.123 - DOI - PMC - PubMed
    1. Albini A, Sporn MB. The tumour microenvironment as a target for chemoprevention. Nat Rev Cancer 2007;7:139–47. 10.1038/nrc2067 - DOI - PubMed

MeSH terms