. 2015 Jun 29;212(7):1125-37.
doi: 10.1084/jem.20142237. Epub 2015 Jun 1.

Genetic absence of PD-1 promotes accumulation of terminally differentiated exhausted CD8+ T cells

Affiliations

Genetic absence of PD-1 promotes accumulation of terminally differentiated exhausted CD8+ T cells

Pamela M Odorizzi et al. J Exp Med. .

Abstract

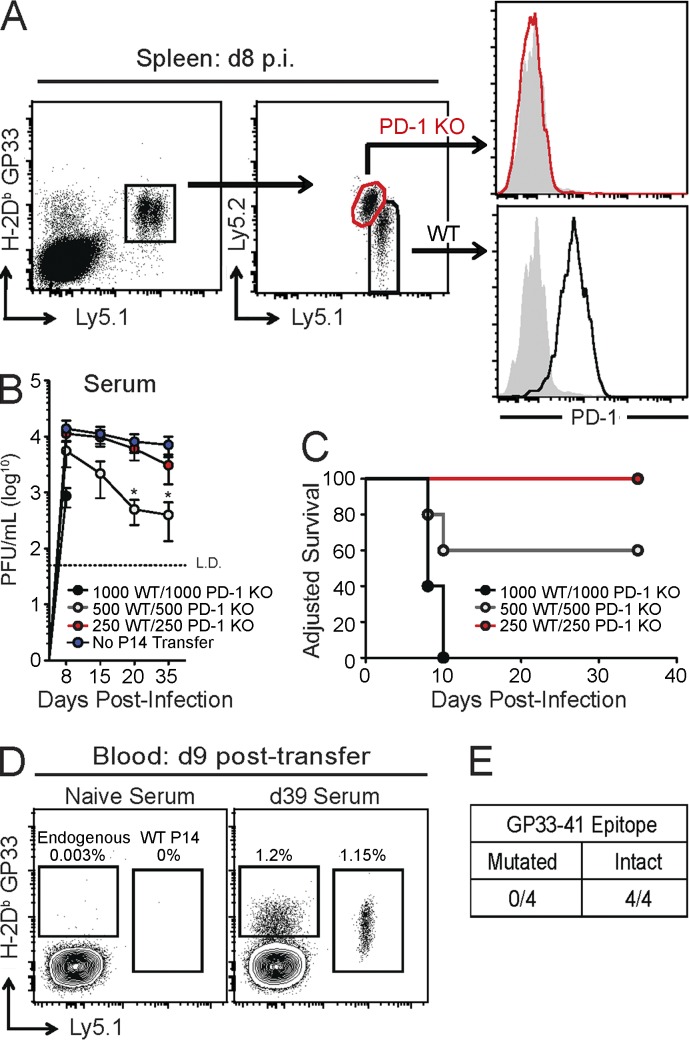
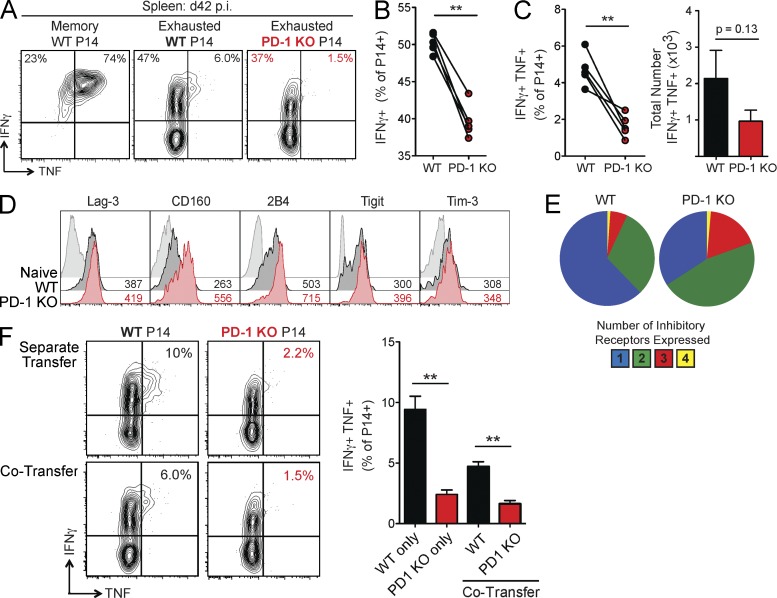
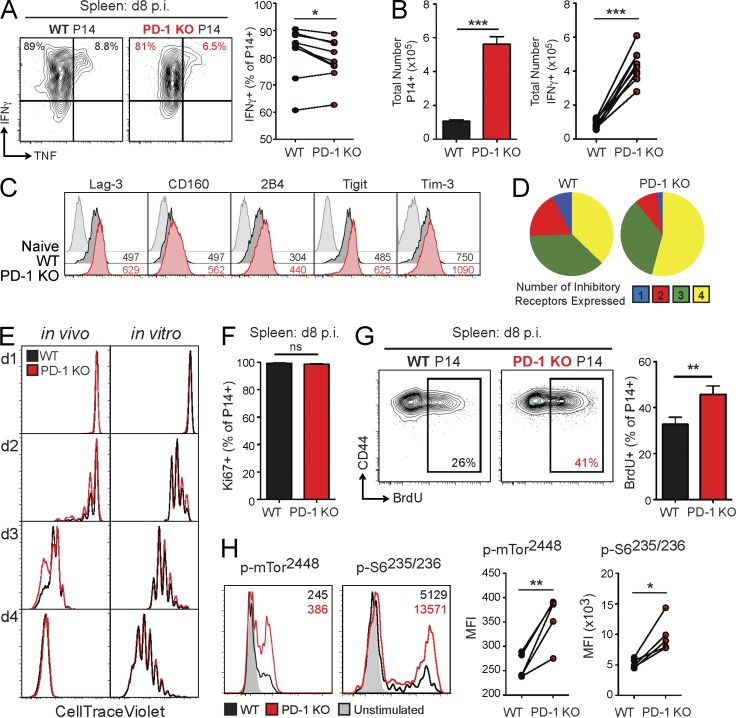
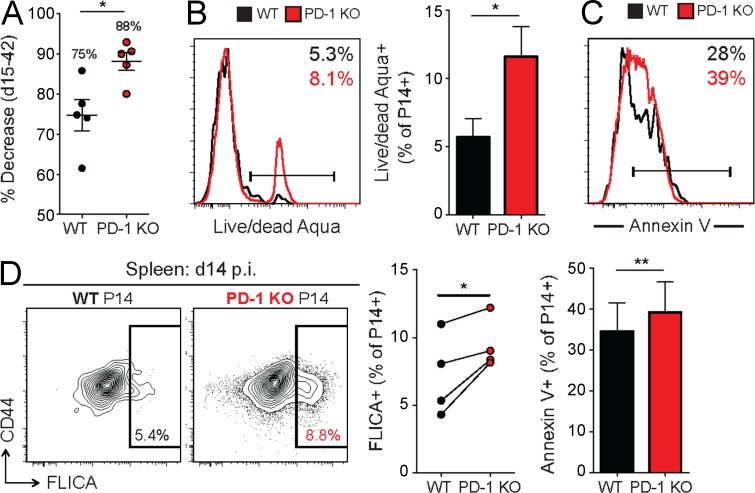
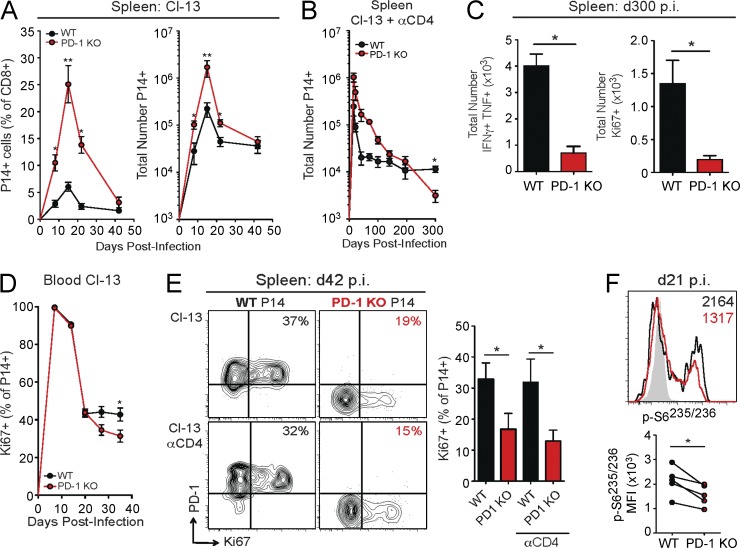
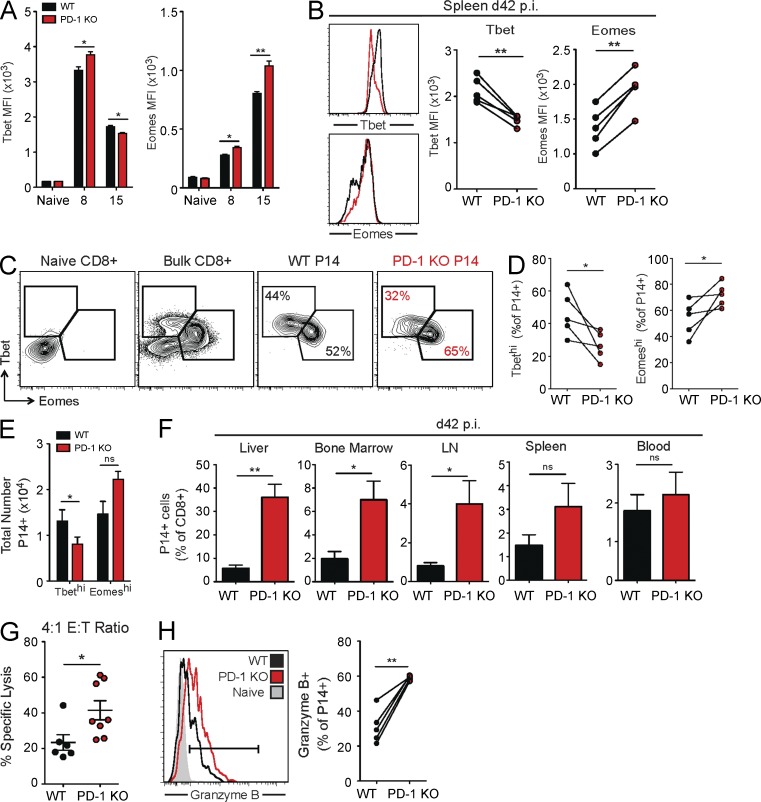
Programmed Death-1 (PD-1) has received considerable attention as a key regulator of CD8(+) T cell exhaustion during chronic infection and cancer because blockade of this pathway partially reverses T cell dysfunction. Although the PD-1 pathway is critical in regulating established "exhausted" CD8(+) T cells (TEX cells), it is unclear whether PD-1 directly causes T cell exhaustion. We show that PD-1 is not required for the induction of exhaustion in mice with chronic lymphocytic choriomeningitis virus (LCMV) infection. In fact, some aspects of exhaustion are more severe with genetic deletion of PD-1 from the onset of infection. Increased proliferation between days 8 and 14 postinfection is associated with subsequent decreased CD8(+) T cell survival and disruption of a critical proliferative hierarchy necessary to maintain exhausted populations long term. Ultimately, the absence of PD-1 leads to the accumulation of more cytotoxic, but terminally differentiated, CD8(+) TEX cells. These results demonstrate that CD8(+) T cell exhaustion can occur in the absence of PD-1. They also highlight a novel role for PD-1 in preserving TEX cell populations from overstimulation, excessive proliferation, and terminal differentiation.


Figures

Figure 1.
Figure 1.
Adoptive transfer of WT and PD-1 KO P14 cells as a model to study T cell exhaustion in the absence of PD-1. In brief, CD8+ T cells were isolated from peripheral blood of naive WT or PD-1 KO P14 mice. WT and PD-1 KO P14 cells were mixed at a 1:1 ratio (250 cells each), adoptively transferred into naive recipient mice, and infected with LCMV clone 13. (A) Representative FACS plots of gating scheme for WT and PD-1 KO P14 cells. P14 cells were gated from total CD8+ T cells (far left) by expression of H-2Db GP33 tetramer, congenic markers, and PD-1, as indicated (shaded gray: antibody isotype control). (B) Longitudinal analysis of viral load in serum of mice that received the indicated numbers of WT and PD-1 KO P14 cells followed by infection with LCMV clone 13 (±SEM). *, P < 0.05 (unpaired Student’s t test). (C) Survival curve of mice that received the indicated numbers of WT and PD-1 KO P14 cells after LCMV clone 13 infection. “Adjusted Survival” indicates loss of >20% of total body weight and subsequent euthanasia. (D) Representative FACS plots of endogenous GP33 and WT P14 responses in naive mice at day 9 posttransfer after inoculation with serum from a naive mouse or from a mouse that received co-adoptive transfer of WT and PD-1 KO P14 cells followed by LCMV clone 13 infection (day 39 p.i.). Values indicate frequency of endogenous GP33 and P14 responses as a percentage of CD8+ T cells. (E) Summary of the number of naive WT mice with (intact) or without (mutated) GP33-specific T cell responses after inoculation with serum from mice with WT and PD-1 KO P14 cells. All data are representative of three independent experiments with at least four mice per group (A–E).
Figure 2.
Figure 2.
CD8+ T cell exhaustion develops in the absence of PD-1. WT and PD-1 KO P14 cells were mixed at a 1:1 ratio (250 cells each), adoptively transferred into naive recipient mice, and infected with LCMV clone 13. For some experiments, 500 WT or 500 PD-1 KO P14 cells were transferred into separate naive recipient mice. P14 responses were then analyzed during the chronic phase of infection (day 42 p.i.) in the spleen. (A) Intracellular cytokine staining for IFNγ and TNF after stimulation with GP33 peptide (left). Values indicate the frequency of P14 cells producing IFNγ and/or TNF for individual mice at day 42 p.i. (B) Summary of the frequency of P14 cells producing IFNγ for multiple mice. (C) Summary of the frequency (left) and total number (right) of P14 cells coproducing IFNγ and TNF for multiple mice. (D) Protein expression of the indicated inhibitory receptors on naive CD8+ T cells, WT P14 cells, and PD-1 KO P14 cells of individual mice. Values indicate MFI of expression by FACS. (E) Boolean gating analysis of the simultaneous protein expression of multiple inhibitory receptors (Lag-3, 2B4, CD160, and Tim-3) on WT and PD-1 KO P14 cells. Pie charts display individual populations grouped according to total number of inhibitory receptors expressed. (F) Intracellular cytokine staining for IFNγ and TNF after stimulation with GP33 peptide for mice with separate transfer of WT or PD-1 KO P14 cells compared with mice with co-transferred WT and PD-1 KO P14 cells (left). Values indicate the frequency of P14 cells coproducing IFNγ and TNF for individual (left) and multiple mice (right). All error bars indicate ±SEM. **, P < 0.01 (all paired Student’s t test [A–E] except unpaired Student’s t test for separate transfer of P14 cells [F]). All data are representative of three to five independent experiments with at least five mice per group.
Figure 3.
Figure 3.
Early changes in proliferation and functionality of PD-1 KO P14 cells. For in vivo experiments, WT and PD-1 KO P14 cells were mixed at a 1:1 ratio (250 cells each), adoptively transferred into naive recipient mice, and infected with LCMV clone 13. P14 responses were then analyzed at the indicated time points. For early time points (days 1–4), a 1:1 ratio of mixed WT and PD-1 KO P14 cells (2.6 × 10⁶ cells each) was adoptively transferred before infection. (A) Intracellular cytokine staining for IFNγ and TNF after stimulation with GP33 peptide (left). Values indicate the frequency of P14 cells producing IFNγ and TNF for individual (left) and multiple mice (right) at day 8 p.i. in the spleen. (B) Total number of WT and PD-1 KO P14 cells (left) and IFNγ-producing cells (right) at day 8 p.i. in the spleen. (C) Protein expression of the indicated inhibitory receptors by naive CD8+ T cells, WT P14 cells, and PD-1 KO P14 cells at day 8 p.i. in the spleens of individual mice. Values indicate MFI of expression by FACS. (D) Boolean gating analysis of the simultaneous protein expression of multiple inhibitory receptors (Lag-3, 2B4, CD160, and Tim-3) by WT and PD-1 KO P14 cells at day 8 p.i. in the spleen. Pie charts display individual populations grouped according to total number of inhibitory receptors expressed. (E) Expression of CTV as a measure of proliferation on WT and PD-1 KO P14 cells on the indicated days p.i. with LCMV clone 13 in the spleen (left) or after in vitro stimulation with GP33-pulsed splenocytes (right) by FACS. (F) Summary of the frequency of Ki67+ WT and PD-1 KO P14 cells for multiple mice at day 8 p.i. in the spleen. (G) Expression of CD44 versus BrdU incorporation in WT and PD-1 KO P14 cells at day 8 p.i. in the spleen after 24-h BrdU pulse for individual (left) and multiple (right) mice. Values indicate the frequency of P14 cells positive for BrdU based on FMO staining control. (H) Representative FACS histograms of protein expression of p-mTor2448 and p-S6235/236 by WT and PD-1 KO P14 cells at day 8 p.i. in the spleen after stimulation with GP33 peptide for 60 min. Values indicate MFI for phospho-proteins for individual mice (left) and multiple mice (right). All error bars indicate ±SEM. *, P < 0.05; **, P < 0.01; ***, P < 0.001 (paired Student’s t test) for all graphs (A–H). All data are representative of two to five independent experiments with five to eight mice per group.
Figure 4.
Figure 4.
Reduced survival of PD-1 KO P14 cells during T cell contraction. WT and PD-1 KO P14 cells were mixed at a 1:1 ratio (250 cells each), adoptively transferred into naive recipient mice, and infected with LCMV clone 13. P14 responses were then analyzed at the indicated time points. (A) Percent decrease in the frequency of WT and PD-1 KO P14 cells from peak of T cell response (day 15 p.i.) to chronic phase of infection (day 42 p.i.). Values indicate the mean percent decrease for each population. (B and C) Expression of LIVE/DEAD Aqua (B) and Annexin V (C) as a measure of cell death in WT and PD-1 KO P14 cells at day 18 p.i. in the spleen for individual (histograms) and multiple mice (bar graphs). Values indicate the frequency of P14 cells positive for staining based on FMO staining controls. (D) Expression of CD44 versus FLICA in WT and PD-1 KO P14 cells at day 14 p.i. in the spleen for individual (left) and multiple mice (right). Values indicate the frequency of P14 cells positive for FLICA dye based on FMO staining control. All error bars indicate ±SEM. *, P < 0.05; **, P < 0.01 (paired Student’s t test for B–D and unpaired Student’s t test for A) for all graphs (A–D). All data are representative of three independent experiments with at least four mice per group.
Figure 5.
Figure 5.
Diminished long-term proliferation and stability of CD8+ T cells in the absence of PD-1. WT and PD-1 KO P14 cells were mixed at a 1:1 ratio (250 cells each), adoptively transferred into naive recipient mice, and infected with LCMV clone 13. In CD4-depleted mice, αCD4 was given at days −1 and 1 p.i. P14 responses were then analyzed at the indicated time points. (A) Longitudinal analysis of the frequency (left) and absolute numbers (right) of WT and PD-1 KO P14 cells in the spleen during LCMV clone 13 infection. (B) Longitudinal analysis of the total number of WT and PD-1 KO P14 cells in the spleen of CD4-depleted mice with LCMV clone 13 infection. (C) Summary of the total numbers of WT and PD-1 KO P14 cells coproducing IFNγ and TNF (left) or Ki67+ (right) at day 300 p.i. in the spleen. (D) Longitudinal analysis of the frequency of Ki67+ WT and PD-1 KO P14 cells in the blood during LCMV clone 13 infection. (E) Protein expression of PD-1 versus Ki67 in WT and PD-1 KO P14 cells at day 42 p.i. in the spleen during infection with LCMV clone 13 with (bottom) or without (top) CD4 depletion. Values indicate the frequency of P14 cells positive for Ki67. (F) Representative histogram of protein expression of p-S6235/236 in WT and PD-1 KO P14 cells at day 21 p.i. in the spleen after stimulation with GP33 peptide for 60 min. Values indicate the MFI of expression for phospho-proteins for individual mice (top) and multiple mice (bottom). All error bars indicate ±SEM. *, P < 0.05; **, P < 0.01 (paired Student’s t test) for all graphs (A–F). All data are representative of three independent experiments with at least five mice per group.
Figure 6.
Figure 6.
Altered dynamics of TEX cell subsets in the absence of PD-1. WT and PD-1 KO P14 cells were mixed at a 1:1 ratio (250 cells each), adoptively transferred into naive recipient mice, and infected with LCMV clone 13. P14 responses were then analyzed at the indicated time points. (A) Summary of the MFI of Tbet and Eomes in WT and PD-1 KO P14 cells in the spleen at days 0 (naive), 8, and 15 p.i. with LCMV clone 13. (B) Representative FACS histograms of Tbet and Eomes expression in WT and PD-1 KO P14 cells for individual (left) and multiple (right) mice at day 42 p.i. in the spleen. (C) Protein expression of Tbet versus Eomes in WT and PD-1 KO P14 cells at day 42 p.i. in the spleen of individual mice. Values indicate the frequency of P14 cells that are TbethiEomeslo or EomeshiTbetlo. (D and E) Total frequency (D) and numbers (E) of WT and PD-1 KO P14 TbethiEomeslo and EomeshiTbetlo cells at day 42 p.i. in the spleen. (F) Frequency of P14 cells as a percentage of total CD8+ T cells in multiple organs at day 42 p.i. with LCMV clone 13, as indicated. (G) Cytotoxicity of sorted WT and PD-1 KO P14 cells on day 22 p.i. at an E/T ratio of 4:1 after 18-d incubation. (H) Expression of Granzyme B in naive CD8+ T cells, WT P14 cells, and PD-1 KO P14 cells in individual (left) and multiple mice (right). All error bars indicate ±SEM. *, P < 0.05; **, P < 0.01 (paired Student’s t test for A–F and H and unpaired Student’s t test for G) for all graphs (A–H). All data are representative of two to five independent experiments with at least five mice per group.

References

    1. Barber D.L., Wherry E.J., Masopust D., Zhu B., Allison J.P., Sharpe A.H., Freeman G.J., and Ahmed R.. 2006. Restoring function in exhausted CD8 T cells during chronic viral infection. Nature. 439:682–687. 10.1038/nature04444 - DOI - PubMed
    1. Blackburn S.D., Shin H., Freeman G.J., and Wherry E.J.. 2008. Selective expansion of a subset of exhausted CD8 T cells by αPD-L1 blockade. Proc. Natl. Acad. Sci. USA. 105:15016–15021. 10.1073/pnas.0801497105 - DOI - PMC - PubMed
    1. Blackburn S.D., Shin H., Haining W.N., Zou T., Workman C.J., Polley A., Betts M.R., Freeman G.J., Vignali D.A., and Wherry E.J.. 2009. Coregulation of CD8+ T cell exhaustion by multiple inhibitory receptors during chronic viral infection. Nat. Immunol. 10:29–37. 10.1038/ni.1679 - DOI - PMC - PubMed
    1. Blank C., Brown I., Peterson A.C., Spiotto M., Iwai Y., Honjo T., and Gajewski T.F.. 2004. PD-L1/B7H-1 inhibits the effector phase of tumor rejection by T cell receptor (TCR) transgenic CD8+ T cells. Cancer Res. 64:1140–1145. 10.1158/0008-5472.CAN-03-3259 - DOI - PubMed
    1. Blattman J.N., Wherry E.J., Ha S.-J., van der Most R.G., and Ahmed R.. 2009. Impact of epitope escape on PD-1 expression and CD8 T-cell exhaustion during chronic infection. J. Virol. 83:4386–4394. 10.1128/JVI.02524-08 - DOI - PMC - PubMed

Publication types

MeSH terms

Substances