. 2015 May 29;20(6):10047-64.
doi: 10.3390/molecules200610047.

A 1H-NMR-Based Metabonomic Study on the Anti-Depressive Effect of the Total Alkaloid of Corydalis Rhizoma

Affiliations

A 1H-NMR-Based Metabonomic Study on the Anti-Depressive Effect of the Total Alkaloid of Corydalis Rhizoma

Hongwei Wu et al. Molecules. .

Abstract

Corydalis Rhizoma, named YuanHu in China, is the dried tuber of Corydalis yanhusuo W.T. Wang which is used in Traditional Chinese Medicine for pain relief and blood activation. Previous pharmacological studies showed that apart from analgesics, the alkaloids from YuanHu may be useful in the therapy of depression by acting on the GABA, dopamine and benzodiazepine receptors. In this study, the antidepressive effect of the total alkaloid of YuanHu (YHTA) was investigated in a chronic unpredictable mild stress (CUMS) rat model using 1H-NMR-based metabonomics. Plasma metabolic profiles were analyzed and multivariate data analysis was applied to discover the metabolic biomarkers in CUMS rats. Thirteen biomarkers of CUMS-introduced depression were identified, which are myo-inositol, glycerol, glycine, creatine, glutamine, glutamate, β-glucose, α-glucose, acetoacetate, 3-hydroxybutyrate, leucine and unsaturated lipids (L7, L9). Moreover, a metabolic network of the potential biomarkers in plasma perturbed by CUMS was detected. After YHTA treatment, clear separation between the model group and YHTA-treated group was achieved. The levels of all the abnormal metabolites mentioned above showed a tendency of restoration to normal levels. The results demonstrated the therapeutic efficacy of YHTA against depression and suggested that NMR-based metabolomics can provide a simple and easy tool for the evaluation of herbal therapeutics.

Keywords: 1H-NMR; OPLS-DA; corydalis rhizoma; depression; metabonomics; plasma; total alkaloids of YuanHu (YHTA).


Conflict of interest statement

The authors declare no conflict of interest.

Figures

Figure 1
Figure 1
Effect of YHTA and venlafaxineon behavioralchanges in rats exposed to CUMS on the 21th day (mean ± SD, n = 8). Control: control group; CUMS: CUMS model group; Venlafaxine: venlafaxine group; YHTA-H: High dose group of YHTA; YHTA-M: Middle dose group of YHTA; YHTA-L: Low dose group of YHTA. * p < 0.05 vs. control group, ** p < 0.01 vs. control group, # p < 0.05 vs. model group, ## p < 0.01 vs. model group.
Figure 1
Figure 1
Effect of YHTA and venlafaxineon behavioralchanges in rats exposed to CUMS on the 21th day (mean ± SD, n = 8). Control: control group; CUMS: CUMS model group; Venlafaxine: venlafaxine group; YHTA-H: High dose group of YHTA; YHTA-M: Middle dose group of YHTA; YHTA-L: Low dose group of YHTA. * p < 0.05 vs. control group, ** p < 0.01 vs. control group, # p < 0.05 vs. model group, ## p < 0.01 vs. model group.
Figure 2
Figure 2
Representative 1H-NMR spectra (δ 0.5–6.0 and δ 6.2–9.0) of plasma obtained from groups A, B, C, D, E and F, which refer to the blank control group, model group, positive drug group, low dose group, middle dose group, high dose group, respectively. The region of δ6.2–9.0 (on the left side) was magnified 20 times compared with corresponding region of δ0.5–6.0 for the purpose of clarity. Keys: 1: phenylalanine; 2: histidine; 3: formate; 4: tyrosine; 5: α-glucose; 6: β-glucose; 7: α- & β-glucose; 8: citrate; 9: VLDL (L4), CH3-(CH2)n-; 10: VLDL (L2), CH3-(CH2)n-; 11: HOD; 12: glycine; 13,15: methionine; 14: glutamine; 16: acetate; 17: 3-hydroxybutyrate (3-HB); 18: isobutyrate; 19: lipid (L10), -CH=CH-; 20, 22: creatine; 21: glycerol of lipids; 23: lipid (L9), =CH-CH2-CH=; 24: lipid (L8), -CH2-C=O; 25: lipid (L6), -CH2-CH2-CH=CH-; 26: VLDL (L5), -CH2-CH2-C=O; 27: LDL (L3), CH3-(CH2)n-; 28: LDL (L1), CH3-(CH2)n-; 29, 30: myo-inositol; 31: phosphor-choline/glycerol-phosphocholine; 32: N,N-dimethylglycine; 33: pyruvate; 34: lipid (L7), ‑CH2-CH=CH-; 35: alanine; 36: isoleucine; 37: urea; 38, 43: lactate; 39: betaine; 40: malonate; 41: acetoacetate; 42: N-acetylglycoprotein signals; 44: leucine; 45: allanotin; 46: threonine; 47, 49, 52, 53: lysine; 48: cholesterol; 50, 51: glutamate; 54: valine.
Figure 3
Figure 3
PCA scores plot based on NMR spectra of plasma obtained from different groups. C: Control group; T: CUMS Model group; D: positive drug; L: Low dose group of YHTA; M: Middle dose group of YHTA; H: High dose group of YHTA.
Figure 4
Figure 4
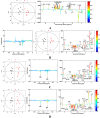
OPLS-DA scores plots (left panel) derived from 1H-NMR spectra of plasma and corresponding coefficient loading plots (middle and right panel) obtained from different dosage groups. The color maps show the significance of metabolites variations between the two classes. A. Control (C) vs. Model (T); B. Model (T) vs. Positive drug (D); C. Model (T) vs. Low dose group of YHTA(L); D. Mode (T) vs. Middle dose group of YHTA (M);E. Model (T) vs. High dose group of YHTA (H).
Figure 4
Figure 4
OPLS-DA scores plots (left panel) derived from 1H-NMR spectra of plasma and corresponding coefficient loading plots (middle and right panel) obtained from different dosage groups. The color maps show the significance of metabolites variations between the two classes. A. Control (C) vs. Model (T); B. Model (T) vs. Positive drug (D); C. Model (T) vs. Low dose group of YHTA(L); D. Mode (T) vs. Middle dose group of YHTA (M);E. Model (T) vs. High dose group of YHTA (H).
Figure 5
Figure 5
Metabolic network of the potential biomarkers in plasma that changed between the CUMS rats and normal controls. Significantly increased metabolites in the CUMS group are shown in red. Significantly decreased metabolites in the CUMS group are shown in blue. Levels of the potential biomarkers had a tendency to recover after intervention on CUMS treated rats with YHTA.

References

    1. Charney D.S. Monoamine dysfunction and the pathophysiology and treatment of depression. J. Clin. Psychiatry. 1998;59:11–14. - PubMed
    1. Sarko J. Antidepressants, old and new: A review of their adverse effects and toxicity in overdose. Emerg. Med. Clin. N. Am. 2000;18:637–654. doi: 10.1016/S0733-8627(05)70151-6. - DOI - PubMed
    1. Lucena M.I., Carvajal A., Andrade R.J., Velasco A. Antidepressant-induced hepatotoxicity. Expert Opin. Drug Saf. 2003;2:249–262. doi: 10.1517/14740338.2.3.249. - DOI - PubMed
    1. Pharmacopoeia of the People’s Republic of China 2010. Volume 1. Chemical Industry Press; Beijing, China: 2010. Editorial Committee for the Pharmacopoeia of the People’s Republic of China; p. 133.
    1. Wang X.L., Zheng Z., Hong Z., Fan G. Advancements on chemical components and quality control of rhizoma corydalis. Lishizhen Med. Mater. Med. Res. 2011;22:227–229.

Publication types

MeSH terms

LinkOut - more resources